Navigating the complexities of the housing market can be daunting for real estate agents, investors, and homebuyers. With market conditions constantly in flux, understanding the current health and future trends is paramount for making informed decisions. Whether you’re looking to invest, conduct research for your clients, or purchase a new home, a deep understanding of the housing market indicators is indispensable.
We explore crucial housing market indicators and how to read the real estate market signals to understand the current housing market status and its trajectory for 2024.
1. Increasing Interest Rates
Interest rates are a primary driver in the real estate market. Lower interest rates usually stimulate buying a house in the current market by making mortgages more affordable. For real estate agents and brokers, low rates often mean higher demand as buyers are more inclined to secure loans.
However, investors may find low rates advantageous for refinancing properties. Low interest rates can also fuel a seller’s market because of buyer demand, causing bidding wars and ultimately granting sellers increased negotiation power and higher selling prices.
According to Freddie Mac, current mortgage market conditions show rates have continued to climb to nearly 8% in 2023, and the demand for purchases remains at a three-decade low. Mortgage application volume plummeted by 22% compared to the prior year. The encouraging aspect is that both incomes and the economy are seeing steady growth, but still face the issue of housing affordability.
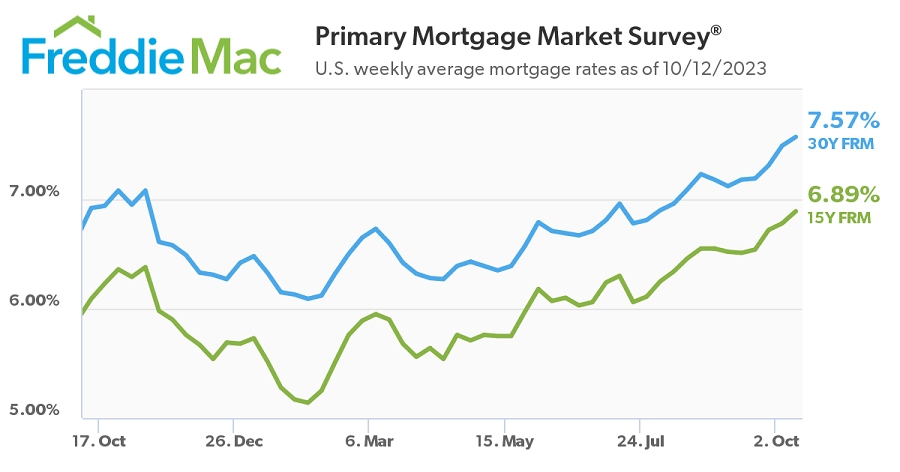
Weekly average mortgage rates (Source: Freddie Mac)
2. Economic Indicators
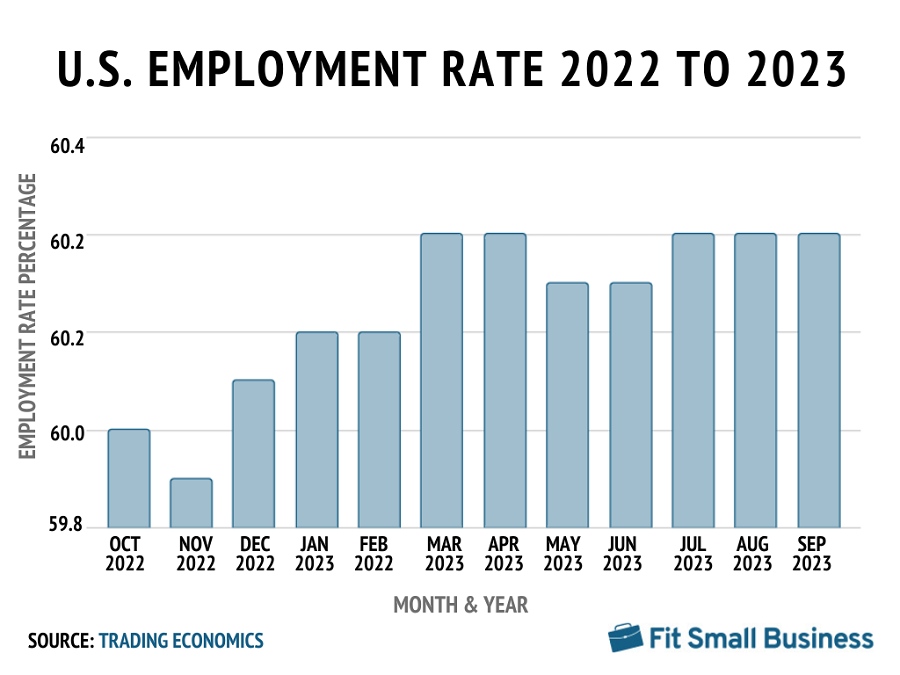
Economic indicators like gross domestic product, employment rates, and consumer spending can significantly impact housing demand and prices. In September 2023, the U.S. economy saw a notable increase in job growth by adding 336,000 jobs compared to 227,000 in August 2023. Despite this uptick in employment, the overall unemployment rate remained constant at 3.8%, considered a healthy percentage.
When people are employed and earning well, they are more likely to make significant financial decisions, such as buying a home. Understanding how to read the real estate market in this context is vital. This heightened demand from buyers is beneficial for agents, as it increases the number of potential clients and the speed at which transactions occur.
Agents will also see a rise in exclusive listing opportunities from sellers looking to capitalize on the stronger pool of qualified homebuyers. A strong economy for investors and property owners signifies that people can afford higher rents and are more likely to keep rental commitments, leading to more stable income streams.
3. Housing Supply Dynamics
An imbalance between supply and demand can either push prices up or bring them down. By the end of 2022, the supply of single-family homes for sale had slightly recovered from pandemic lows. But 2023 still saw a decline in the number of new listings, dropping 16% in the first quarter. The constrained supply might stem from current homeowners’ reluctance to relocate due to increasing interest rates.
The limited house market inventory paves the way for a rise in new construction homes to increase its share of the market. As of March 2023, 425,000 new single-family homes were on the market, a 5% year-over-year increase but a substantial 28% hike compared to the same time frame in 2019.
Agents and investors should capitalize on this trend by focusing on building and promoting new construction homes to potential buyers who may be frustrated by the limited pre-existing inventory.
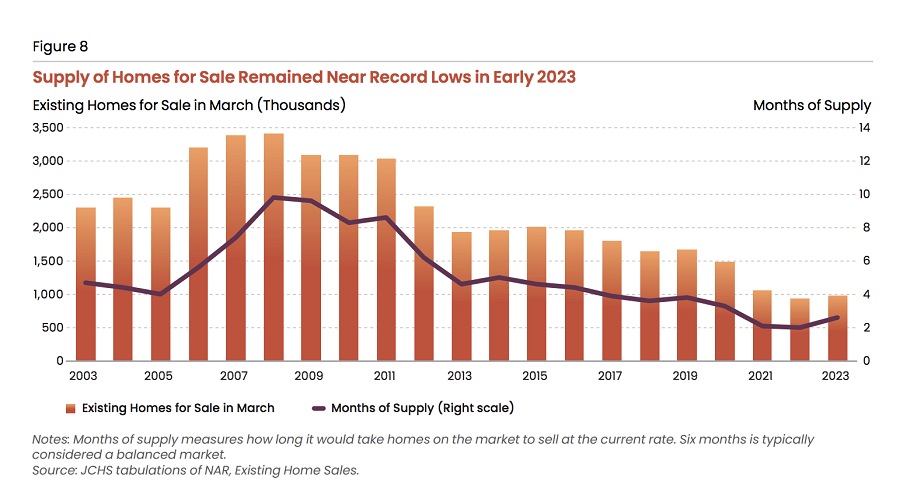
Housing supply chart (Source: Harvard)
4. Location Factors
Real estate professionals know that location dictates demand. The National Association of Realtors (NAR) analyzed metropolitan area construction against employment rates. The findings indicate that in approximately two-thirds of the measured metro areas, homebuilding activity for all types of housing is lagging.
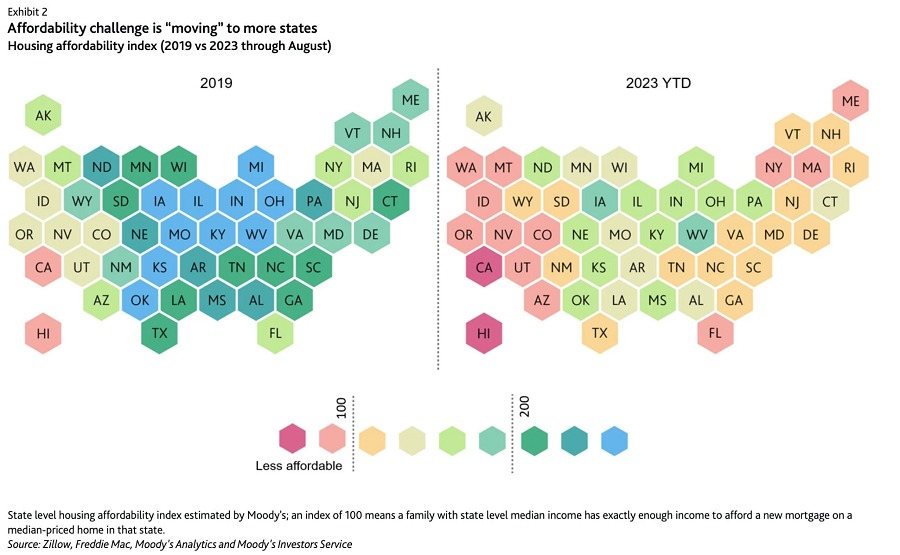
This suggests a widespread issue of limited housing supply across various locations, potentially leading to increased competition and prices in those areas. NAR reported that each of the top 10 metropolitan regions experienced a minimum year-over-year price hike of 10.4%, with the Midwest being home to six of these markets.
Agents and investors can consider capitalizing on the increased pricing or diversifying their portfolio and listings to include properties in emerging markets.
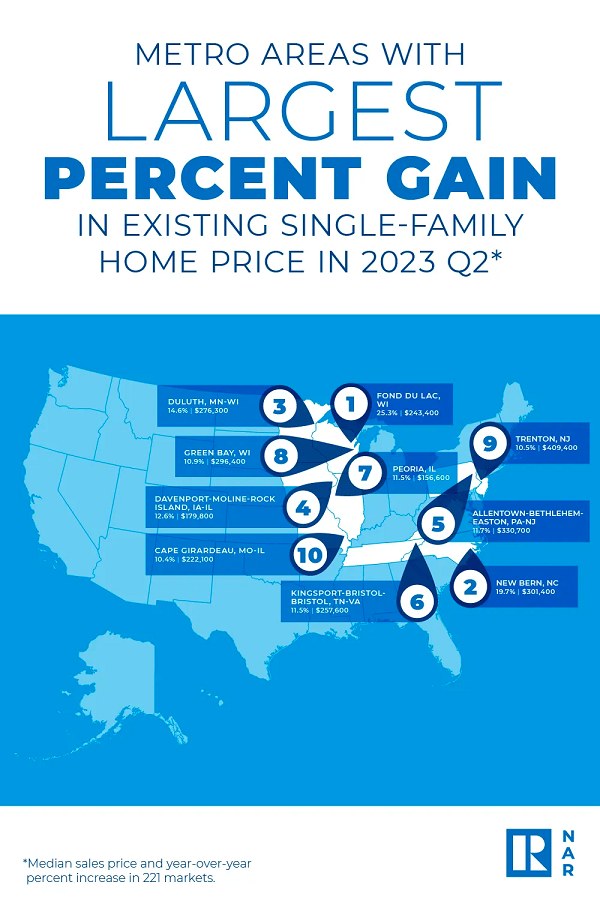
Housing prices in top 10 metro cities (Source: NAR)
5. Government Policies Shaping the Housing Market
Regulations like zoning or rent control can significantly affect property values and investment returns. In 2023, HUD announced it is allocating $85 million in competitive grants to help communities eliminate obstacles to affordable housing production and preservation. This funding aims to increase the availability of cost-effective housing options.
Boosting affordable housing enhances financial stability, racial equity, and social and economic justice. Agents may see an uptick in first-time homebuyers who previously couldn’t afford to enter the market. For investors, affordable housing initiatives can offer tax incentives or subsidies, making it a more attractive investment option.
Housing affordability chart (Source: Yahoo)
6. Housing Prices
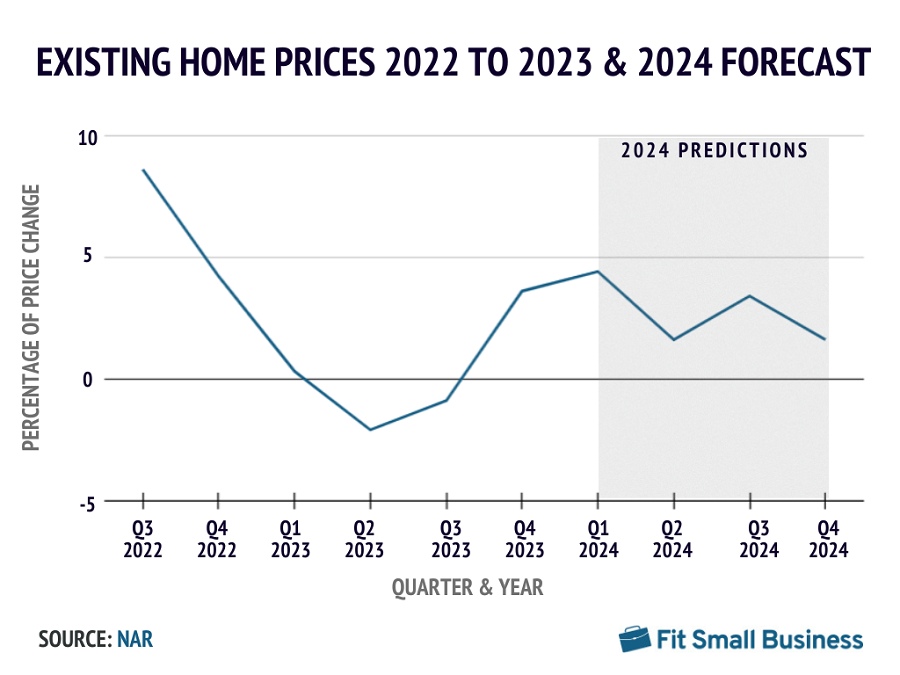
Housing prices serve as important housing market indicators for the real estate market’s health. Rising prices often indicate a seller’s market, where high demand and low supply empower sellers to ask for higher prices. Falling or stagnant prices can signal a buyer’s market and are characterized by lower demand or increased supply.
NAR’s Quarterly U.S. Economic Forecast indicated the median home price for August 2023 was approximately $397,500.00, a 2.1% drop for existing home prices from the prior year. This decline suggests that the market might shift from a seller’s market to a balanced or a buyer’s market. For agents and brokers, this could mean recalibrating client expectations about home value and sale speed.
7. Demographic Shifts Affecting Demand
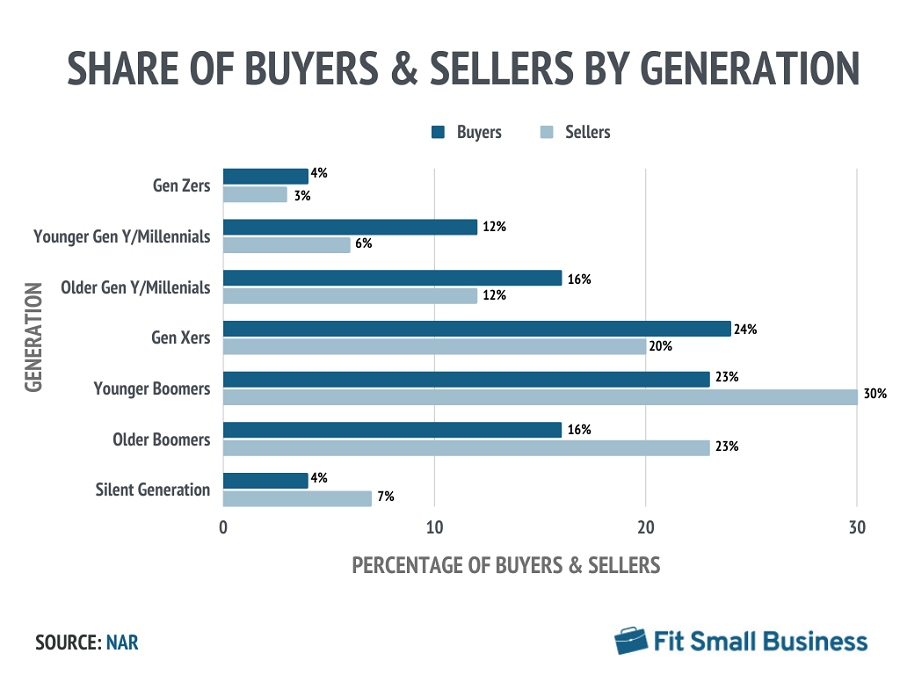
The most recent NAR Home Buyers and Sellers Generational Trends Report highlights a decline in Millennial homebuying. While Millennial homebuying takes up a substantial segment at 28%, their share has decreased. The main obstacles delaying Millennial home purchases are student loan debt and elevated rental expenses, which hinder savings.
Specifically, 35% of younger Millennials cited student loan debt, with an average balance of $30,000, while 30% of older Millennials reported an average debt of $40,000.
Knowing that these financial constraints affect a Millennial’s ability to save for a down payment can guide professionals in suggesting alternative financing options or lower-cost properties. Tailoring services and communications to address these specific challenges can make agents and brokers more effective in reaching and assisting this key demographic.
8. Technology’s Growing Influence
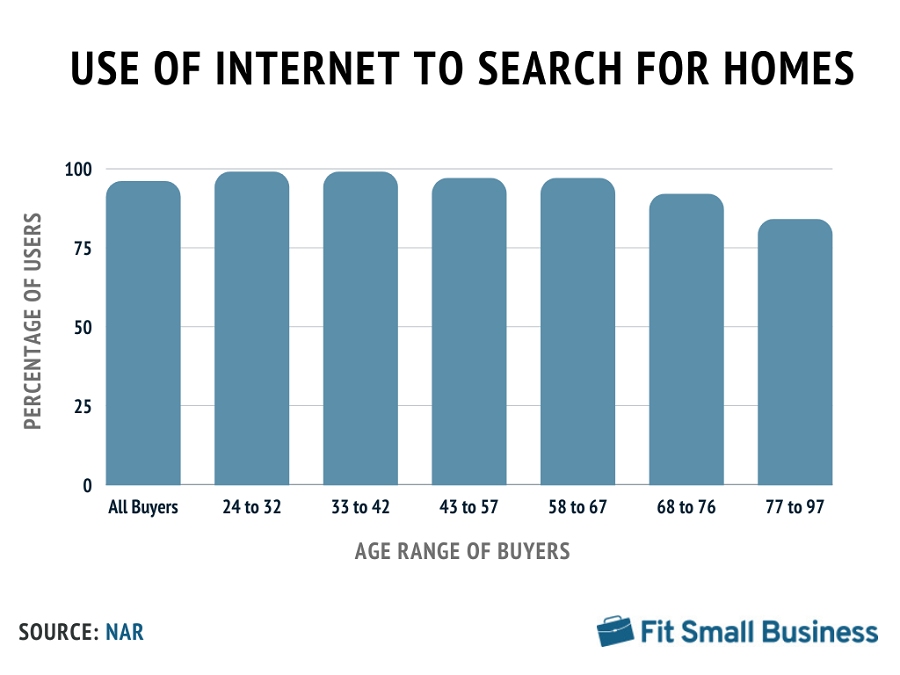
Online platforms and virtual tours are revolutionizing real estate transactions, affecting market speed and accessibility. With the advent of virtual tours and online listings, market accessibility has increased. Agents and brokers should adapt to technological changes to stay competitive. The pandemic has helped accelerate this shift. Ninety-six percent of homebuyers searched the internet when buying a house in this market, and 49% did a walk-through online.
9. Natural Disasters & Market Resilience
Severe weather and natural disasters have immediate and enduring effects on the housing market, affecting property values. Floods and severe weather have affected over 43% of adults in the past 12 months. Real estate stakeholders who embrace eco-friendly measures are better positioned to draw socially aware tenants and investors. Additionally, these climatic disruptions are driving increased government incentives, making it more financially viable for investors to pursue sustainable development.
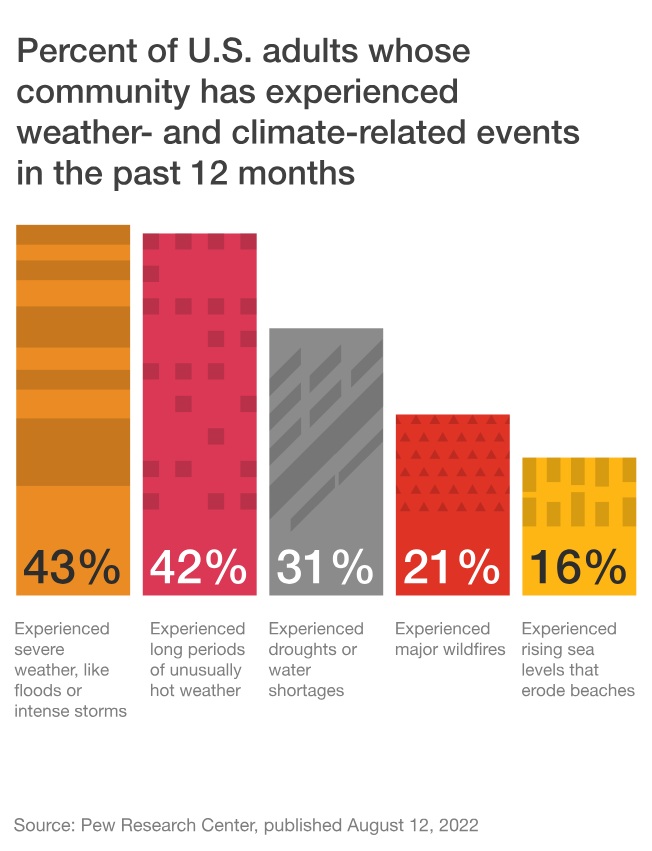
Weather and climate-related events affecting adults (Source: PwC)
10. Seasonal Real Estate Markets
Seasonal market cycles have a large impact on shaping the housing market. Traditionally, spring and summer are considered peak seasons for buying and selling. This time frame is characterized by higher prices and quicker sales. However, fall and winter often see lower demand, providing potential advantages for buyers.
A housing market metric like months of supply lets real estate professionals gauge the amount of time required to deplete the current home inventory at the existing sales pace. As of September 2023, the average months of supply stands at two months, a decline from the beginning of the year. This suggests a market favoring sellers, characterized by strong demand, limited inventory, and rising prices. Real estate professionals should be agile in low-supply markets and prepare their clients for maximum flexibility.
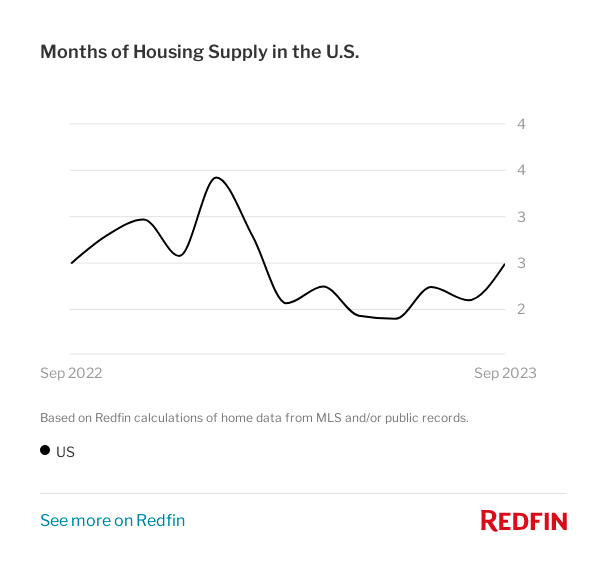
Months of housing supply in U.S. (Source: Redfin)
Based on Housing Market Indicators, Will 2024 Be Better or Worse?
The predominant sentiment when looking into 2024 indicates a housing market that continues to lean toward a real estate seller’s market rather than buyers. Though mortgage rates are expected to dip to around 6.1% by year’s end, they are unlikely to return to the record lows witnessed in 2021. The U.S. economy is also predicted to slow down with increased unemployment rates and lower inflation.
NAR forecasts a significant rise in existing home sales to climb by 15.5% in 2024. Given this surge in demand, increasing the housing supply is imperative to broaden accessibility for prospective homebuyers. Strategic planning around construction and inventory management will be crucial for real estate professionals aiming to capitalize on this heightened market activity.
Bottom Line
Understanding the housing market is pivotal for real estate professionals in shaping their strategies to acquire new businesses and meet client demands. By vigilantly tracking these essential market indicators, they can adjust their tactics to align with current housing market indicators. This informed approach allows them to make decisions rooted in data to enhance client outcomes while driving overall business performance.