Facebook ads cost an average of 51.3 cents for cost-per-click (CPC) and $8.77 per thousand views (CPM) in 2023. Thanks to precise audience targeting abilities, Facebook ads are an effective way to gain brand awareness, leads, and sales. Advertisers only need to spend a minimum of $1 a day to run ads on Facebook, making it a viable channel for promoting businesses of all budget sizes. Learn more about the cost of Facebook ads and how to improve your results.
Average Facebook Ads Cost-per-Click, Impressions & Action

Revealbot data, which is updated on a weekly basis based on hundreds of millions of ad spend per month, shows that the average Facebook Ad cost-per-click across all industries is 51.3 cents. This is the result for the time range of January 2023 to July 2023. The average cost per mille (thousand impressions), or CPM, in this period is $8.77.
While average prices have decreased over the past year, keep in mind that costs vary greatly, and all advertisers must meet the minimum $1 per day to run their ads on Facebook. Some businesses and industries will have average costs below—and above—these for 2023:
- Cost-per-click (CPC): 51.3 cents
- Cost per mille, or thousand views (CPM): $8.77
- Cost per engagement: 7.3 cents
- Cost per lead: $5.84
For an example of how varied costs can be, let’s take a look at a different measure that provides a cost industry breakdown for 2023—cost per action, also known as cost per acquisition (CPA). A company in the apparel industry that uses Facebook to advertise their product catalog sees an average cost per action of $11. However, a finance company sees a cost per action of $41.
Cost per action, or cost per acquisition (CPA), is the price for an action on your app or website after engaging with the ad, such as a purchase, subscription, or newsletter signup.
The reason for the difference is largely related to user interest. For social media marketing, users tend to use the platform for leisure, making apparel ads more enticing for most users. Ads about finance, on the other hand, are not likely to be as appealing. Small businesses can increase return on ad spend (ROAS) with Facebook advertising by understanding the market and targeting the right audience.
Factors Affecting Facebook Advertising Costs
Facebook Ads run on a bidding system, similar to Google Ads (see our comparison of the two services). Thus, competition plays a large part in how much an advertiser will have to spend to reach their target audience.
Ad placement and impressions are also impacted by overall ad quality, as Facebook wants to show only the most relevant ads to individual users. This is important for user experience (UX) on the platform, as seeing a bunch of irrelevant ads could cause a person to use Facebook less or stop using the platform altogether. So, Facebook has a vested interest in ensuring ad relevance for each user.
Generally, ads with the highest ad quality and bid will be placed, and average costs-per-(click, acquisition, impression) should be lower than ads Facebook deems of low quality. Here are the three main factors Facebook looks at to determine ad placement and cost:
- Bid: The amount of money an advertiser is willing to pay (lifetime and daily budget of a campaign)
- Audience relevance: Beyond targeting, ads receiving high engagement show they are the most relevant and will receive more placements
- Projected conversions: As users are engaging with ads, the ads getting conversions will see more placement
To get your ad to display, start with a highly targeted audience, a competitive bid, and ads tailored to spark engagement with your audience. Once your ad is live and users are engaging with it, Facebook will consider the ad’s high quality and may reduce the price while increasing reach.
Ready to start spending money on Facebook advertising? Read our step-by-step article showing how to create a Facebook ad.
Facebook Ad Costs by Industry
The most recent data on Facebook ad costs per industry is based on WordStream’s 2019 Facebook ad benchmarks. Facebook advertising costs vary by business and industry, though the overall average CPC across all industries is $1.68. The cheapest industry is food and drink, with a 42-cent Facebook ad cost-per-click while the most expensive is internet and telecom with a $3.07 CPC.
Average Facebook Ads CPC, CR & CPA by Industry
Industry | Avg. Click-through Rate (CTR) | Avg. Cost-per-Click (CPC) | Avg. Conversion Rate (CR) | Avg. Cost per Acquisition (CPA) |
|---|---|---|---|---|
Beauty & Fitness | 1.02% | $1.85 | 11.65% | $38.33 |
Business & Industrial | 0.89% | $2.48 | 10.65% | $23.80 |
Finance | 0.58% | $3.89 | 8.98% | $41.28 |
Food & Drink | 1.20% | $0.42 | 3.98% | $12.91 |
Hobbies & Leisure | 0.93% | $0.68 | 2.91% | $21.99 |
Home & Garden | 0.71% | $2.78 | 7.02% | $44.23 |
Internet & Telecom | 0.68% | $3.07 | 10.03% | $29.95 |
Jobs & Education | 0.55% | $2.11 | 12.82% | $18.36 |
News | 1.05% | $1.11 | 2.15% | $56.89 |
People & Society | 0.85% | $2.01 | 5.62% | $33.21 |
Pets & Animals | 1.68% | $0.61 | 3.27% | $15.29 |
Real Estate | 0.98% | $1.81 | 10.67% | $16.52 |
Science | 0.45% | $1.33 | 11.04% | $12.67 |
Overall Average | 0.89% | $1.68 | 9.11% | $19.68 |
(Source: WordStream) | ||||
Facebook Business Advertising Cost Trends
The landscape of Facebook business advertising costs fluctuated from 2021 to 2022 as seen in the average CPC. Other key performance indicators, such as the average cost per engagement (CPE) and cost per lead (CPL) have also significantly changed in the last year.
The average Facebook cost-per-click decreased by a massive 20.95% in a span of one year. Cost per engagement has also followed this trend with a 17.5% drop, which contributes to a lower average cost in general. Nevertheless, the biggest change measured in this data source is a sharp increase in average cost per lead (CPL) by 21.88%.
Cost per lead (CPL) is the amount paid for every lead generated. A lead is an individual or organization that has interacted with your brand and has the potential to be a customer.
Facebook Ads Cost Change From 2021-2022
2021 | 2022 | Percent Change | |
|---|---|---|---|
Average CPC | $1.05 | $0.83 | -20.95% |
Average CPE | $0.12 | $0.099 | -17.5% |
Average CPL | $6.72 | $8.19 | +21.88% |
(Source: Revealbot) | |||
How to Calculate Return on Ad Spend (ROAS) of Facebook Ads
First, decide how much to spend on Facebook Ads monthly. Next, estimate how many clicks per month you’ll receive by dividing your budget by your industry’s average CPC. Then multiply the estimated monthly clicks by the average conversion rate to find your number of new customers per month. And finally, multiply that by your estimated customer lifetime value (CLV) to calculate your revenue return on ad spend (ROAS).
Estimate your Facebook Ads ROAS with a calculator or spreadsheet in five steps:
1. Determine Your Estimated Monthly Ad Spend
First, consider how much you would want to allocate toward Facebook ads per month. Facebook has a minimum daily ad spend of $1, so you will at least need to determine a budget of $31 per month.
For reference, the average small business has a Facebook advertising cost of around $1,000 to $3,000 per month. However, you can achieve results with a minimum spend, such as a week-long ad campaign or boosted post with a $50 budget.
2. Calculate Your Estimated Monthly Clicks
Next, find your industry’s average cost-per-click (CPC). With your average CPC, calculate your estimated monthly clicks by dividing your monthly ad spend by your average CPC.
Equation: Monthly ad spend / Industry CPC = Estimated monthly clicks

For example, let’s say your business is in the fitness industry and your monthly ad spend is about $800. Per the table above, your industry’s CPC is $1.85. That would equate to 432 clicks per month.
Example: $800 / $1.85 = 432 clicks
3. Estimate Your Monthly Conversions
To estimate how many conversions your ad might yield each month, multiply your number of monthly clicks by your conversion rate.
Equation: Monthly clicks x average conversion rate = Conversions
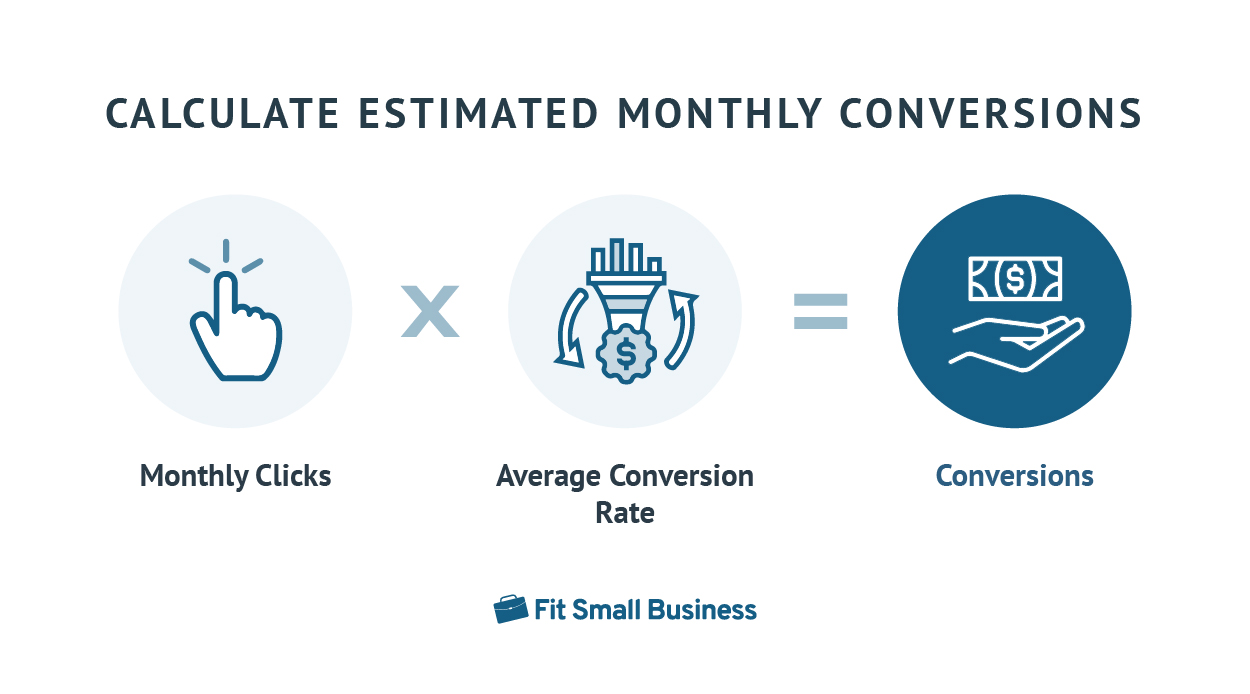
Continuing the example above, the industry average conversion rate for fitness is 11.65%. With 432 clicks per month, you’re acquiring 50 new customers per month.
Example: 432 x 11.65% (or 0.1165) = 50 new customers acquired per month
4. Estimate Your Potential Ad Revenue
To estimate the potential revenue expected to be generated by your ad, multiply the number of conversions per month (if your conversion point is a new customer) by your average customer’s lifetime value (CLV)—in other words, how much a new customer is worth to your business in the long term.
Equation: Number of new customers x Customer lifetime value = Revenue generated

In the case of the fitness business above, let’s use $100 as our example as the CLV. Multiplied by 50 customers, the fitness business generates $5,000 in new revenue every month from ad spend.
Example: 50 x $100 = $5,000 projected revenue generated from your monthly ad spend
The average customer lifetime value (CLV) is based on an individual business’ historical data. We discuss this and other relevant metrics in our article for sales metrics to improve performance.
5. Determine Return on Ad Spend
Subtract your monthly ad spend from the revenue generated to find your estimated return on ad spend. Effective advertising should yield a profit. If you’re not at least breaking even, you may want to work with a professional Facebook advertising agency like LYFE Marketing, or allocate spend to other advertising channels.
Equation: (Revenue generated / monthly ad spend) * 100 = Estimated return on ad spend
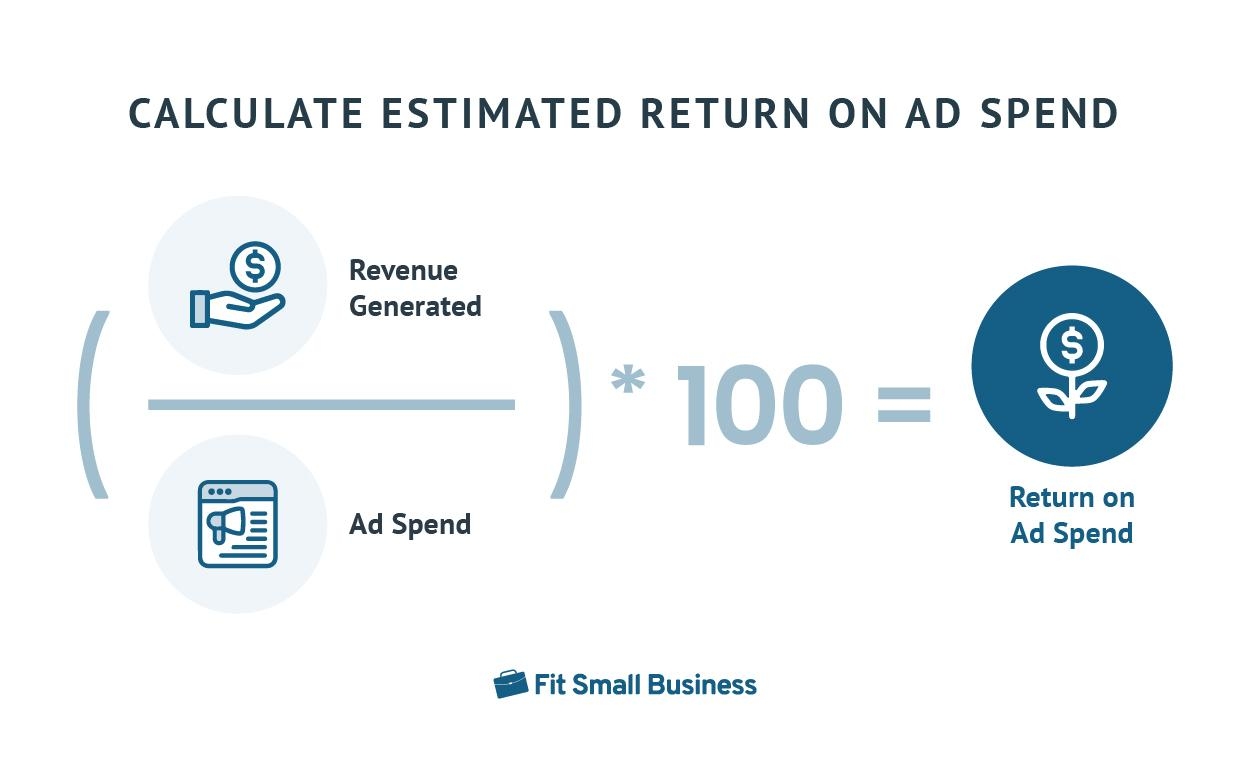
As the final piece of the fitness business’ Facebook ROAS calculation, we would need to divide the $5,000 in total revenue by $800 in ad spend to determine the return on ad spend. Multiply it by 100 to get the percent return. That comes to a total of 625% return on ad spend.
Example: ( $5,000 / $800 ) * 100% = 625% return on ad spend per month
Keep in mind that you can also start with the desired number of new customers and work the calculation in reverse. For example, calculate how many leads you need to get the desired number of new customers based on your conversion rate.
Next, multiply the number of leads needed by your industry’s average cost-per-click. This is the budget you should allocate to Facebook Ads to meet your goals for new business.
What Is a Good ROAS for Facebook Ads?
Before you spend money on Facebook Ads, first get an idea of what is a good ROAS for Facebook Ads. For example, Ingrately.com suggests that at a minimum, your return on ad spend should be at least twice your investment (200%). For every $1 you spend on Facebook Ads, your business generates $2 or more.
To help you assess your ROAS, use these as reference:
- ROAS of 0% to 99%: Your ad spend is higher than your revenue, meaning you aren’t getting any value from your ads.
- ROAS of 100% to 199%: Your revenue is only slightly higher than your ad spend. This means that you are not breaking even if you have additional costs for ad creation or management.
- ROAS of 200% to 299%: Your revenue is higher than your ad spend. This is the standard minimum ROAS, meaning that it is fair but can still be improved.
- ROAS of 300% to 699%: Your revenue is performing well above the ad spend. You are getting good value from your ads.
- ROAS of 700% and above: Your revenue is ideal for your ad spend. This means you are getting clicks and conversions above the industry average.
This could be different for your business, as what will be a good ROAS will tie directly to your revenue, operating costs, and profit margins. Nor does it factor in other costs, such as the salaries of employees managing Facebook Ads or outsourced Facebook ads management.
Facebook advertising costs should also account for costs associated with advertisement creation, such as professional copywriting, graphics and images needed, etc. For each of these additional cost factors, your ads will need to generate enough revenue to meet these expenses and produce the revenue return you are looking for.
Key Factors That Impact Return on Ad Spend
Factors that can affect the cost of Facebook ads other than price include things like click-through rates (CTR) and conversion rates (CR). Your CTR is a percentage representing the ratio of how many times your ad was shown compared to how many clicks it received, illustrating the quality of your ad. The conversion rate is the number of times users who clicked on your ad convert on your landing page, speaking to the quality of your landing page or offer.
For example, a business with Facebook ads that have a high CPC (cost-per-click) may still have a low CPA (cost per acquisition) if the average click-through and conversion rates are high. So while it may sound good to have a low CPC, this doesn’t necessarily equate to effective advertising if your Facebook ads cost is low, but you also have a very low conversion rate.
Success with Facebook Ads requires a deep understanding of which ad types work best, high-converting ad copy and creative assets, and knowledge of the platform’s algorithm. If this sounds like a lot to learn, you don’t have to go it alone. Instead, turn to the experts at LYFE Marketing, Straight North, or the best agency for your business from our list of the best Facebook advertising services.
How to Improve Your Return on Facebook Ads
With Facebook and any other kinds of paid social, your goal is to optimize your ads to get the most out of your marketing efforts. Although there are plenty of tips on how to make ad campaigns more successful, there is one proven way to optimize your ROAS: testing.
Here are four ways to improve ROAS for Facebook ads with testing and lookalike audiences:
Test Different Objectives
The campaign objectives are the backbone of any Facebook Ad campaign. Your campaign objective affects the ad unit options, bidding strategies, and optimization techniques. Don’t be afraid to mix up your campaign objectives to attain different goals throughout your campaign. Learn more about these objectives and the options that go along with them in our small business guide to Facebook Advertising.
Test Different Bidding Strategies
Facebook’s bidding algorithm progresses more smoothly if it starts with a low budget and scales over time. This gives small business owners and advertisers the opportunity to test different bid strategies with a low budget instead of simply opting for cost caps. Cost caps provide a sense of control to advertisers, but they often restrict results volume (which Facebook relies on).
By testing different bid strategies, you can find the optimal approach to boost your ROAS. Facebook outlines three types of bidding strategies you can play around with:
- Spend-based: Spend your full budget to get the possible value (e.g., promoting high-value purchases) or highest volume of results (ad delivery and conversions, such as generating web traffic, event sign-ups, coupon code redemption, and so on).
- Goal-based: Set bids based on the projected returns to stay profitable or hit a specific ROAS.
- Manual: Manual bidding is setting specific max bids across auctions. It’s only recommended for experienced advertisers who can project conversion rates to calculate their bids. Most advertisers are better off letting Facebook’s system control the process to get the best return.
Test Different Ad Creatives & Formats
Explore different ad types, creatives, and placements to find the ones that resonate with your audience the most. At the same time, you can also mix up your ads depending on purpose. For example, if video-format ads aren’t capturing your audience’s attention enough, try out a different design or a carousel format to highlight what your business can offer.
Extend Your Reach With Lookalike Audiences
Effective targeting is essential for successful Facebook advertising campaigns. Creating lookalike audiences allows you to reach people who share the same characteristics as your existing customers. Aside from identifying your key user base, it dissects commonalities to help you reach highly qualified prospects you might not have been able to target otherwise.
You can build a lookalike audience simply by selecting an existing audience and setting additional parameters such as audience size, age, location, gender, and other demographics. Remember that the source group should have at least 100 people based on your customers, site visitors, or page fans.
To test these strategies and explore ad opportunities, you first need to create a Facebook business page and proceed to the Ad Manager.
Frequently Asked Questions (FAQs)
Which is cheaper: Google Ads or Facebook Ads?
Costs-per-click tend to be lower for Facebook Ads vs Google Ads, but user intent is different on each platform, as are click-through and conversion rates. Facebook may be cheaper, but it’s more geared toward generally strengthening your brand presence. In contrast, Google search ads are directed at users actively looking to make a purchase, book an appointment, visit a local business, or take some other type of action.
What are the best ways to target Facebook ads?
Facebook offers several excellent targeting parameters, from life events to interests, job titles, household income, education, and even behaviors. Any advertiser can use these targeting options to create audiences that closely match their ideal customer types to reach their target market using social media advertising.
Where can I find a Facebook ad management service?
Opting for professional ad management is often the best choice, especially if you don’t have the time to master the Facebook ad platform. However, many management services are available, and it can be hard to pick the right one. We highly recommend Straight North or LYFE Marketing—both of which are our list of the best Facebook advertising services.
Bottom Line
Understanding how much Facebook Ads cost for your industry can help you determine whether you have the budget for advertising on Facebook and if you’re getting a good return on ad spend, or ROAS.
Looking to learn more about using Facebook to grow your business? Get ideas and inspiration from our list of Facebook marketing strategies for small businesses.