Statistics show that while brick-and-mortar purchases still make up a majority of consumer spending, online shopping is steadily on the rise. And, with new challenges brought about by inflation, struggles in supply chain, pricing, and more, a crop of new small businesses, direct-to-consumer retailers, and ecommerce startups are gaining popularity with shoppers.
We’ve gathered 75 online shopping statistics, along with their key takeaways, broken into 10 categories:
Online Shopping Stats: An Overview

1. Ecommerce sales are forecast to grow 10.5% in 2024
Ecommerce sales are settling back into their pre-pandemic tracks, with the growth of online sales estimated at 9.3% in 2023, amounting to $1.137 trillion. This is an 8.6% growth rate from 2022, when online sales reached $1.040 trillion. In 2024, while growth is still expected, it is not as high as from recent years, with an expected growth of 10.5%.
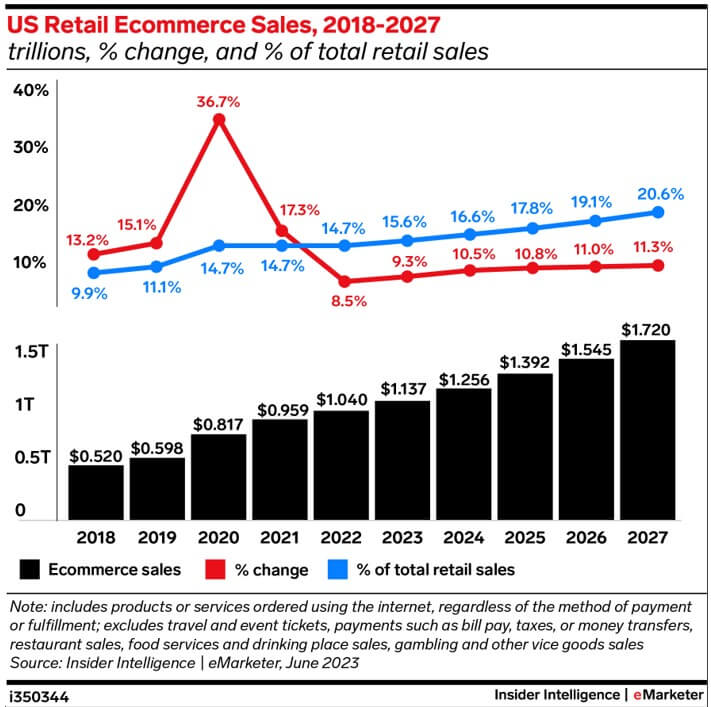
(Source: Insider Intelligence)
2. More than 268 million American consumers shop online
Research shows there were more than 268 million online shoppers in the United States in 2022—more than 80% of the entire US population. And forecasts show the figure will continuously increase between 2023 and 2028 by 24.25%. The most popular online shopping categories in the US are fashion and media and electronics.
3. More than 55% of US consumers prefer to shop online
A 2022 Raydiant study on US consumer behavior reports that 56.6% of survey respondents prefer to shop online rather than in person. That is an approximately 10% jump from 2020’s stats.
4. Most online shoppers are 25–34 years old
There were 41.8 million online shoppers aged 25 to 34 years in 2022, the largest group among digital buyers. Here’s the full breakdown:
- 41.8 million 25–34 years
- 36.5 million 35–44 years
- 35.1 million 65+ years
- 32.3 million 45–54 years
- 31.8 million 55–64 years
- 26.5 million 18–24 years
- 10.7 million 14–17 years
5. The average order value in the US is $109
According to Dynamic Yield, October 2023’s average order value (AOV) was $109 in the US. In October, traffic from mobile drove the largest portion of visitors to US online shopping sites, at 73%.
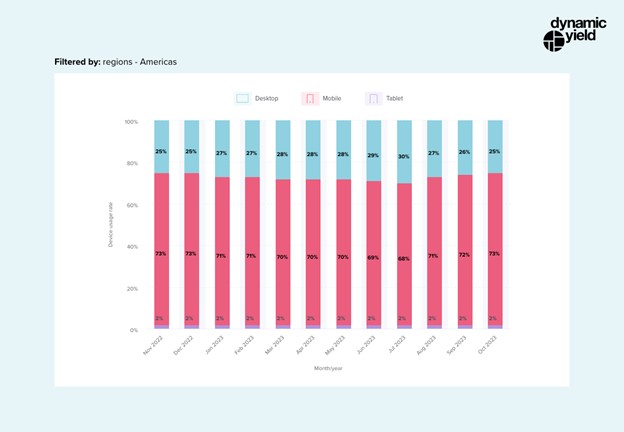
(Source: Dynamic Yield)
6. The global average conversion rate is 3.39%
Globally, the average conversion rate for ecommerce websites in October 2023 was 3.39%. In October, the Americas witnessed the strongest conversion rates overall (3.57%), followed by EMEA (3.06%), and then APAC (2.7%).
Key takeaways:
- It’s no longer enough to just be a brick-and-mortar retailer. You should consider adding an online store component to reach a larger customer base.
- Don’t worry, in-store shopping will not completely go away. Instead, it will evolve. Hybrid online/traditional shopping—or an omnichannel experience—will commence. Think click and collect, augmented reality, and artificial intelligence (AI) assistants.
- Your permanent retail store is still important. Focus on creating an in-store experience that’s synonymous with and builds on the online experience—acting as a fulfillment center for customers who buy online and pick up in-store.
- Millennials and Gen X-ers are the biggest online shoppers, so knowing their consumer behavior and shopping habits will greatly help you in marketing your products.
Trends of Online Shopping Small Businesses Need to Know
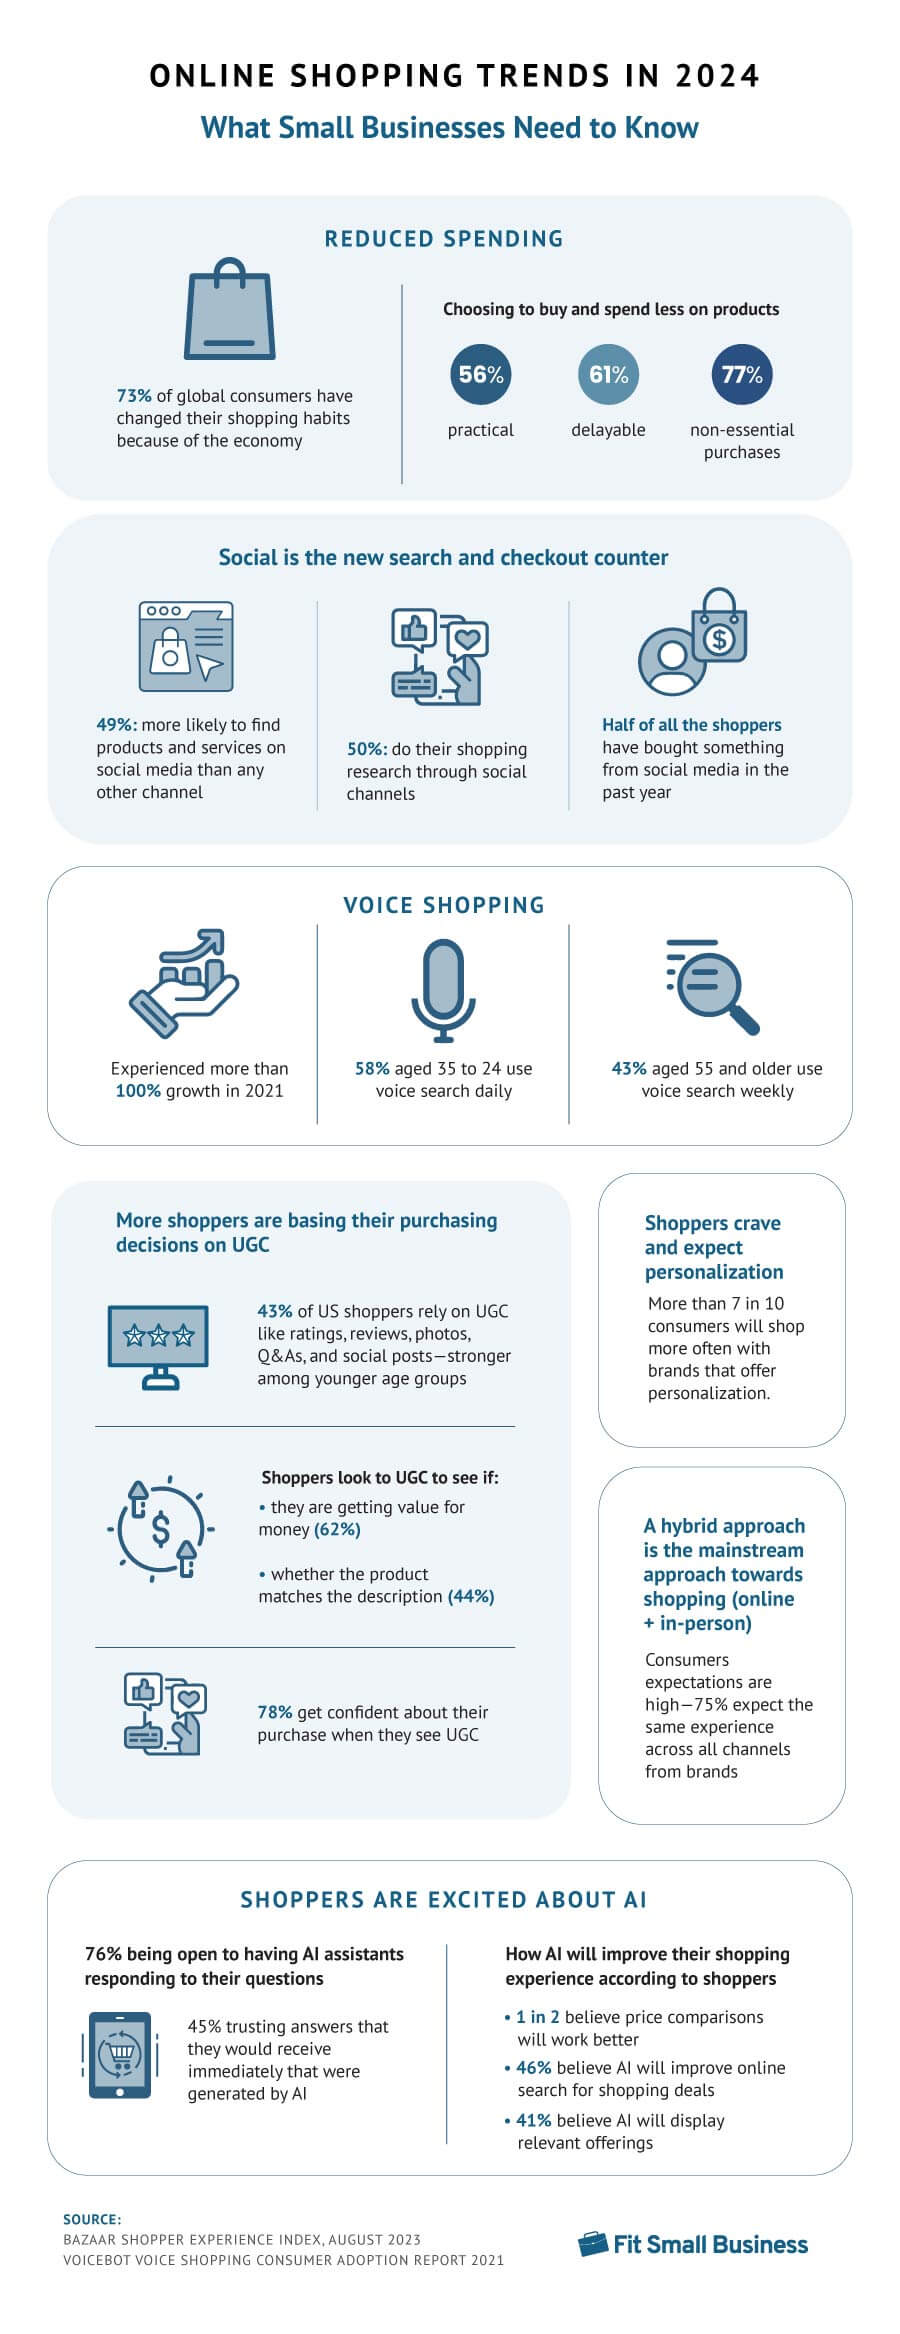
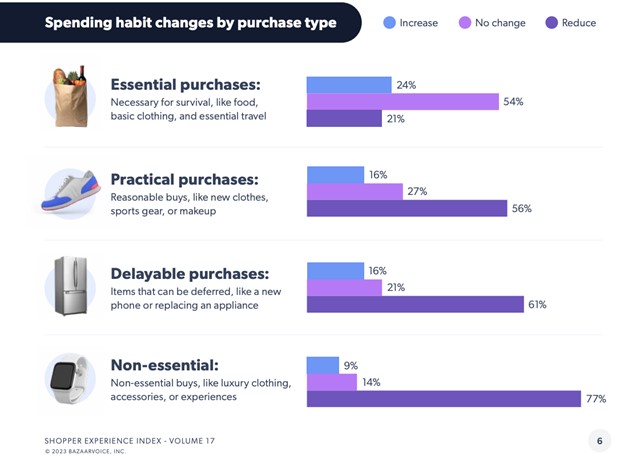
7. 73% of global consumers have changed their shopping habits because of the economy
One of the most noticeable trends of online shopping in the past year is reduced spending. The persistent inflation across the world has impacted how consumers spend according to the latest volume of the Shopper Experience Index (Bazaarvoice). They are choosing to buy and spend less on products, particularly for purchases that are practical (56%), delayable (61%), and nonessential (77%). When it comes to essential products, however, 54% have unchanged spending habits, while 21% are on reduced spending.
This trend holds stable across all demographics, although the study shows men are less likely than women to have changed their spending habits (69% vs 77%), while 66% of consumers aged 65 and above have altered their spending, compared to 78% in the 35 to 44 age group. These figures could be attributed to women being the budget keepers of households and the older population having stricter budgeting practices because of fixed incomes.
(Source: Bazaarvoice)
8. Social is the new search and checkout counter
Social is the cause of the divide from the usual online shopping trends—nearly half (49%) of shoppers agree they’re more likely to find products and services on social media than any other channel, a whopping 50% do their shopping research through social channels, and half of all the shoppers have bought something from social media in the past year.
9. Voice shopping experienced more than 100% growth in 2021
According to Voicebot’s Voice Shopping Consumer Adoption Report 2021, over 45 million US consumers used voice technology for their shopping experience in 2021, from just a little over 20 million in 2018—constituting 120% growth.
Among age groups, more than half (58%) of consumers aged 35 to 24 use voice search daily, and 43% of consumers 55 and older use voice search weekly.
Related: What Is Voice Commerce? Insights for Independent Retailers
10. Shoppers crave and expect personalization
According to Marigold’s The Consumer Trends Index 2023, consumers remain frustrated by the subpar attempts at personalized messages they receive from brands, with half of consumers feeling annoyed by irrelevant content or offers (49%) or being frustrated by messages that don’t reflect their wants and needs (42%).
Around a third are irked by messages that don’t recognize their shopping or loyalty card history (32%) or by messages based on information that they hadn’t shared directly with the brand (35%).
However, over three-quarters of consumers (77%) receive about the right amount or would like more messaging about personalized treats—a 7% increase since 2022.
And while 71% of brands think they’re winning on this front, just over a third of shoppers agree. There’s plenty of opportunity here—36% of shoppers feel “positive” about sharing more data with businesses if it means they’ll get a personalized experience. Plus, it’s good news for retailers. More than seven in 10 consumers will shop more often with brands that offer personalization.
Related: Personalization in Retail: Ultimate Small Business Guide
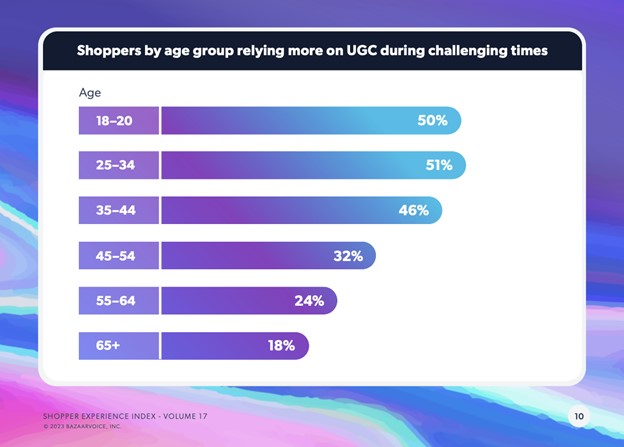
11. More shoppers are basing their purchasing decisions on user-generated content
Nearly half (43%) of US shoppers rely on UGC like ratings, reviews, photos, Q&As, and social posts, with the trend being particularly strong among younger age groups. Shoppers look to UGC to see if they are getting value for money (62%) and whether the product matches the description (44%). Seventy-eight percent of them gain confidence about their purchase when they see UGC.
But branded content still plays an important role in the purchase process. A majority of shoppers still want to see both branded photos (83%) and shopper photos (76%) to make a confident purchase. It’s a similar trend with videos—73% of shoppers need to see branded videos on product pages, and 69% need to see shopper videos on those pages to make a confident purchase.
(Source: Bazaarvoice)
12. Consumers believe AI will improve their online shopping experience
Artificial intelligence has disrupted almost every industry, and shopping online is no exception. Consumers are looking forward to using it and are even excited about AI in online shopping—a recent Statista survey (May 2023) shows that one in two respondents believed price comparisons will work better, while 46% mentioned online search for shopping deals, and 41% believed AI will display relevant offerings.
Shoppers are also open to AI assistants, with 76% being open to having AI assistants responding to their questions and 45% trusting answers that they would receive immediately that were generated by AI (36% still said they would trust answers depending on the answer).
Related: AI in Ecommerce: 2023 Small Business Guide
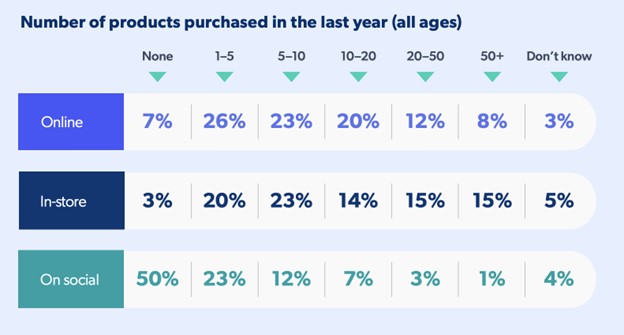
13. A hybrid online and in-person shopping approach is becoming the mainstream approach
Shoppers, especially the younger generation, are taking a hybrid approach when discovering, evaluating, and buying products. They can do their initial research in-store and buy online, or search online and buy products in-person.
Across age groups in the past year, 93% have purchased something online, 97% have purchased in-store, and half (50%) have bought something on social media. And consumers’ expectations are high—75% expect the same experience across all channels from brands.
(Source: Bazaarvoice)
Key takeaways:
- Add in more discount deals, cross-sales, bundles, or budget-priced products to meet consumers’ shifting needs.
- Go where your shoppers are—these days, it’s on social media.
- Implement voice search strategies such as a strong SEO strategy, product features, and review videos.
- Personalize, personalize, personalize! Leverage your ecommerce platform features, such as product recommendations, offers, and discounts.
- Learn how to generate UGC for ecommerce and explore how to use UGC for marketing together with some UGC marketing ideas for small businesses.
- Keep an open mind about AI. You don’t have too much of an upfront spend on it, even, as ecommerce platforms like Shopify have included useful AI tools for their subscribers for free. Take a look at Shopify’s free AI tools and its latest AI tool called Shopify Magic to grasp what it can do for your online business.
- Consider doing an in-store pickup if you have a brick and mortar store, partner with a store to have a kiosk for pickups or do a consignment arrangement, or do regular event pop-ups.
- It’s important to keep up with ecommerce trends to help you strategize for your online store better.
Online Shopping Consumer Behavior
14. 70% of consumers are open to trying a different brand for products they regularly buy
A study by Bazaarvoice noted that more consumers are trying a different brand for products they regularly buy, which is a great opportunity to attract and retain new customers. In fact, 60% of shoppers have purchased from private labels in the past year.
15. 76% of online shoppers shop for convenience
Customers prioritize convenience in the shopping experience—which includes discovering, searching, purchasing, and more.
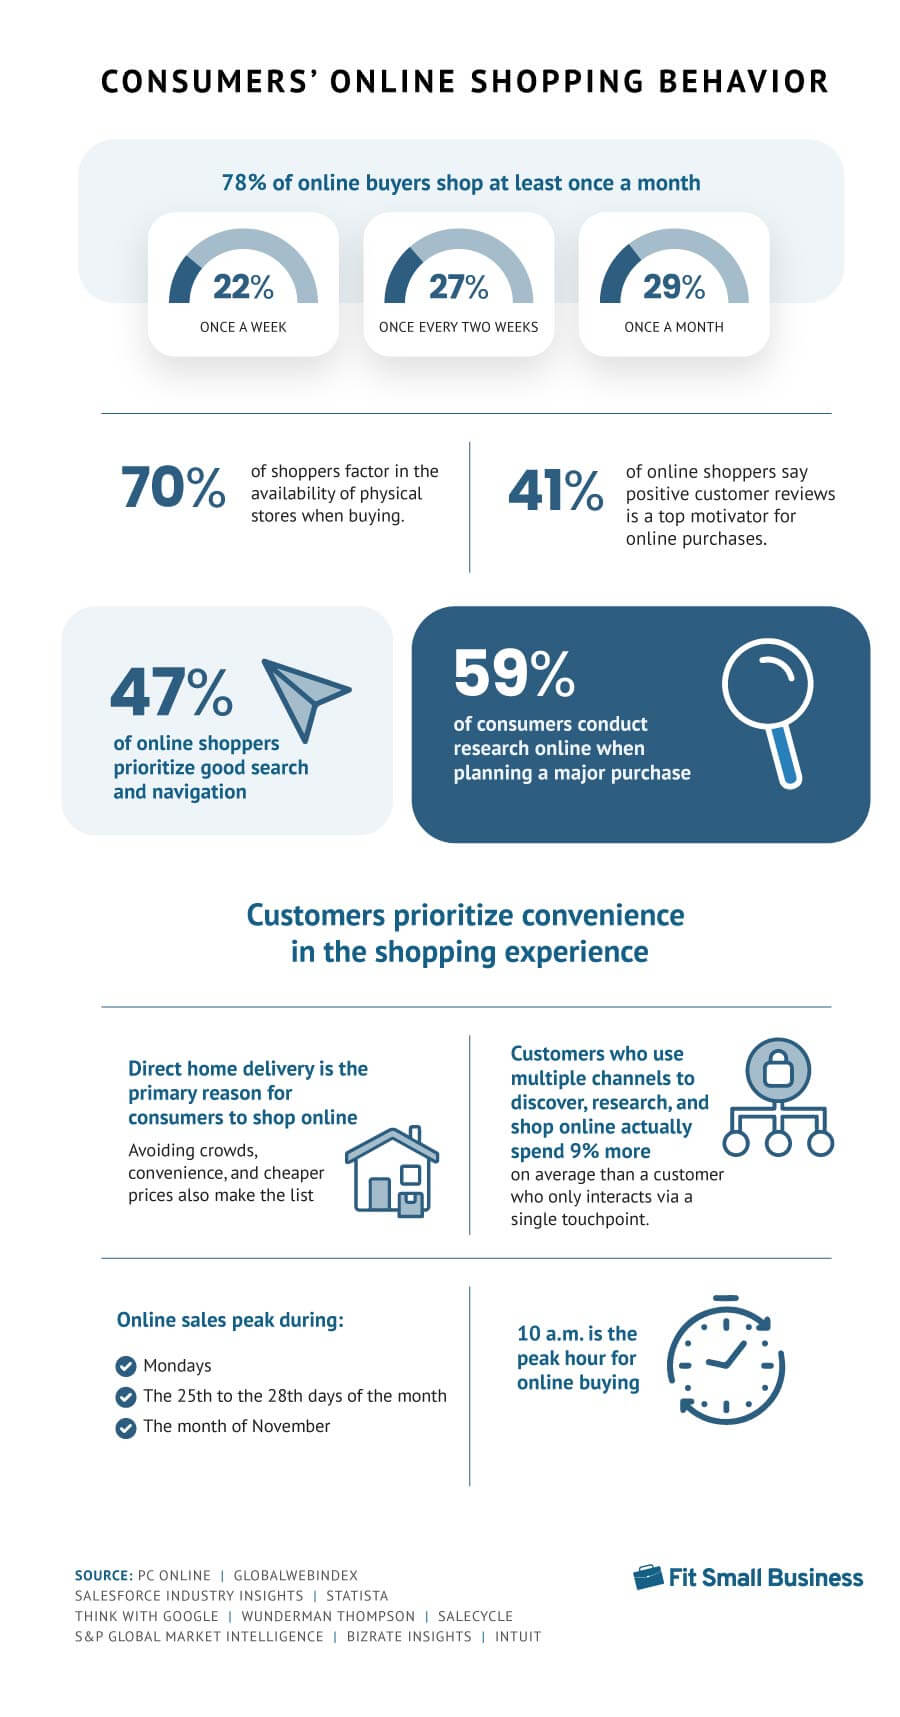
16. Direct home delivery is the primary reason for consumers to shop online
A hassle-free shopping experience is the primary reason consumers buy online, with 56% citing direct home delivery as a good reason to buy an item online. Avoiding crowds, convenience, and cheaper prices also make the list.
17. Nearly 80% of online buyers shop at least once a month
A survey shows that online shopping happens frequently for global consumers—with 22% shopping online once a week, 27% shopping once every two weeks, and 29% shopping once a month.
18. Online sales peak on Mondays, during the 25th–28th days of the month, and in November
According to the 2023 Ecommerce Stats and Trends Report, online sales events like Black Friday and Cyber Monday have a big impact, making November a clear standout when it comes to online sales.
Additionally, online sales volumes significantly increase between the 25th and 28th of the month, mostly owing to payday. Monday has overtaken Thursday as the biggest online sales day; Saturday remains the day with the lowest amount of online sales.
When it comes to time, 10 a.m. is the peak hour for online buying, slightly earlier than over the last two years.
19. More than half of consumers research major purchases online
A consumer’s buying journey begins online, with 59% doing web research when planning a major purchase to ensure they are making the best possible choice.
20. Customer reviews is the top motivator for online purchases
According to GWI’s 2022 flagship report on the latest trends in commerce, 41% of online shoppers said positive customer reviews is the top motivator for online purchases. A notable 37% also cited a quick and easy checkout process, and 35% mentioned next-day delivery.
21. About 70% of shoppers consider the ability to shop in-store when deciding on purchases
In-store shopping is still important. However, customers look for a seamless online-to-in-store buying experience. For example, some 70% of shoppers factor in the availability of physical stores when buying.
In fact, 74% of in-store buyers said that they searched online for something related to the physical store first—such as the closest store near them, locations, hours, directions, wait times, and contact information—with 46% confirming inventory online before going to the store.
22. Nearly 50% of shoppers prioritize good search and navigation features
Forty-five percent of US shoppers cite making products easy to find as an important factor of the online shopping experience. Clear product descriptions and images were second in priority (39%), reinforcing the need for writing informative and high-quality product descriptions and taking great product photos.
23. Younger consumers prefer BNPL for money management and flexible payment options
According to a PYMNTS 2022 study, 54% percent of Gen Z consumers, 57% of bridge millennials, and 60% of millennials said they would be interested in buy now and pay later (BNPL) from their banks. This is primarily because of money management issues (living paycheck to paycheck) and the preference for having a bank-issued card with mobile payment and online usage options.
24. 40% of shoppers are more likely to convert when an ad features user-generated content (UGC)
UGC is a convincing content format—four in 10 online shoppers say they would be more likely to convert if a product ad features some sort of UGC. UGC could include customer reviews, customer photos, and even social posts. Images are most important—nearly three-quarters of shoppers say images will make them more likely to buy. And 53% say social media posts featuring images are more convincing than professionally shot product photos.
In fact, as many as 42% of online shoppers would purchase a product even if it had no professional photos, as long as there was some form of UGC.
Key takeaways:
- A seamless buyer’s journey, social proof (reviews), and good website navigation make a great online store. Read our tips on how to grow your ecommerce business.
- Learn how to offer customer financing and BNPL options to your customers.
- Starting a blog on your site is one of our recommended ecommerce marketing strategies.
- Use peak sales data to optimize your product launches and sale announcements.
- UGC is a content goldmine! Seventy percent of shoppers are happy to share their social content when asked. So ask away! But remember: shoppers expect engagement when posting reviews. Responding to UGC-like reviews and tagged content is a great opportunity to create a great customer service experience and retain old and new customers.
Online Shopping Technologies

25. Mobile buyers make up 65% of the population
Mobile commerce (mcommerce) continues to grow. In 2022, there are about 182.5 million mobile buyers aged 14 years and above—65.2% of the population. This number is forecast to grow to 199.5 million in 2026, just shy of 70% of the population.
26. Mobile commerce is expected to account for 40% of US ecommerce sales by 2024
Mcommerce revenue surpassed $400 billion in 2022. Forecasts show that by 2024, mcommerce sales should reach $534.18 billion, accounting for 40.4% of ecommerce sales in the US. This year, mcommerce sales are expected to account for 43.4% of total retail ecommerce sales, an increase from 41.8% in 2022.
27. The average order value for mobile purchases is $106
While many shoppers are turning to mobile shopping, they’re still placing larger orders when they shop on traditional devices like desktop computers. In fact, in October 2023, the average value of an order placed on a desktop was 20% higher than the average mobile phone order ($127 vs $106).
28. Shoppers tend to browse on mobile, with almost 75% of online traffic coming from mobile devices
Mobile traffic is higher than desktop traffic when it comes to online or window shopping (74.79% vs 25.21%). When it comes to online sales though, it is a close tie, with mobile making up 49% of online sales compared to desktop’s 51%.
Shoppers tend to change their device—from their phones to their tablets or laptops, etc.—multiple times throughout the day. Online shopping, social media scrolling, and Google searches result in device switching—it is clear that a seamless shopping experience should be considered across these areas.
29. Nine out of 10 shoppers believe the mobile shopping experience can be improved
It is no longer enough that websites are accessible from mobile devices—it takes more than that to succeed at mcommerce. Some 90% of consumers believe mobile shopping can be improved, with only 12% of consumers, for example, finding mcommerce convenient.
Some of the impediments to mobile shopping are security concerns (42%), pages and links being too small to click (67%), interruptions from messages, apps, and other programs (36%), and difficulty finding what shoppers are looking for (36%).
30. Digital wallet payments are now more popular than credit card payments
According to the most recent Global Payment (GPR) report, digital payment methods have surpassed credit card usage in both online and in-person sales. Forty-nine percent of transactions in 2022 account for digital payments compared to 20% of credit card payments.
Related:
- 13 Payment Trends Shaping the Future of Retail & Ecommerce
- 40+ Payment Statistics for Small Businesses (2023 Edition)
31. Gamification boosts engagement and encourages spending
The retail industry was an early adopter of “gamified” solutions, jumping out to a 28.6% share of the market, which is expected to grow 25.1% per year through 2026. Since online shopping can lack the interactive experience of in-store shopping, gamification amps up the hype by encouraging customer behavior (such as spending more) in exchange for additional benefits.
For example, customer acquisition can grow as much as 700% with gamification. Walgreens employed gamification tactics and reported an increase in engagement and loyalty by 30%.
Examples of gamification methods include promotional contests, spin-to-win opportunities, and tiered VIP loyalty programs.
Related: What Is Gamification in Retail & How to Use It
32. Only 21% of brands are currently using AI tools
Even with all the excitement around AI, retailer adoption remains low, with just 21% of brands and retailers using AI tools according to a study conducted by Bazaar in August 2023.
And,only half (51%) plan to adapt AI tools in the near future. Concerns about inaccurate recommendations (51%), misinformation (45%), and data privacy breaches (40%) plague AI adoption in ecommerce.
33. Virtual and augmented reality lead to a 94% higher conversion rate when it comes to shopping
A Harvard Business Review article in 2020 says products that have AR experiences have a 94% higher conversion rate as shoppers can assess the product better and make them feel connected with the brand.
Related: Virtual Reality (VR) in Retail: 2023 Guide With Examples
34. More than half of shoppers have purchased from an email
Over half of consumers (52%) have made a purchase directly from an email they received in the last year, a 4% increase from 2022. Email outperforms other avenues of purchase invitations too. Email outperforms banner ads and SMS by 108%, organic social media posts by 13%, and social media ads by 11%.
Key takeaways:
- When you think of mobile when it comes to your online store, treat it as a collection of highly accessible touchpoints—SMS, MMS, mobile wallet, email, web, or mobile app. These touchpoints need to make your brand much more accessible to the consumer.
- Your desktop and mobile sites are equally important. Using an ecommerce platform like BigCommerce or Shopify makes it easy to create a responsive, mobile-optimized experience for all online shoppers.
- Eliminate distractions in your product images and make sure they stand out and are clear to see, even on small devices. Learn how to take high-quality product photos.
- Try to be detailed but concise when writing descriptions for your products. Learn to write product descriptions that sell.
- Enabling your customers to use digital wallets encourages them to spend because of its ease of use and increased security (remember, security concerns account for 42% of mobile shopping impediments).
- Leverage technology to enhance the ecommerce journey. Visual search makes it easy for shoppers to find your product, and AR/VR technology allows them to have a deeper product experience—one of the things lacking when it comes to ecommerce. You can also create a virtual tour of your store to entice shoppers to visit.
Social Shopping

35. US social commerce sales are expected to reach $79.64 billion by 2025
An eMarketer report estimated that more than half of the adults in the US would make a purchase via social media in 2022, pushing social commerce sales to $45.74 billion. Among those who haven’t made a purchase, 44% prefer to deal directly with a retailer, and 43% don’t trust social platforms with their payment information. Social commerce sales are expected to grow significantly over the next few years, nearing $80 billion by 2025.
36. Digital adoption has contributed to the rise of social commerce
The average time spent daily with digital media has increased to 8.1 hours in 2021 from 6.8 hours in 2019, with more than a 60% increase in the average time on social media in the past decade. Social commerce is a huge opportunity for retailers, with six in 10 expecting consumers to purchase products directly on social media platforms in 2023. This can even increase because, in 2022, 60% of Gen Z and 56% of millennials planned to use social media in their holiday shopping activities.
37. Facebook is the leading social platform for online purchases
An April 2021 survey revealed that 51% of respondents purchased from Facebook often, with over 47% of social media users aged 16 to 34 saying they had purchased products or services on Instagram.
38. Seven out of 10 shoppers are influenced by friends’ social media posts and reviews
Social commerce is mostly driven by influencer marketing, mainly banking on user-generated content. UGC has been proven to be more effective in brand advertising, as 71% of US consumers said that posts from friends or acquaintances on social media were influential in their purchasing decisions.
39. Purchases via social media are becoming more common
Younger generations are already making online purchases via social media, and it looks like this trend is here to stay. According to an eMarketer study, the number of social buyers in the US is expected to rise from 60.6 million in 2019 to 108 million in 2025—a more than 75% increase over just a few years.
40. Around 2 in 5 younger shoppers make regular impulse purchases, mainly owing to social media
Discovery-led ecommerce—social media scrolling and the ability to buy directly from these platforms—has increased, with 41% of Gen Z and millennials making an impulse purchase online every two to three weeks, rising to 48% among daily TikTok users.
The leading motivation for impulse buys remains the same throughout age groups, though. All of them are tempted to make unplanned purchases to take advantage of sales/deals (Gen Z 43%, millennials 46%, Gen X 52%, and Baby Boomers 58%.
Note, though, that easy or quick online checkout processes (34%) and social media “buy” buttons (21%) are common reasons Gen Z and millennials give for impulse buying. Meanwhile, among older consumers, many do add last-minute surprises to their cart just because they fancy a treat.
41. Social shoppers care about social proof and easy checkout
Social shoppers have similar preferences to online shoppers. Of their biggest motivators to make a purchase, 50% say customer reviews are most important. Other motivators include:
- 48% quick and easy checkout process
- 44% next-day delivery
- 40% likes and positive comments on social posts
- 35% environmental-friendliness of the brand
- 31% ability to pay cash on delivery
- 31% ability to use a payment plan
And according to Bazaarvoice, as many as 54% of consumers say they’d be more likely to buy a product via social commerce if they could get all the product information immediately after clicking on the post.
Key takeaways:
- Sell on social!
- Facebook and Instagram are the most popular social media platforms consumers use for purchasing online. Reach these shoppers by setting up a Facebook Shop and using it to create a shoppable Instagram page. These platforms also provide many tools for listing products and creating ads to help drive more sales.
- TikTok is another social platform that you should consider having a brand presence on. Aside from selling on Tiktok, focus your marketing efforts on the social platform by utilizing influencers and brand ambassadors.
- Sell on Pinterest or use Pinterest to market your retail business. Shopping is a visual experience and Pinterest fits the bill perfectly.
- Livestream shopping is a rising social shopping trend, with YouTube being the most popular live commerce platform in the US. Learn how to sell on YouTube.
- Mix your social content with engagement and promotional posts. You don’t want your audience to feel overwhelmed with too much marketing and advertising.
- Read our guides on social media marketing and how to collaborate with influencers.
- Consider buy now, pay later (BNPL) options like Aftepay to capture more social (and online) sales.
Importance of Shipping

42. US shoppers spent more than $95 billion via BOPIS in 2022
US shoppers spent $95.9 billion through click-and-collect fulfillment options in 2022 such as buy now, pick up in store (BOPIS) and curbside pickups—totaling 9% of all ecommerce sales. It is expected that the BOPIS market will exceed $150 billion by 2025.
Because BOPIS and click and collect are such big trends, many POS systems now come with those order fulfillment capabilities built-in, plus additional omnichannel sales tools.
Related: Buy Online, Pick Up In-store (BOPIS) Statistics for Businesses in 2023
43. Free shipping is important to online shoppers
According to Shippo’s 2023 State of Shipping report, the percentage of online shoppers who refuse to compromise on free shipping is up year-over-year, with 62% saying they won’t purchase with a retailer if free shipping isn’t offered, and just 3% saying shipping costs don’t matter at all to them.
Related: Ecommerce Shipping & Handling Guide [+ Free Checklists]
44. Nearly 50% of online shoppers will spend a minimum purchase amount to get free shipping
Consumers want free shipping, but fewer merchants are offering free shipping compared to last year (19% vs 22%). However, there is wiggle room for retailers to cater to consumer’s wants. Shippo’s State of Shipping report findings reveal that to get free shipping:
- 47% will spend a minimum amount on the purchase
- 42% will join a loyalty or membership program
- 30% will wait to purchase the item during a promotion
45. Delivery speed was less important to consumers in 2022
From the same report, only 10% of online shoppers wanted same or next-day delivery in 2022, down from 18% in 2021. Similarly, only 44% prefer or expect a two to three day delivery timeframe window, compared to last year’s 52%.
46. Reliability remains essential compared to timely delivery for consumers
While timeliness of receiving packages was less of an issue in 2022, reliability remains essential. Nineteen percent of online shoppers aren’t likely to make a second purchase with a retailer that lost their package, and 42% say how the merchant resolves the issue determines whether or not they’d be a returning customer.
47. Customers expect to see shipping costs upfront on a retailer’s website
Shipping cost, average shipping time, when the item will ship, and expected delivery date are information most important for shoppers in order of priority.
There is a discrepancy here because even though 73% of merchants surveyed by Shippo are providing information about the cost of shipping upfront, less than half are letting potential customers know the average shipping time, expected delivery date, and item ship date on their product or checkout pages. Here is the breakdown:
- 49% Average shipping time
- 33% Expected delivery date
- 33% Item ship date
48. 45% of consumers want a retailer to let them know when an order is delivered
Consumers also want to be notified of a package’s journey all the way through to delivery, with 39% of customers tracking their packages once a day:
- 68% want a retailer to communicate with them when a purchase has shipped
- 66% want an order purchase confirmation
- 59% want to receive shipping updates
- 45% want a retailer to communicate with them upon delivery
49. Nearly half of online shoppers care most about free shipping on returns
Free shipping is the most important consideration when it comes to returning a purchase for 45% of US online shoppers. In contrast, 24% of shoppers care most about the ease of processing a return. Studies show that 84% of shoppers check a merchant’s return policy before making a purchase, and 91% will buy from the brand again if it’s easy to make a return.
50. Up to 69% of shoppers would abandon their carts if shipping costs are too high
Fast and free is the name of the game when it comes to shipping and fulfillment. As many as 69% of shoppers will even abandon their shopping cart completely if shipping costs are too high. In response, two-thirds of retailers offer next-day delivery—compared to just 48% in 2020.
51. 44% of retailers have diversified their fulfillment network
The COVID-19 pandemic and other global events have wreaked havoc on supply chains and shipping workflows. As a result, delays are the norm.
To mitigate these challenges, 69% of retailers have implemented strategies to be more transparent about shipping with their customers. This includes better communication about delivery promises and more visibility into shipping status and order tracking. Additionally, 44% of retailers have diversified fulfillment network locations to allow for more optimizations.
Key takeaways:
- Free shipping is one of the leading drivers of online sales. Learn how to offer free shipping on your products.
- Adopt new processes like curbside pickup, local delivery, or click and collect to encourage more sales.
- Shop around with different carriers to find the most cost-effective option.
- Encourage customers to shop by having a clearly communicated return policy that includes free shipping. Display it on your website footer, product pages, and FAQs section.
- Offer pre- and post-purchase peace of mind with order tracking and insurance. Keep buyers in the loop with tracking updates at every step of the way, from purchase to delivery.
Online Shopping Reverse Logistics (Returns)

52. One-fourth of shoppers care about how easy it is to make returns
While 45% of consumers said free return shipping is most important to them when purchasing an item online, roughly one-fourth said it’s the ease of processing a return.
53. The average retail return rate is less than 16.5%
According to the National Retail Federation (NRF), the average return rate in retail remained flat at 16.5% in 2022, from 16.6% in 2021. According to the NRF survey, for every $1 billion in sales, the average retailer incurs $165 million in merchandise returns, and for every $100 in returned merchandise accepted, retailers lose $10.40 to return fraud.
54. 71% of retailers offer in-store returns for online purchases
More retailers are embracing omnichannel strategies, and this includes reverse logistics. More than seven in 10 retailers allow online customers to make returns at their physical retail locations—even though the purchase was made online.
55. 80% of consumers who return a product to a store spend their refund in the store
While returns are certainly a hassle for retailers, it doesn’t always lead to lost sales. When a shopper returns a product in your physical store, 80% of the time they’ll spend the money they get back on other products from the store. In some cases, these shoppers spend as much as 10 times more than shoppers who only engage via online channels.
56. Retailers lose $816 billion to returns every year
Returns management is costly. Total returns lead to $816 billion in lost sales for retailers in the US. For every $1 billion in sales, there are $165 million in returns.
57. Return fraud costs $10.40 per $100 of returned merchandise
Return fraud is becoming increasingly prevalent. For every $100 of returned products, retailers lose $10.40 to return fraud. In fact, many retailers are becoming skeptical of returns, even when a receipt is presented. As many as 14% of retailers expect fraud with returns.
Key takeaways:
- Craft a well-written and clear retail return policy. This will not only set the expectation for customers but also empower yourself and your staff by having a public and documented set of guidelines.
- Implement some loss prevention strategies to mitigate return fraud. You’ll also want to keep an eye on chargebacks.
- Make it easy for customers to make an exchange instead of request a refund. This can capture some of the potential lost revenue.
- Learn more about ecommerce return rates and return management strategies.
Online Shopping on Amazon & Third-party Marketplaces

58. Marketplace ecommerce sales were forecast to hit $357 billion in 2022
Even though marketplace sales are on a slight decline in the US, they’re still representative of a sizable chunk of ecommerce sales. In fact, marketplace sales in the US were predicted to hit $357.26 billion in 2022—or 34.6% of total online sales.
59. Amazon is the most visited online retail website in the world
Amazon registers 2 billion monthly visits in the US alone. This figure is thrice the monthly visits of eBay—at second place with close to 700 million monthly visits.
60. Shoppers are more likely to buy from Amazon than elsewhere
Not only do about half of consumers visit Amazon at least once a week but they are also extremely loyal to the platform. More than half of US shoppers start their purchase journey on Amazon as well, with 63% of them doing product searches on the platform first before doing so on search engines.
61. Most internet users shop on Amazon because it offers everything they need
Consumers report a number of reasons for shopping at Amazon when making online purchases. The biggest reason US consumers shop at Amazon is that it offers everything they need (66%), followed closely by receiving free shipping because of Prime membership (56%).
Key takeaways:
- Though Amazon may not be a core part of your strategy, it’s a helpful tool to drive online sales and build brand/product awareness. Amazon already has brand recognition and trust, so shoppers unfamiliar with your brand are more likely to trust a purchase through Amazon than directly from you.
- Consider selling a select few products on Amazon and keeping the rest exclusive to your store and website. Include extra benefits for shopping directly, like referral codes, customer rewards, and discounts.
- Read our article on Amazon statistics that sellers need to know.
Holiday Online Shopping & Seasonal Spikes

62. Back-to-school sales were nearly $67.5 billion in 2022
Back-to-school (BTS) season is still a big sales period for retailers. Total BTS sales in 2021 were $67.01 billion, which grew slightly (0.7%) to $67.46 billion in 2022. Online BTS sales alone accounted for $28.19 billion.
Related: Back-to-school Marketing Tips for Retailers
63. 2021 brought the first $200+ billion US holiday season—followed by the second in 2022
After hitting $205 billion in 2021 (up 8.6%), online holiday spending set another record in 2022, growing 3.5% to nearly $212 billion. The retail sector reported more than $3 billion in revenue for 38 days in both 2021 and 2022, compared to 25 days in 2020.
Here are some more key findings from the Adobe Digital Insights 2022 Holiday Shopping Results report:
- Discounts were at record highs for the 2022 holiday season, with toys and electronics leading the way.
- Products and categories that produced nearly 100% or higher of their preseason sales were toys (206%), video games (115%), and apparel/accessories (94%).
- BNPL services’ popularity reached new heights with more consumers taking advantage of deferred payments—orders were up 4% from 2021.
64. 2022 ecommerce holiday sales increased 3.5% from the previous year
Ecommerce holiday sales in 2022 had a 3.5% year-over-year increase with $211.7 billion in online sales in November and December. That was substantially slower growth than the more than 17% average year-over-year increase from 2018 to 2021. Still, this is the biggest online holiday sales season to date.
65. Cyber 5 remains the peak of the holiday season
Cyber 5—the five-day stretch from Thanksgiving to Cyber Monday—remains the busiest period of the season. US online sales over the Thanksgiving weekend increased 4% in 2022, reaching $35.27 billion in online sales, compared to 2021’s online sales of $33.90 billion.
It’s also worth noting that consumers are starting their holiday shopping earlier than ever. According to Bankrate, 25% of shoppers were planning to begin by September and another 25% were planning to start in October. Thirty-eight percent of shoppers planned to wait until November, while a mere 12% said they would wait until the last month of the year.
Learn more about results from the 2022 Black Friday Cyber Monday weekend.
66. Cyber Monday is still the biggest online shopping day
Cyber Monday claimed the top spot among all Cyber 5 shopping days for online revenue and is the biggest online shopping day of the year to date, hitting $11.3 billion in sales.
67. 40% of holiday shoppers in the US considered shopping earlier for 2022
Consumers received an all-time high of 6 billion out-of-stock notifications in 2021, and in 2022, they were 15% more likely to encounter them. Stock issues have been in consumers’ minds, and over 50% of shoppers had planned to shop earlier to avoid out-of-stock items.
68. 47% of online retail sales for the entire holiday season were done from smartphones
Consumers continue to show increased reliance on smartphones for shopping. Data shows that in 2022, 47% of November and December holiday sales—$99.3 billion—came from smartphones.
Key takeaways:
- Start early. Create a holiday retail gift guide and disseminate it to your customers via email, brochures, and direct mail.
- Capitalize on the holiday sale season. Think of creative ideas for promos.
- Plan ahead, and use our recommended strategies and sales tips for Black Friday and Cyber Monday.
- Offer customer financing with BNPL merchant apps.
- Improve your mobile shopping experience.
- Stay focused on Cyber 5 weekend—ensure your website is ready to handle the traffic surge and your support hotline able to take in inquiries and customer requests.
- Manage logistics. Provide multiple fulfillment options including curbside pickup and BOPIS.
- Learn more about Black Friday statistics and Cyber Monday statistics to prepare for the holiday season.
Inflation’s Impact on Online Shopping in the US

69. Ecommerce categories such as beauty and apparel are experiencing double-digit price increases
In the past decade, online shopping remained mostly immune to price upswings because it did not rely on the usual overhead costs that brick-and-mortar stores have. However, since inflation rose in the US to nearly 8.5% in March 2022 (a 40-year high), top ecommerce categories such as beauty and apparel are registering double-digit price surges in the US.
70. Food and beverages is where shoppers struggle the most price-wise
Rising grocery prices affect the wallets of six in 10 online shoppers in the US. Consumers also worry about “shrinkflation,” a strategy that may be used to counteract price increases by shrinking package sizes. This is commonly encountered when shopping for edible products such as snacks, pantry items, and frozen food.
71. Recommerce is on the rise because of inflation
Ninety-three percent of US consumers have resorted to “recommerce” (buying used goods) to avoid the impact of inflation in the last 12 months. More than half of respondents also intended to shop secondhand more frequently in the future.
72. One in five US online shoppers take advantage of Prime Day to stock up on items that have increased prices due to inflation
Almost one in five online shoppers use Amazon Prime Day deals to stock up on items that got more expensive because of inflation in 2022. Over one-third of the surveyed US consumers even waited for Amazon Prime Day to purchase a product at a lower price.
73. Inflation has disrupted brand loyalty and purchase considerations
According to Morning Consult’s latest The State of Retail & E-Commerce report (H1 2023), inflation has had a dramatic effect on consumer’s buying habits.
- 63% of US adults are shopping at discount stores to save money, slightly down from 70% in the fall of 2022, but still a significant share.
- 72% of US shoppers are looking for deals and coupons, subsequently taking them away from their preferred stores.
- 70% are shopping less overall.
74. Off-price retailers are ticking upward in the US
GWI reports that “luxury for less” retailers are increasing sales, with purchases from retailers like Marshalls and T.J.Maxx up 13% and 12%, respectively, since mid-2021. This matches Google’s own research where searches for “cheap holidays” and “designer outlet” surged in July 2022.
75. Clothing is the top choice for consumers to treat themselves during inflation
While there is a shift on buying priorities from treats to essentials, clothing, food delivery, and electronic items are the top three product categories consumers are more likely to spend on as a treat to themselves if they are on a budget.
Key takeaways:
While there is no one answer for online merchants, here are some ways you can still make a profit despite the rising cost of operations.
- Order in bulk to keep a safety stock.
- Look for domestic suppliers. It may be worth looking into domestic partnerships because of increasing prices and issues at major seaports in the US, rising costs of labor in the countries of origin, and increasing transportation fees because of fuel costs.
Online Shopping Statistics FAQs
Click through the questions below to get answers to some frequently asked online shopping statistics questions.
Online sales grew 10.6% in 2022 from the previous year according to the analytics firm Comscore as reported by Forbes.
There were more than 2.14 billion online shoppers in the world in 2021. Assuming each buyer makes one purchase per year, 5.86 million people would shop online per day.
According to the IPC Cross-border E-commerce Shopper Survey 2022, 22% of consumers shop online once a week, 27% shop once every two weeks, and 29% shop once a month.
Most online shoppers are 25–34 years old.
A 2022 Raydiant study on US consumer behavior reports that 56.6% of survey respondents prefer to shop online rather than in person.
As of 2022, 21% of global retail sales occurred online, with at almost 80% of consumers shopping online at least once a month.
Clothing and apparel is the most popular product category that US consumers buy online.
Bottom Line
Online shopping statistics show that having a digital presence is critical for retail businesses. It’s more than just a place to sell your products—consumers are also using retail websites and social media to discover products, read reviews, and compare pricing before making a purchase online or offline.
It is crucial to stay on top of trends about consumer spending habits and buying behavior so you can strategize your marketing better.