An inventory aging report, also called an aged inventory report or stock aging report, provides key metrics on how quickly your inventory moves. It’s essentially a list of the items on hand grouped by the length of time in inventory. It can also help reduce your cost of storing inventory by providing information on what inventory to buy. Depending on your accounting software, you can either generate a report automatically or retrieve the data and compile the report manually.
Sample Inventory Aging Report
The sample inventory aging report shown below reveals key financial data that can be used to evaluate the overall financial health of your business.
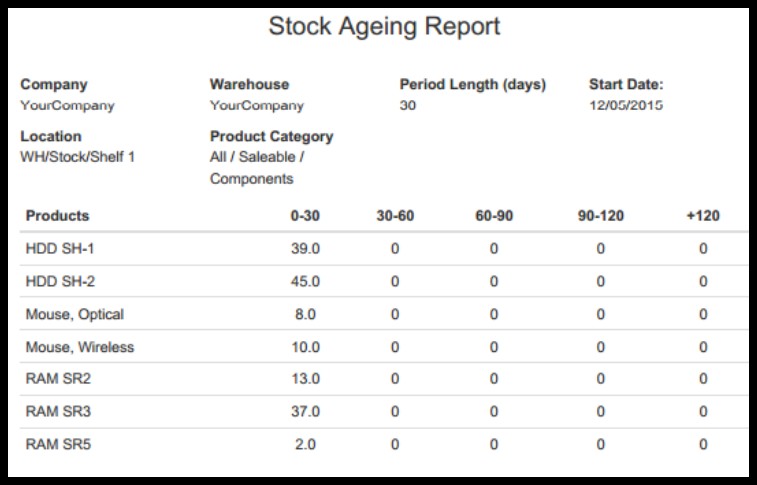
Below is an example of an inventory aging report generated in Odoo:

Sample Inventory Aging Report generated in Odoo
The above report includes each product listed on the left and the number of units in inventory grouped in 30-day increments. According to this report, all inventory items have been sitting in inventory for less than 30 days as of 12/5/15 as indicated by the first column.
An aged inventory report helps with determining inventory turnover, and you can learn more about it in our cost of goods sold (COGS) tracking guide. Additionally, if you want to see how COGS tracking is closely related to bookkeeping, then check out our bookkeeping guide.
How to Read the Inventory Aging Report
An inventory aging report may look similar to the more commonly used accounts receivable (A/R) aging report, with columns for aging “buckets,” such as one to 30 days or 30 to 60 days. It might include details such as the style or item number, warehouse, quantity, pending transactions, and available to sell.
When you view the report, examine each age bucket and how much it contributes to your total stock on hand. Ideally, you want to have most of your stock in the first two buckets, or below six months. This means you have more fresh stock than aged stock, and most of your stock is selling at full price or higher margins. In the sample report above, you’ll see that all of the stock is in the 0 to 30 days age buckets. You can also look at the buckets at a higher age, see how much they’re contributing to your stock mix, and use this knowledge to manage your aging inventory.
How to Use the Inventory Aging Report
Used effectively, an inventory aging report can be an important indicator of your company’s financial health. It can help you to anticipate potential cash flow issues and reduce financial risk. Instead of focusing on quantities available, the inventory aging report helps you to focus on dollars invested, your return on that investment, and the opportunity cost of holding too much inventory.
Generating an Inventory Aging Report
Starting with the QuickBooks Enterprise Platinum Edition 2021, you can now access two inventory reports that show the value of inventory items in stock, categorized based on their aging since purchase or acquisition. These reports, called Inventory Aging Summary and Inventory Aging Detail, provide information such as age, acquisition value, quantity, and average days in stock of each inventory or assembly item.
While the inventory aging report isn’t common in accounting software for small businesses, it’s often found in accounting software that’s ideal for mid- to large-sized companies. For example, Odoo and IBM allow you to generate an inventory aging report.
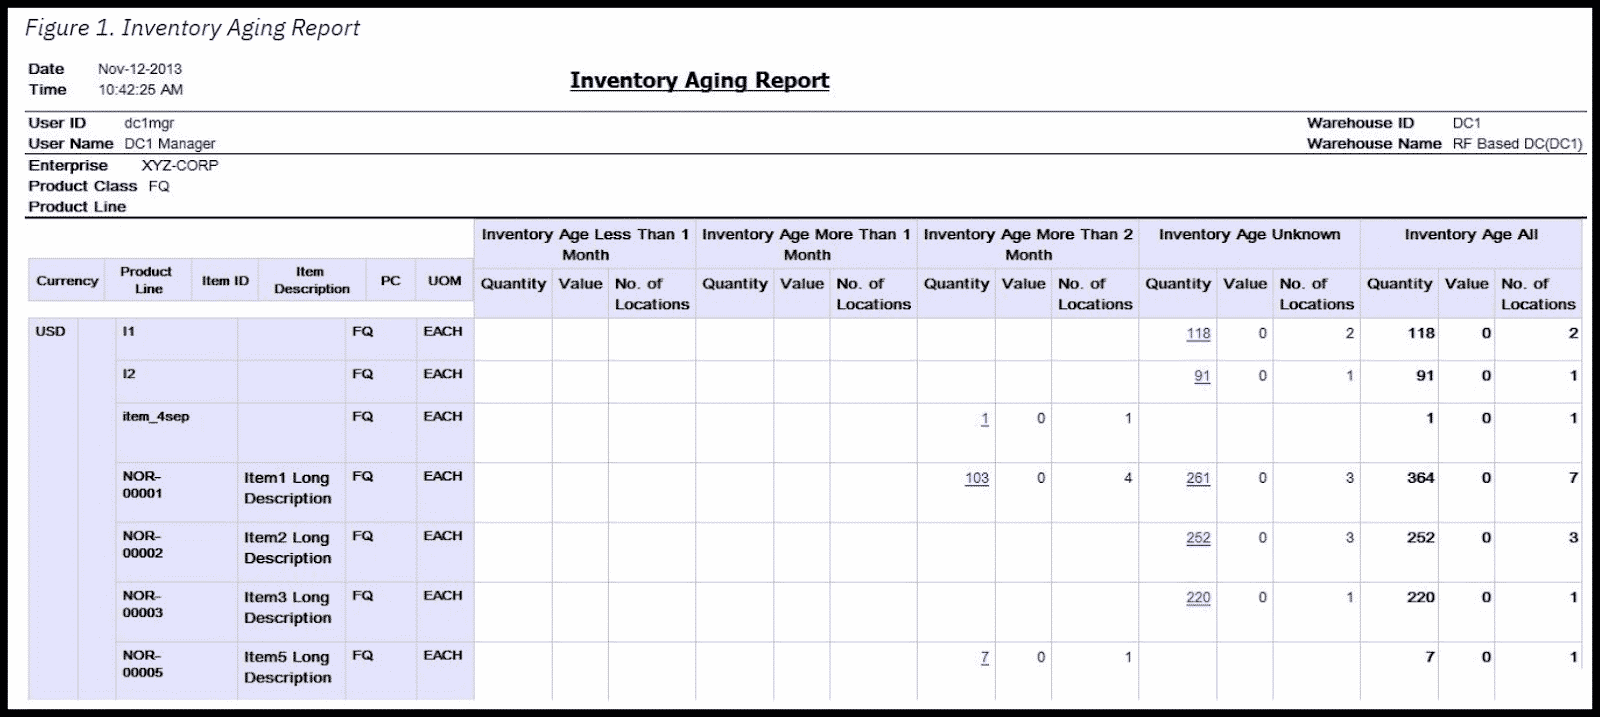
Below is a sample inventory aging report generated in IBM:

Sample Inventory Aging Report Generated in IBM
The above report generated using IBM software includes the product line, product description, and product class on the left. In contrast to the report generated in Odoo, this report categorizes inventory items into four main groups: age less than one month, age more than one month, age more than two months, and inventory age unknown. “Unknown” generally means that the receipt date was never recorded, so the age of the inventory cannot be calculated for those items.
Additional software that will generate the statement automatically include:
- Microsoft Dynamics 365 Supply Chain Management: Starting at $180 per user, per month
- SAP Business ByDesign: Starting at $212 per user, per month
- Infor CloudSuite Industrial Enterprise: Quote provided upon request
Why Inventory Aging Matters
Staying on top of the age of products sitting in inventory is important. Inventory is one of the largest―if not the largest―assets you’ll have on your books. Therefore, it’s important to keep tabs on how much inventory is sitting on the shelf and for how long. This will give you insight into what products customers are buying so that you don’t invest a lot of money into products that will never sell.
The inventory aging report provides businesses with insights, such as:
- Identifying slow-moving items
- Highlighting nonmoving items
- Understanding the length of time your products sit in inventory
- Quantifying the cost of maintaining inventory for long periods of time
Having access to this kind of information allows you to make informed decisions when it comes to what and how many products to purchase.
Ways to Improve Your Inventory Aging Report
There are many ways you can decrease the age of your inventory, but they all start with improving your inventory turnover ratio. If you can reduce the amount of time it takes for an inventory item to turn into a sale, your inventory aging report will improve. For this to happen, your inventory and purchasing departments must work together.
The inventory department needs to review the inventory aging report to determine which items aren’t moving. After these items have been identified, you need to investigate further to see why the products haven’t sold. It could be that you’re ordering too much inventory, so you have excess on the shelf. If so, reduce your order for those products, and communicate to sales to make sure you order products that move quickly so you can meet customer demand.
Key Takeaways of the Inventory Aging Report
There are several key takeaways of the inventory aging report. First, it identifies slow-moving products and products that don’t move at all. Second, it gives the purchasing department the data they need to make better decisions when ordering products. Third, it gives you key insight into the additional inventory costs you pay for products that don’t sell quickly.
- Identifies slow-moving and nonmoving products: The inventory aging report highlights products that are either slow to move or aren’t moving out of inventory altogether and helps you determine why certain products sit in inventory longer than others. This data helps determine what products you order in the future.
- Improves the decision-making on inventory purchases: Having access to what products aren’t moving out of inventory allows the purchasing department to place orders for products that do sell quickly and reduces or eliminates slow-moving products.
- Gives insight into additional costs: The longer products sit in inventory, the more it costs to keep them in a “saleable” condition. Storing products for a long time can become costly, plus non-moving products limit the space available for fast-selling products.
Bottom Line
Now that you’re more familiar with what an inventory aging report is and why it’s important, you should take the necessary steps to generate one for your business. It’ll be useful for monitoring your company’s financial health and allowing you to make informed decisions about what inventory to purchase in the future.
