Income tax in the US is complicated and—of course—very unpopular. Rich or poor, most people feel they pay too much and others aren’t paying their fair share. I’ve compiled some tax facts and statistics to shed some light on how the tax system spreads the tax burden among individuals of varying income levels as well as different business types and sizes.
While the income tax is definitely progressive with wealthy taxpayers paying a far higher tax rate, other taxes like the FICA tax and Sales tax are regressive with lower-income earners paying a higher tax rate when figured as a percentage of their income. While the idea of replacing the income tax with a national sales tax is appealing for its simplicity, I estimate a sales tax rate of 38% would be required to replace the income tax.
Key Takeaways:
- The top 10% of individual taxpayers pay over 75% of all income tax collected from individuals.
- A married couple with two children won’t pay any income tax in 2024 until they make over $66,400.
- A national sales tax on consumer spending would need to be about 38% to replace the income tax collected from individuals.
- In 2020, the largest 3,873 corporations filing tax returns had assets in excess of $105 trillion.
Tax Facts & Tax Statistics for Individuals
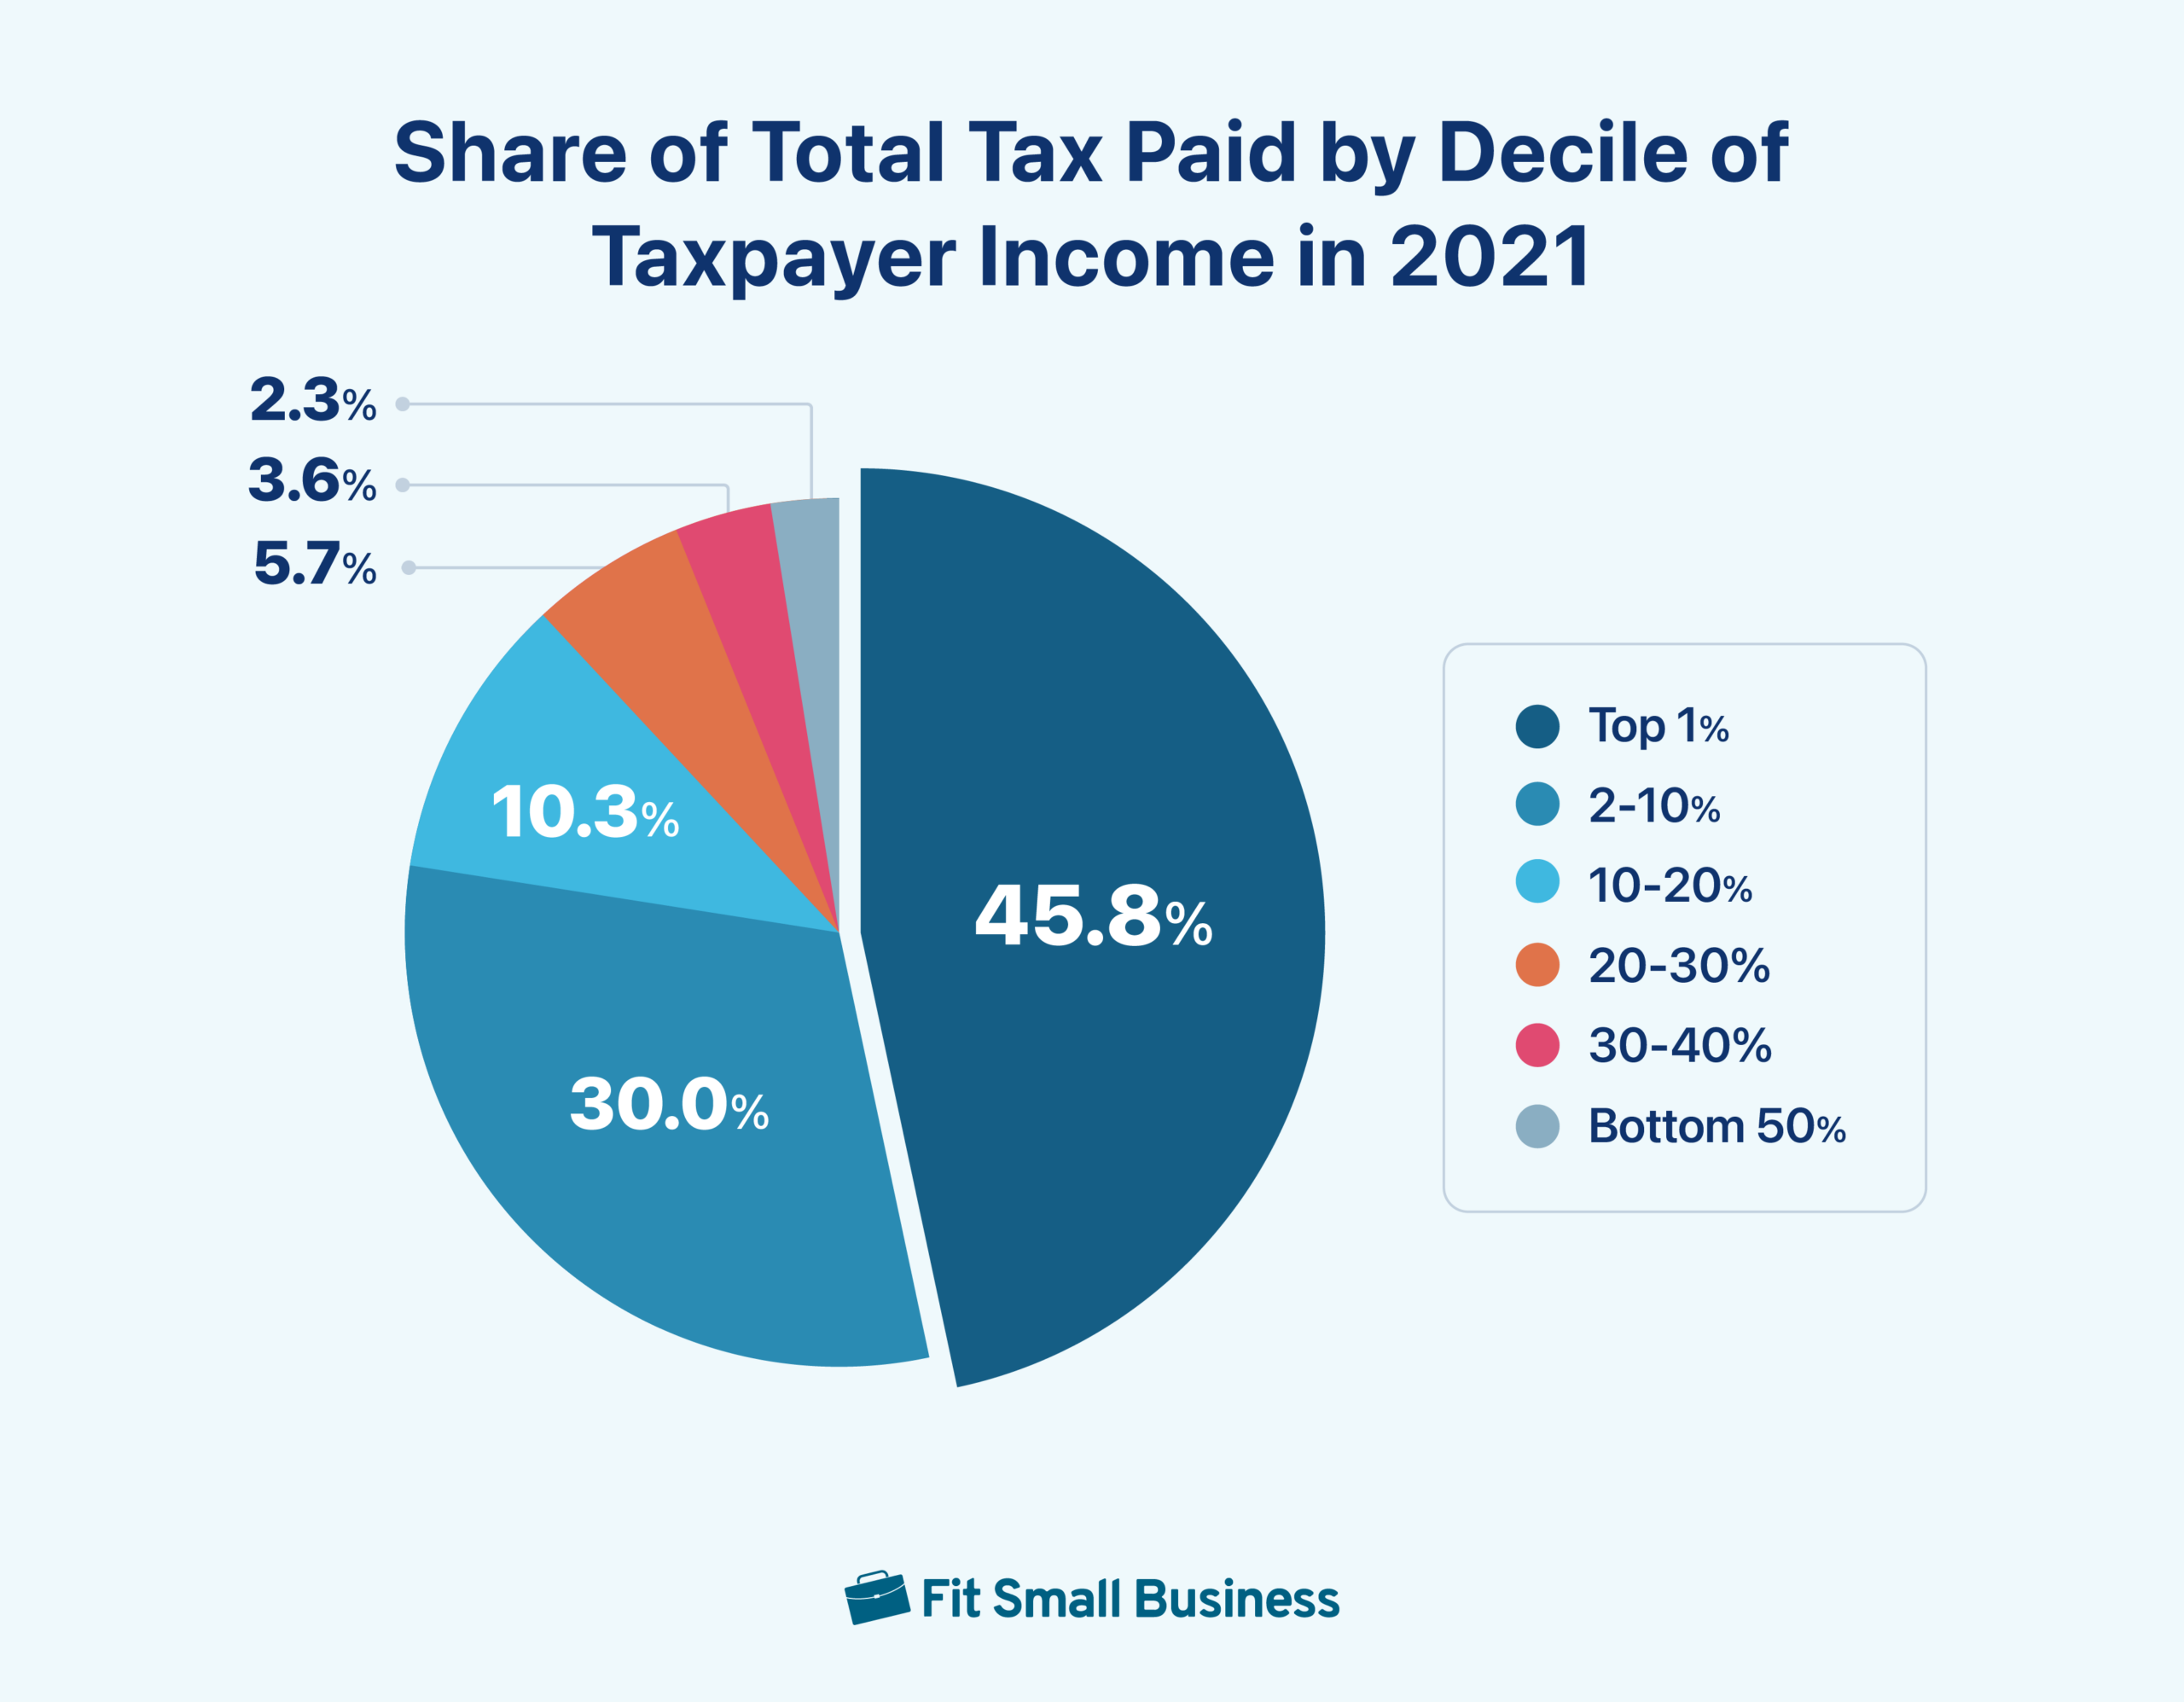
1. The top 1% of individual taxpayers in 2021 paid 45% of all income tax collected and had an average tax rate of 26%.
There were about 154 million individual tax returns filed for the 2021 tax year—the latest information available as of this writing. The 1.5 million returns with the highest reported income (the top 1% of taxpayers) had an average adjusted gross income (AGI) of $2.5 million and paid an average of $654,000 in income tax.
The total tax paid by all of the taxpayers in the top 1% was $1,004,063,000,000—about $1 trillion. The total tax assessed on all individual returns was $2,193,150,000,000—about $2.2 trillion. Therefore, the top 1% of taxpayers paid about 45% of all income tax collected. The bottom 50% of taxpayers paid only 2.3% of the total tax collected.
(Source: IRS SOI Individual Statistics Table 4.1)
2. The top decile (10%) of taxpayers pay a 21.47% average tax rate, while the taxpayers in the second decile pay an average rate of 10.81%.
The largest drop in average tax rate is between the first and second decile of taxpayers. After that, the average tax rate slowly drops until reaching 3.4% for the bottom 50% of taxpayers. The average tax rate is the total income tax paid divided by the total AGI.
Percentile of Taxpayers | Average Tax Rate |
|---|---|
Top 10% | 21.47% |
Top 10-20% | 10.81% |
Top 20-30% | 8.61% |
Top 30-40% | 7.40% |
Top 40-50% | 5.91% |
Bottom 50% | 3.35% |
(Source: IRS SOI Individual Statistics Table 4.1)
3. A married couple with $66,400 of income and two children under 17 years old will pay no federal income tax in 2024.
The first $29,200 of income for a married couple will be offset with the standard deduction. In addition, the child tax credit of $2,000 per child will offset their first $4,000 of income tax. If the couple had any federal income tax withheld from their wages, they will receive all of it back as a refund when they file their tax return.
According to the HHS poverty guidelines for 2024, the poverty line for a family of four is $31,200. Therefore, no income tax is assessed on a married couple with two children until they reach 212% of the poverty level.
While the married couple with two kids won’t pay any income tax, they will pay 7.65% FICA tax on any wages. If all $66,400 of income is wages, they would pay $5,080 in FICA taxes which, in part, will enable a social security benefit when they retire.
4. A taxpayer with a $1 million salary pays 3.22% of their wages in Social Security (SS) and Medicare tax, while a taxpayer with wages up to $168,600 (in 2024) pays 7.65%.
Unlike the progressive income tax highlighted in the first three items above, the FICA tax assessed on wages is regressive. FICA tax consists of both a 6.2% SS tax and a 1.45% Medicare tax. The SS tax is assessed only on the first $168,600 of wages in 2024, which is also the maximum amount of wages used to figure a taxpayer’s SS benefit when they retire.
The 1.45% Medicare tax is assessed on all wages. An additional Medicare tax of 0.9% is assessed on earned income (including wages) in excess of $200,000 for single taxpayers in 2024.
Let’s look at the effective FICA tax rate on a taxpayer with $100,000 in wages versus a taxpayer with $1,000,000 in wages.
Taxpayer A | Taxpayer B | |||
|---|---|---|---|---|
Medicare Wages | SS Wages | Medicare Wages | SS Wages | |
Wages | $100,000 | $100,000 | $1,000,000 | $168,600 |
Tax Rate | 1.45% | 6.2% | 1.45% | 6.2% |
Medicare/SS Tax | $1,450 | $6,200 | $14,500 | $10,453 |
Total Payroll Tax | $7,650 | 24,953 | ||
Additional Medicare Tax (0.9% of wages over $200,000) | -0- | $7,200 | ||
Total SS & Medicare Tax | $7,650 | $32,153 | ||
SS & Medicare Tax as a Percentage of Wages | 7.65% | 3.22% | ||
The 7.65% FICA tax for Taxpayer A is a flat tax rate that will apply to all wages from $1 up to $168,600. The effective tax rate of 3.22% on wages of $1,000,000 will continue to get smaller as wages increase.
Many argue this regressive tax is fair because Taxpayer B will calculate their SS benefit upon retirement based on the SS wages of $168,600, not the full $1,000,000 of wages.
5. A national sales tax of 38.2% on all consumer expenditures (except groceries and housing) would be required to replace the $2.2 trillion of income tax collected from individuals in 2022.
A popular alternative to an income tax that many people champion is a flat national sales tax. It has the benefit of being very simple to administer compared to the income tax and does not rely on people self-reporting their income and paying the tax.
The two major drawbacks are:
- It would likely be regressive with low-income taxpayers paying a higher percentage of their income in sales tax since they spend everything they make, while wealthy taxpayers save on average about 38% of their income (Financial Samurai).
- The magnitude of the tax, which I estimate at 38%. It’s hard to forecast exactly what a sudden increase of 38% in the cost of products and services would do to consumer demand. The transition could be brutal for the bottom 50% of taxpayers who won’t save much income tax—because they don’t currently pay much income tax. They’ll have no additional income and the cost of their goods and services (except groceries and housing) will increase by 38%.
According to the Bureau of Labor Statistics (BLS), in 2022, 134,090,000 consumer units (generally a family) spent on average $72,967, which resulted in nationwide 2022 consumer expenditures of $9.7 trillion. A national sales tax would likely exclude groceries and housing, which BLS reports as $5,703 and $24,298, respectively, per family unit.
The national sales tax on consumer expenditures would need to generate $2.2 trillion in revenue to replace the income tax collected from individuals. Based on the BLS spending figures and the actual individual income tax collections for 2022, I estimate the tax base and required national sales tax rate as:
Average 2022 Per Consumer Unit Expenditures | $72,967 |
|---|---|
Less average groceries | ($5,703) |
Less average housing | ($24,298) |
Sales tax base per consumer unit | $42,966 |
Consumer Units | × 134,090,000 |
Total Consumer Sales Tax Base | 5,761,310,940,000 |
Projected Sales Tax Rate | × 38.2% |
Sales tax collected (rounded) | 2,200,000,000,000 |
Of course, this is a very rough estimate of the needed sales tax rate. It only taxes consumer expenditures and is only replacing taxes paid by individuals (not businesses). In addition to this scenario, business-to-business expenditures could also be taxed to replace income tax paid by businesses and perhaps to even help reduce the consumer sales tax burden. However, I do think it’s safe to say any national sales tax would have to be very significant (over 30%) to replace the income tax.
(Sources: BLS Consumer Expenditures 2022, Financial Samurai)
Capital Gains Tax Facts & Statistics
6. Capital gains are tax-free for single taxpayers with less than $47,025 in taxable income and married taxpayers with less than $94,050 in taxable income for 2024.
Taxable income is subject to one of two separate tax rate schedules. Ordinary income tax rates vary from 12% to 37%, while the tax rates on capital gains are limited to only 0% to 20%. The capital gains tax rate to apply depends on the taxpayer’s total taxable income—not just their capital gains income. The capital gains tax rate applies to gains on the sale of stocks and bonds as well as capital gains distributed from mutual funds.
Individual taxpayers can take advantage of the low capital gain tax rates by making investments in stocks and mutual funds that generate capital gains instead of bonds and bank products that generate interest income. Taxable distributions from retirement accounts are taxed as ordinary income—not capital gains—regardless of whether the retirement account owned capital assets.
Total Taxable Income | ||
|---|---|---|
Capital Gains Tax Rate | Single | Married-Filing-Joint |
0% | $0 to $47,025 | $0 to $94,050 |
15% | 47,026 to 518,900 | $94,051 to $583,750 |
20% | $518,901 or more | $583,751 or more |
7. For 2022, about 40% of individual tax returns reporting $250,000 or more of AGI included a net capital gain.
Only 4.2% of returns reporting under $15,000 in AGI included a net capital gain. It appears individual income taxpayers with more than $250,000 in AGI are far more likely to benefit from the lower tax rate on capital gains than lower-income taxpayers. This is a frequent criticism of the special tax rates for capital gains.
(Source: IRS SOI – Individual Income Tax Returns Table 1)
Business Tax Facts & Statistics
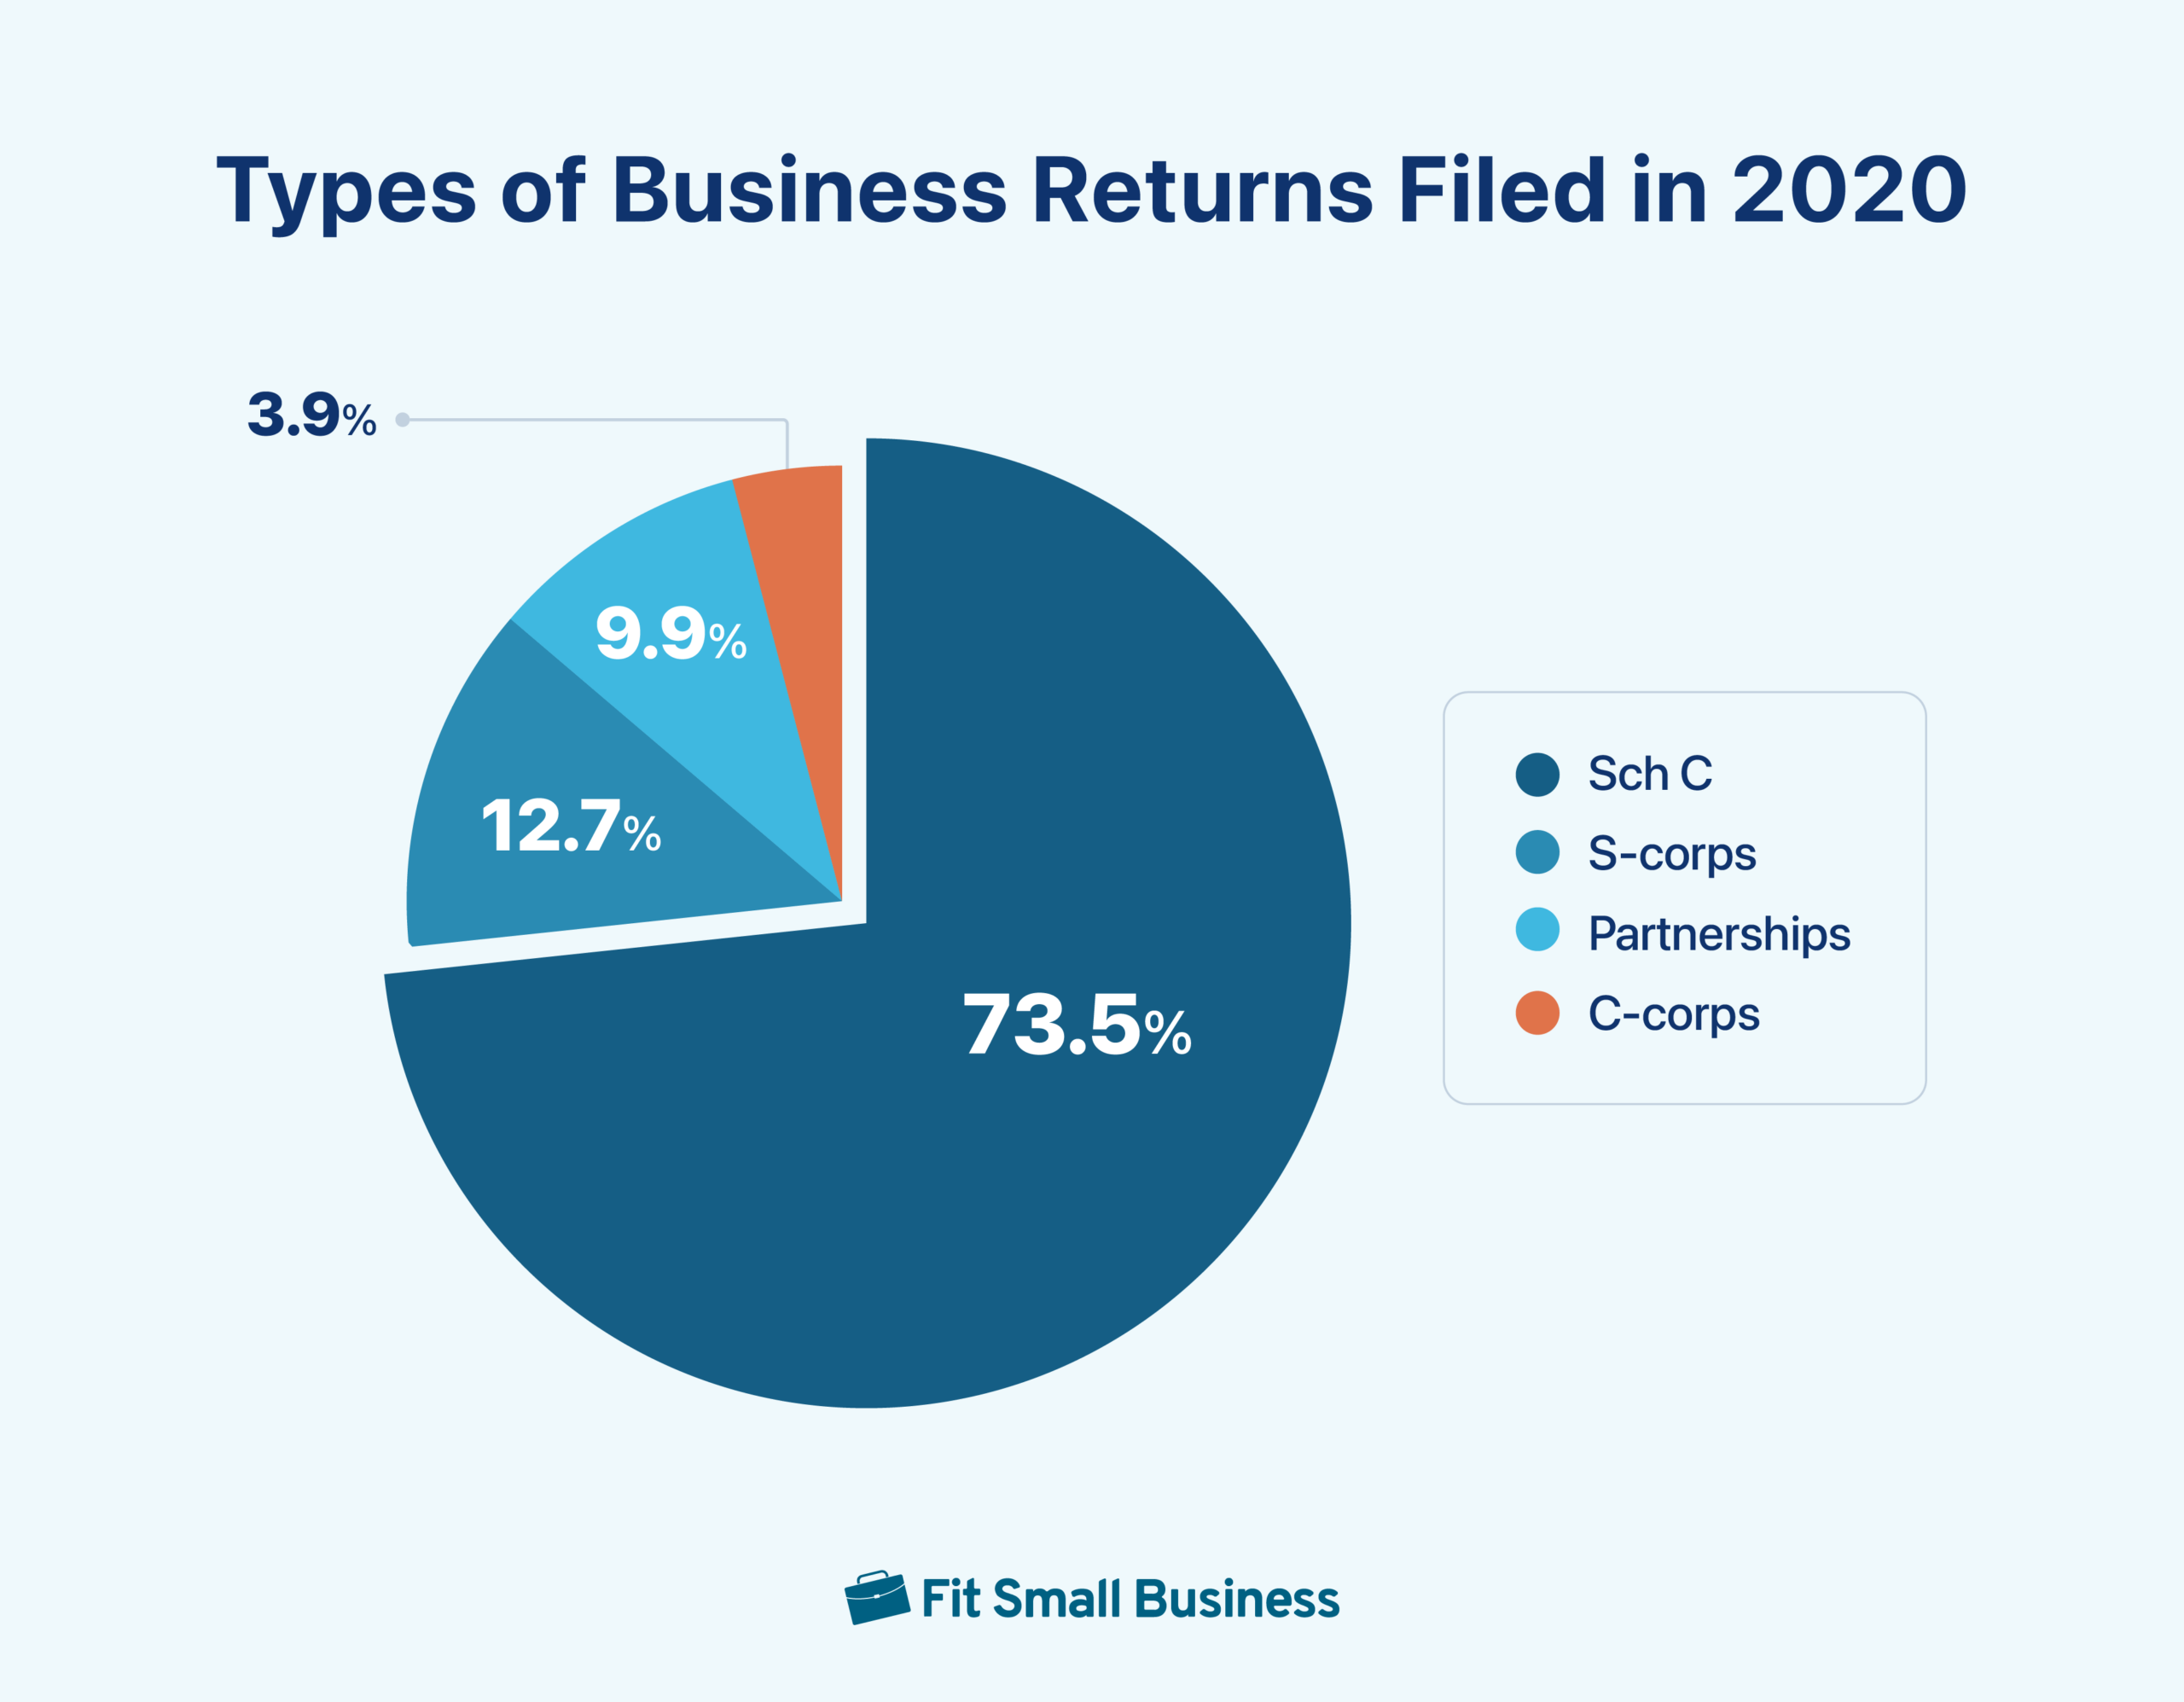
8. For 2020, there were about 38.5 million business tax returns filed.
For the tax year 2020—the most recent year available for all business types—about 28 million of the returns (73.5%) were filed on Schedule C as sole proprietors. S-corps were the second most popular business entity with 4.9 million returns, while partnerships (3.8 million) and C-corps (1.5 million) were less popular.
(Sources: IRS Publication 5655 (Rev. 9-2023), IRS Publication 5338 (Rev. 4-2024), IRS SOI Table 1)
9. For 2022, about 30.5 million sole proprietors filed business returns on Schedule C and reported an average business income of about $13,000.
This makes sense as sole proprietorships are generally the best structure for only very small businesses. As businesses grow and become more profitable, they are incorporated and start reporting income as S-corps.
(Source: IRS SOI – Individual Income Tax Returns Table 1)
10. For 2022, about 9.5 million individuals reported income on their individual returns from S-corps or partnerships with an average business income of $107,000.
This is the average business income reported per partner or S-corp shareholder. It’s considerably more than the income reported on Schedule Cs, again consistent with taxpayers making the smart decision to incorporate as their business becomes larger and more profitable.
(Source: IRS SOI – Individual Income Tax Returns Table 1)
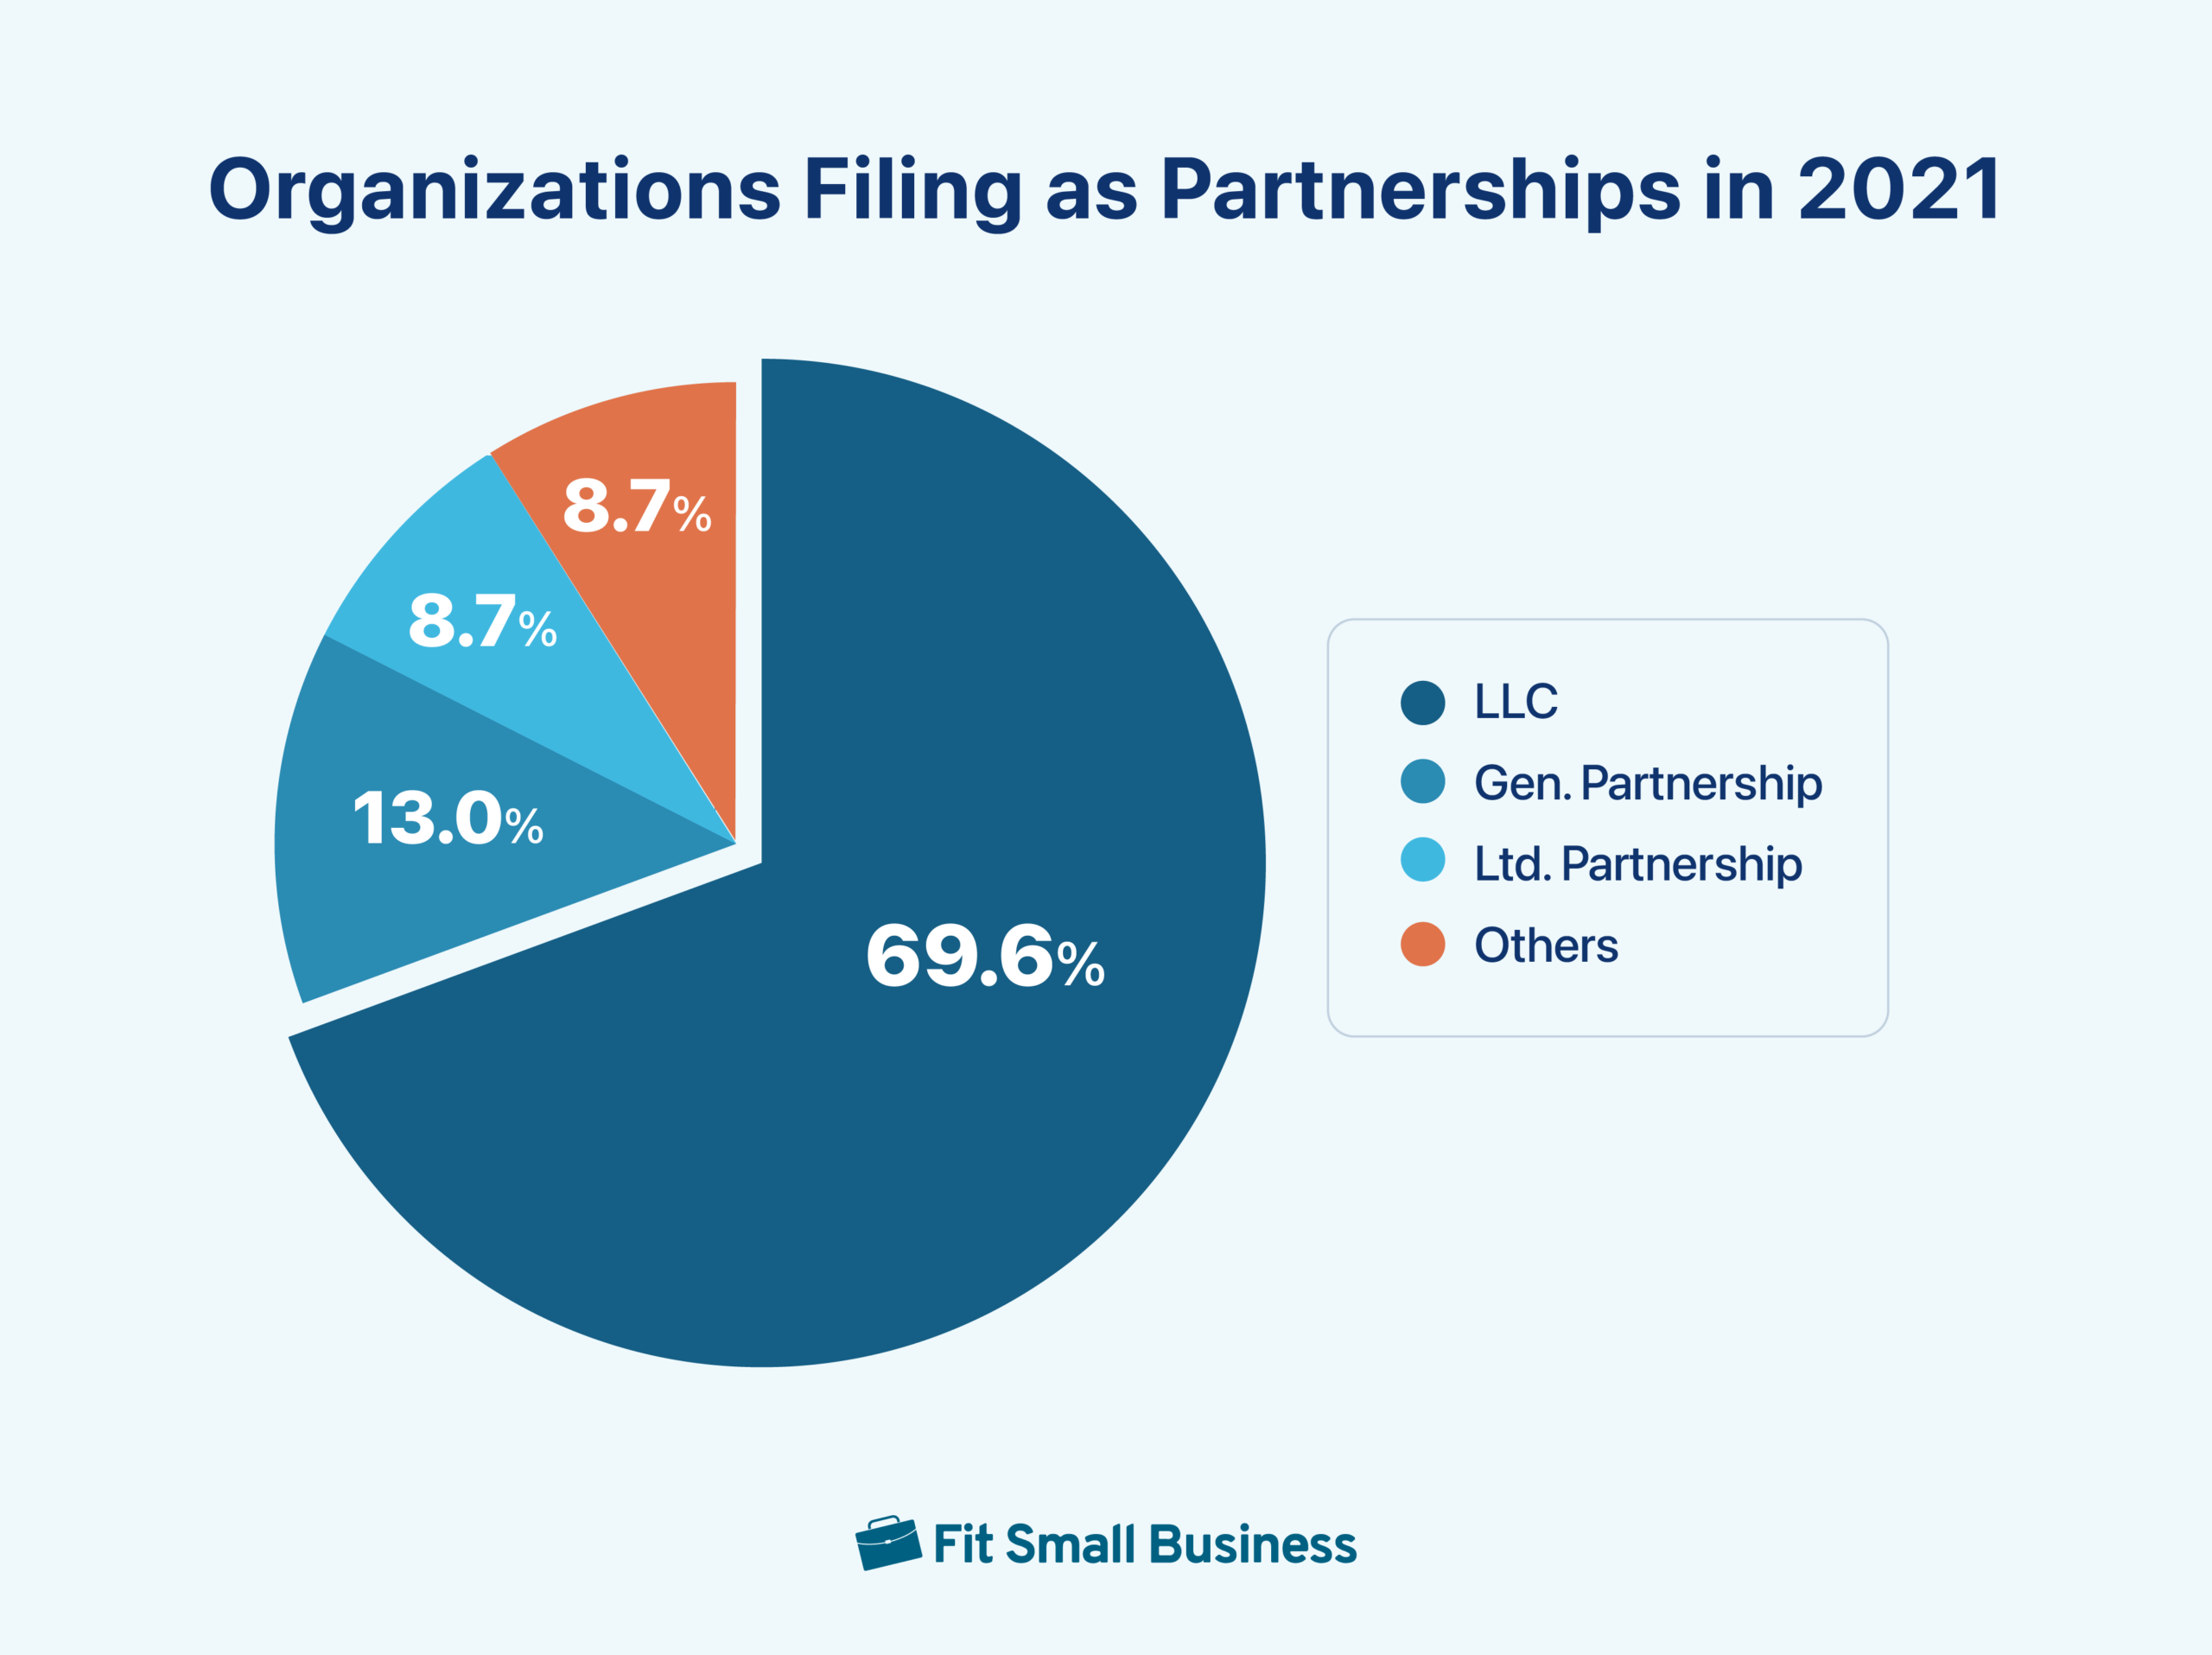
11. The majority (69.6%) of partnerships in 2021 are Limited Liability Companies (LLCs)
Many types of entities can be treated as partnerships for tax purposes. In addition to LLCs, partnerships include general partnerships (GPs), limited partnerships (LPs), and limited liability partnerships (LLPs). While GPs are the easiest to form, only about 13% of partnerships are GPs.
(Source: IRS Statistics on Income Table 9a)
12. In 2020, the largest 0.06% of corporations filing tax returns controlled over $106 trillion of assets, or 85% of all assets reported on corporate tax returns.
There were 3,873 corporate tax returns in 2020 that reported over $2.5 billion in assets. Cumulatively, these 3,873 corporations had assets in excess of $106 trillion and net income of $2 trillion dollars.
(Source: IRS SOI Corporation Income Tax Returns Table 2.1)
13. In 2020, there were about 1.5 million returns filed for C-corps on Form 1120 and they paid an average tax rate of 17.6%.
The statutory tax rate for C-corps in 2020 was a flat 21%. However, because of special deductions and tax credits, the actual rate can be lower. The average tax rate varied considerably based on the size of the C-corp. The 2,005 C-corps with over $2.5 billion in assets paid an average tax rate of only 13.7%.
(Source: IRS SOI Corporation Income Tax Returns Table 2.3)
Bottom Line
I hope these statistics help you understand the distribution of the income tax burden among US taxpayers and businesses, as well as the massive revenue collected each year by the IRS and how difficult the income tax would be to replace.
