A chargeback is the reversal of funds to a customer after they dispute a transaction. While chargebacks exist to protect consumers, they can mean penalties and potential revenue loss for merchants. Another growing concern is chargeback fraud, or when a cardholder makes an illegitimate chargeback claim on a purchase.
In 2023, chargebacks and chargeback fraud were on the rise. We dive into more chargeback statistics below to help you learn more about the current state of chargebacks and what it means for your business.
General Chargeback Statistics
Let’s start by examining some general chargeback statistics. We’ll look at the total costs of chargebacks, common reasons for chargebacks, and the average chargeback rate for merchants.
1. There were 238 million chargebacks globally in 2023
It is estimated that 2023 saw 238 million chargebacks in the global ecosystem—and this number is only projected to increase. By 2026, global chargeback volume will be approximately 337 million, representing a 42% increase from 2023.
2. Total chargeback costs for 2023 were projected to exceed $117 billion
For 2023, total chargeback costs worldwide were expected to reach $117.46 billion. The burden of these costs is split between banks and merchants, with the latter suffering a projected $79 million in losses.
3. The average cost of chargebacks is $191
Based on an average $90 disputed transaction, it is estimated that an average chargeback cost $191 in 2023. What comprises these costs? Merchant costs were projected at $128, while acquirer costs and issuer costs averaged $26 and $37 per chargeback, respectively. These costs depend on the type and size of your business, but can generally add up quickly.
Learn more about how chargebacks work in our small business guide.
4. The most common reasons for chargebacks are fraud, product issues, and billing discrepancies
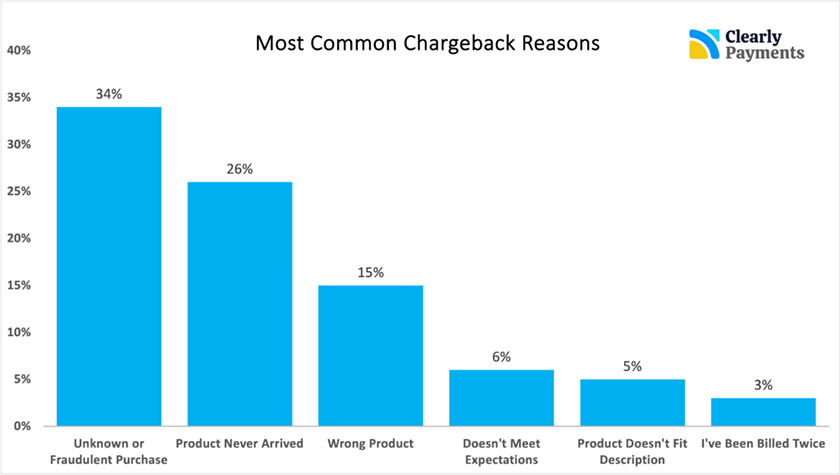
Fraudulent activity accounts for nearly a third of all chargebacks, followed closely by reports that the products that customers ordered simply never arrived. Other reasons include customers being sent the wrong product, the product not meeting expectations, and the product not fitting descriptions. Billing discrepancies, such as being billed twice, were also among the most common reasons cited.

(Source: Clearly Payments)
5. The average chargeback rate is 0.56%
A chargeback rate compares a merchant’s total sales against the total number of chargebacks they received—meaning out of 1,000 transactions, 5.6 are chargebacks.
Chargeback Fraud Statistics
Chargeback fraud, also known as friendly fraud, occurs when customers report legitimate transactions as fraud. Learn why it is a growing issue for merchants.
6. Credit card fraud was projected to account for 67.2% of total US card fraud losses
A 2022 Insider Intelligence forecast card fraud losses in the US to reach $12.6 billion. Of this figure, card-not-present (CNP) fraud accounted for an estimated 72% while credit card fraud accounted for 67.2%.
It can be difficult to attribute card fraud losses to friendly fraud—and thus, difficult for merchants to dispute. This is because the transactions are made by legitimate customers, and malicious intent can be hard to prove.
7. 34% of businesses experienced friendly fraud in 2022
Chargeback activity dipped in 2022, but there were still plenty of friendly fraud cases, with a third of businesses reporting they experienced friendly fraud. This type of fraud was among the most common forms experienced by ecommerce merchants. Other common forms of payment fraud identified in the study are phishing attacks, identity theft, and card testing.
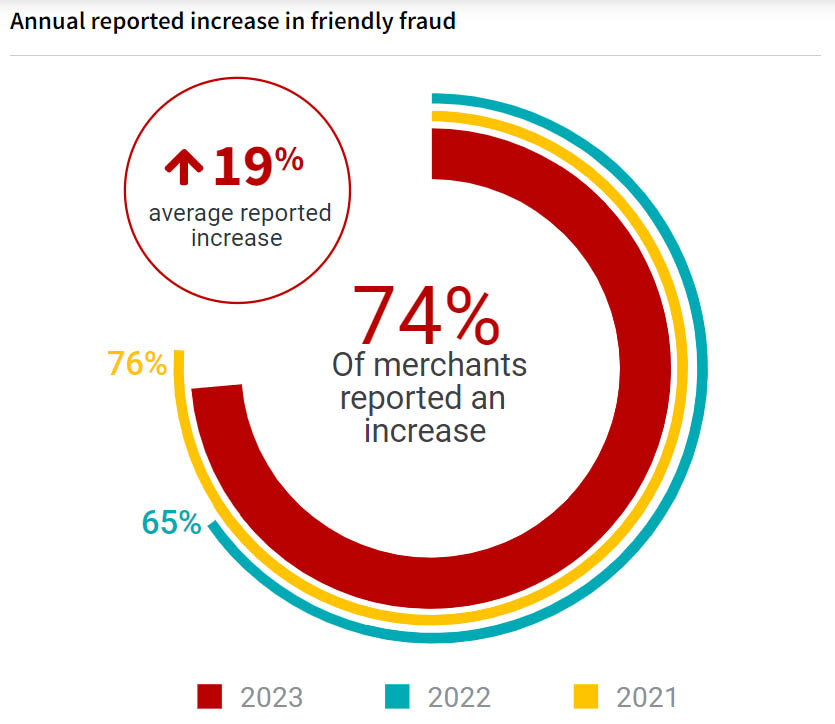
8. 74% of merchants reported an increase in friendly fraud in 2023
Friendly fraud peaked in 2021 during the COVID-19 pandemic and appeared to decline in 2022. However, nearly 75% of merchants cited an increase in friendly fraud instances in 2023, rising 10% from the previous year.

(Source: Chargebacks911)
9. 17% of customers who file chargebacks have committed friendly fraud
A 2021 study by Sift found that 17% of customers who filed chargebacks admitted that they filed a transaction dispute that wasn’t actually fraudulent. Friendly fraud only occurs when the person committing the fraud is the legitimate cardholder in contrast to true fraud, which happens without the cardholder’s authorization.
10. Nearly half of ecommerce sellers prioritize chargeback prevention
In 2023, 46% of global online sellers prioritized the prevention and management of fraud and chargebacks as part of their overall fraud management strategy. This figure was at 40% in 2021, indicating that fraud and chargeback prevention have become more important to online merchants over time—even more than reducing operational costs and improving the customer experience.
11. Larger merchants are more likely to identify chargebacks as friendly fraud
Merchants earning over $100 million in annual revenue estimate that 44% of their chargebacks were, in fact, cases of friendly fraud. As a business increases its annual revenue and enlarges its customer base, it will also need to implement more safeguards against chargeback fraud to counteract the higher risk.
Chargeback Associated Costs
In the chargeback statistics below, we look at how much companies spend on disputes chargeback management.
12. Small to mid-size businesses spend the most on fraud management
Merchant Risk Council found that ecommerce businesses with annual revenues between $50,000 and $5 million doubled their spending on fraud management from 2022 to 2023.
13. For every $100 in chargeback fraud disputes, merchants spend $35 for dispute management
A report from Merchant Risk Council identifies friendly fraud as a type of fraud that can be particularly costly to combat. Merchants spend $35 to manage friendly fraud for every $100 worth of disputes.
14. Most chargeback disputes fall within the range of $25–$75 in value
Given the volume of chargebacks that merchants have to deal with, this $25–$75 cost range can quickly pile up into huge losses. More than half of cardholder buyers admitted that they filed a chargeback claim without even trying to contact the merchant first.
Chargeback Trends
Some chargeback trends, such as customer filing patterns and dispute management solutions, can provide insights into how merchants should handle chargebacks and chargeback disputes.
15. More than half of surveyed businesses have at least one chargeback risk factor built into their business model
Certain factors increase the risk of chargeback disputes—both genuine disputes and malicious attempts at fraud. A study found that over half of companies surveyed have at least one of the following risk factors built into their business models:
- Offering subscription billing (36.6%)
- Being in a high-value industry or product category (20%)
- Offering free trials (20%)
- Affiliate marketing (16.6%)
16. Merchants selling physical goods usually have lower chargeback rates
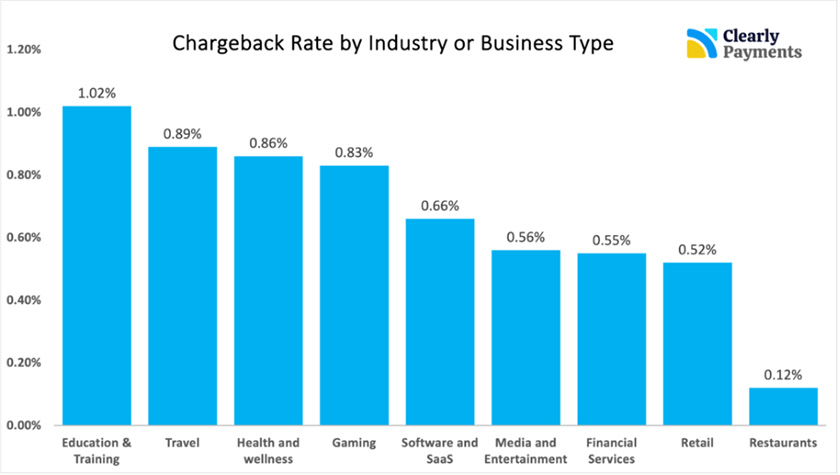
Merchants that sell services, time, or digital goods tend to have the highest chargeback rates out of the total number of purchases. Those selling physical products tend to have chargeback rates of around 6%.

(Source: Clearly Payments)
In general, the accepted maximum chargeback rate is 1—anything above this number means high payment processing fees and restrictions.
17. Buyers who successfully file a chargeback are almost 10 times as likely to file another one at some point
If a customer makes a chargeback claim and gets refunded, they are nearly 10 times as likely to file another claim in the future. In fact, about 40% of consumers who commit chargeback fraud will try to do so again within two months.
18. Cardholders file an average of 6 disputes
Disputes should ideally be the last resort for consumers. However, Chargebacks911’s survey asked cardholders how many transactions they disputed in the last 12 months—and the average was 6 disputes.
19. On average, 76% of merchants challenged invalid chargebacks in 2023
More than three-quarters of all merchants challenged invalid chargeback claims in 2023. Larger businesses with more resources were generally more likely to fight back in this way, while smaller businesses with fewer resources did so less frequently.
20. Only a third of businesses have a dedicated team for managing chargeback issues
Thirty-three percent of companies formed a dedicated team specifically for handling chargeback cases. This was the second most common approach, with a slightly higher incidence (35%) of companies using their accounting and finance teams to manage chargebacks. Other companies delegated these issues to their operations or loss-prevention departments.
Bottom Line
Chargebacks are never a pleasant prospect for business owners, but they are a reality that you need to prepare for—all the more if you do much of your business in the ecommerce space. The more you know about the common patterns and trends of chargebacks and the associated fraud, the better you can shield your business from negative effects such as lost revenue and a damaged reputation.