

Projects can drift off course when teams struggle with scattered communication or unclear ownership, which places timelines and resources at risk. Stakeholder mapping templates reveal each person’s level of influence and interest, as well as the relationships your project must manage. This guide shows you how to use stakeholder mapping templates to identify and prioritize the people who shape your project’s success.
Free stakeholder mapping template
Common types of stakeholder mapping templates
Power-interest grids, network maps, heat maps, salience models, and rainbow diagrams offer different ways to visualize influence and relationships among stakeholders. Each template focuses on the connections and priorities that drive stronger collaboration and project alignment.
1. Power/interest grid (Mendelow’s matrix)
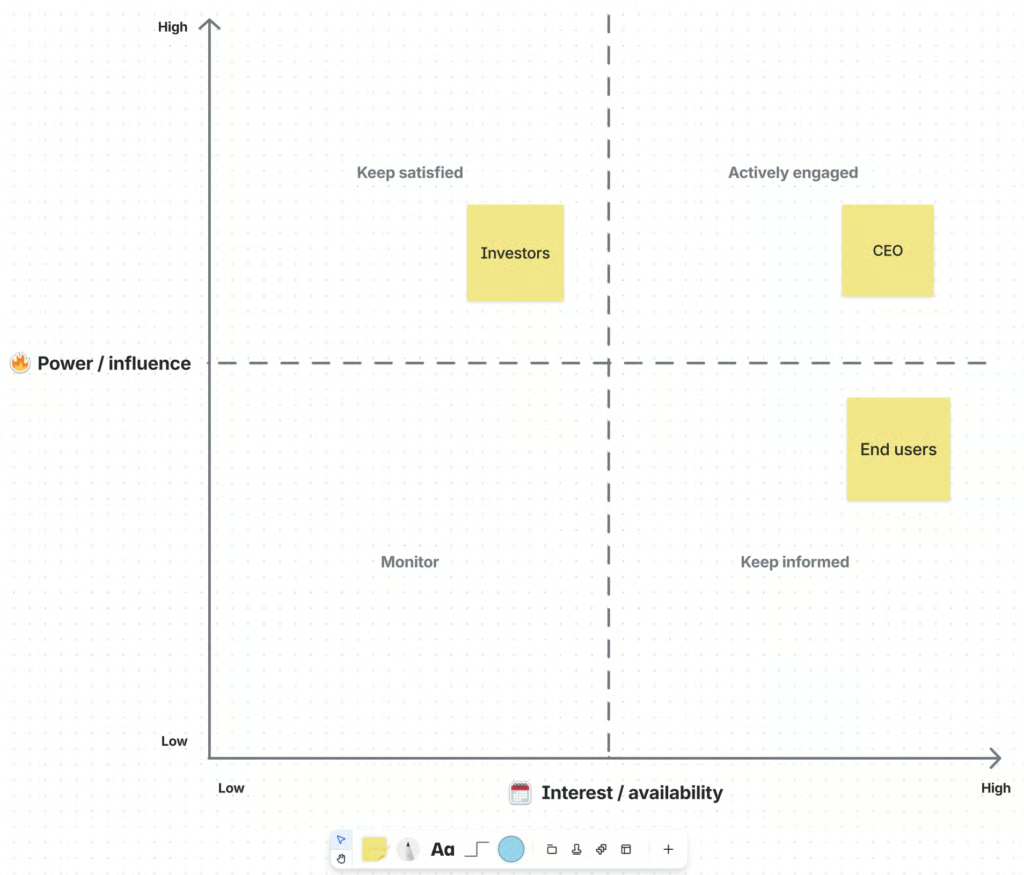
The Power/Interest Grid helps project managers focus communication and resources on stakeholders with the highest influence and engagement. (Source: Confluence)
Developed by management theorist Aubrey L. Mendelow in 1991, the Power/Interest Grid helps project managers categorize stakeholders based on their level of authority and interest in project outcomes. Power refers to each stakeholder’s ability to influence project decisions or outcomes. This framework makes it easier to decide who requires active engagement and who only needs periodic updates to stay informed.
Confluence’s Power/interest grid template lets you organize stakeholders by plotting their level of influence on one axis and their level of interest on the other. It works through a simple quadrant layout that helps you categorize each stakeholder into four groups: high power and high interest, high power and low interest, low power and high interest, or low power and low interest.
By placing names in the appropriate quadrant, you can determine who to engage closely and who to keep informed, which ensures communication efforts match each person’s influence and involvement in the project.
2. Stakeholder relationship/network map
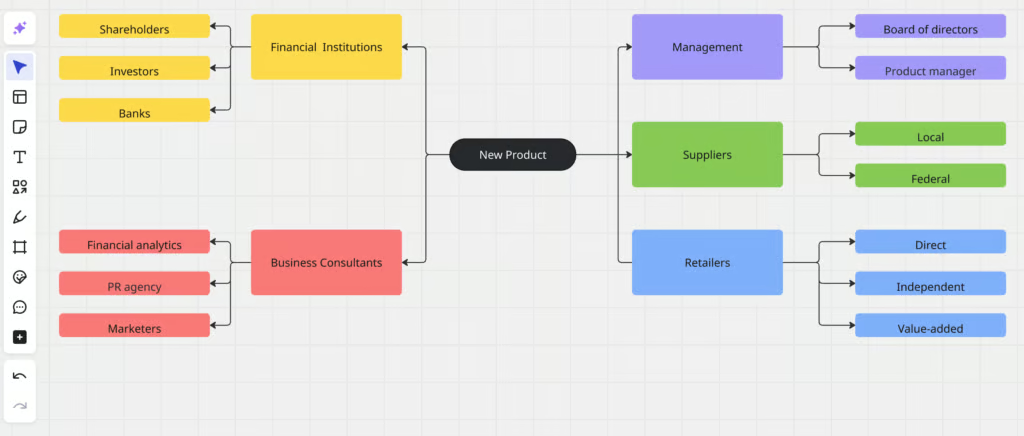
The Stakeholder Relationship Map visualizes how internal and external stakeholders connect and influence one another around a central project goal. (Source: Miro)
This stakeholder relationship map from Miro visualizes the connections between stakeholders and the central project or product. Each node represents a stakeholder group, while the lines illustrate the relationships or communication paths.
The layout demonstrates influence and interdependence by showing how groups such as management, suppliers, and consultants connect to the project and to one another. You can adjust spacing and connections to trace key influencers or identify potential communication gaps among departments or with external partners.
3. Stakeholder heat map
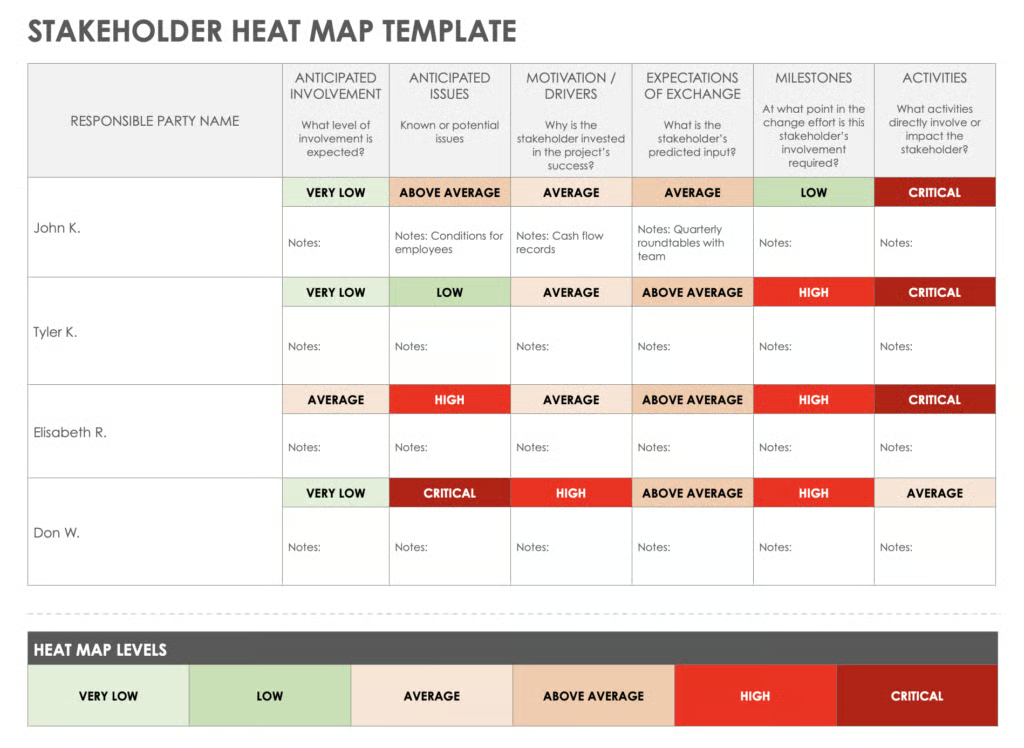
The Stakeholder Heat Map uses a color-coded system to assess involvement, motivation, and potential risks tied to each stakeholder. (Source: Smartsheet)
This stakeholder heat map from Smartsheet uses a color-coded table to plot stakeholder engagement across several dimensions, such as involvement, issues, motivation, expectations, milestones, and activities. Each category uses ratings from very low to critical, which makes it easier to visualize risk levels and identify where attention is most needed.
The table format allows you to leave notes for each stakeholder, so you can interpret the reasons behind their scores. This helps project managers determine who requires constant communication and which factors may affect participation throughout the project lifecycle.
4. Salience model
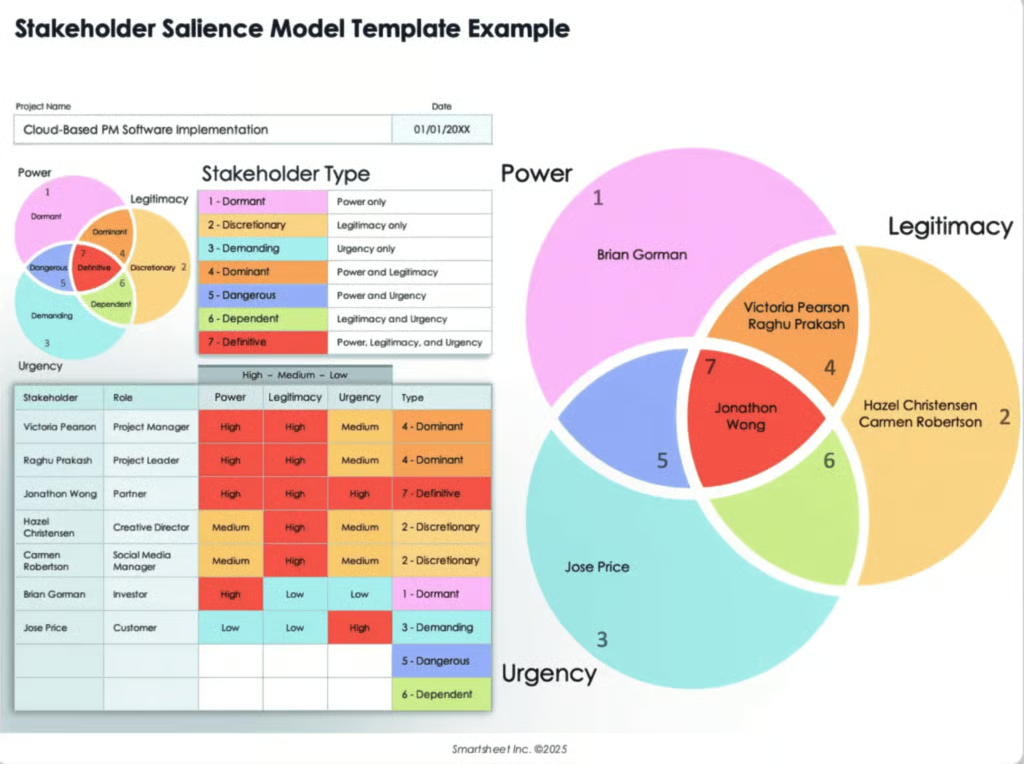
The Stakeholder Salience Model evaluates power, legitimacy, and urgency to determine who holds the most influence on project decisions. (Source: Smartsheet)
The stakeholder salience model in Smartsheet emphasizes three core attributes: power, legitimacy, and urgency. It uses a Venn diagram to visualize the overlap of these traits and a color-coded table that lists each individual’s role and influence level, such as dormant, dominant, dependent, or definitive.
This structure helps you recognize who holds real decision power and who depends on others to act. Combining these elements determines which stakeholders deserve priority communication and routine updates.
5. Rainbow diagram
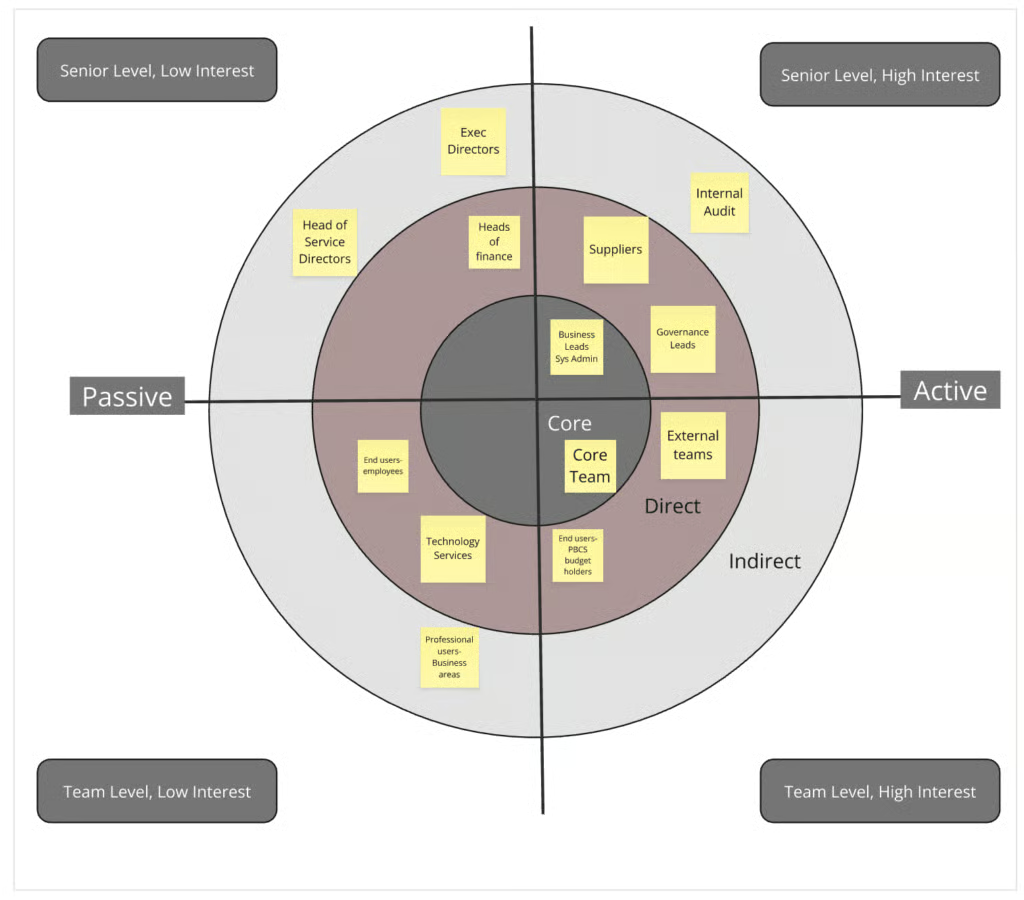
The Rainbow diagram shows the proximity and engagement level of stakeholders to identify who participates directly or indirectly in a project. (Source: Miro)
Miro’s rainbow diagram maps stakeholders in concentric circles that represent their proximity and engagement level with the project. The innermost circle marks the core team with direct control, while the surrounding layers capture groups with decreasing involvement, such as support functions or external partners.
Horizontal and vertical axes show activity and influence, separating active from passive participants and distinguishing team-level from senior-level stakeholders. This setup visualizes the reach of communication efforts and how closely each group connects to project outcomes.
What is stakeholder mapping & why it matters
Stakeholder mapping is a visual method for identifying the people, groups, or organizations that can influence or be affected by a project. The process places each stakeholder according to their level of power, interest, or relationship to the project goal.
Using this approach enables project managers to understand who needs active engagement and who requires only periodic updates. By mapping influence and connections, you can anticipate reactions, manage expectations, and establish a communication strategy throughout the project lifecycle.
What are the types of stakeholders?
Stakeholders fall into distinct groups based on their relationship to the project and their level of influence or impact.
- Internal stakeholders: These are people within your organization, such as executives, project teams, and department heads. They have a direct role in decisions, resources, and outcomes.
- External stakeholders: Working outside the organization itself, these include clients, suppliers, regulators, and community representatives. Their involvement affects compliance, partnerships, or the project’s acceptance outside the organization.
- Primary stakeholders: These are individuals or teams most affected by project results, such as users or customers. Their needs often shape project priorities and deliverables.
- Secondary stakeholders: They influence the project indirectly, such as media outlets, advocacy groups, or external consultants. Their input can affect reputation or resource access.
Why not all stakeholders are equal
Not every stakeholder holds the same weight or influence in a project. Some are power brokers who shape decisions and control resources, while others are highly interested in outcomes but have limited authority. Recognizing these differences will help you balance communication and engagement.
Influential stakeholders often need to be involved in strategic discussions, while interested stakeholders may only need updates or consultations at key milestones. Understanding each group’s impact ensures your engagement strategy focuses on those who can directly affect project success.
Step-by-step guide: How to use a stakeholder mapping template
Once you have chosen the stakeholder mapping template that fits your project, the next step is to fill it out with information about your project stakeholders. Follow these steps to complete your visual map.
1. Identify all stakeholders
List everyone who influences or is affected by the project. Include internal participants such as team members or executives and external groups like clients or regulators.
2. Gather information about their interests and influence
Collect data on what each stakeholder values and how much control they hold over decisions. Use interviews, surveys, or previous project records to understand their expectations.
3. Plot stakeholders on the template
Place each stakeholder within the grid or diagram based on their level of power and interest. Proper positioning reveals who requires close management and who only needs updates.
4. Define engagement strategies
Plan how you will communicate with each group. High-influence stakeholders might need regular one-on-one meetings, while low-influence participants can receive summary updates.
5. Review and update regularly
Revisit the map at major milestones or when project conditions shift. Updating ensures the template continues to reflect current relationships and decision dynamics.
When to use a stakeholder map
A stakeholder map is most useful at the start of a project when you need to identify who holds influence and who depends on the results. It helps you plan engagement strategies before important milestones or organizational changes occur, such as scope adjustments or leadership transitions. Updating the map during reviews ensures that relationships and communication paths remain relevant throughout the project.
FAQs
Review your stakeholder map when important milestones occur or when project scope, priorities, or leadership changes. Regular updates keep the map accurate and your engagement plan relevant to everyone involved.
A stakeholder map shows influence and relationships among key participants and helps plan engagement. A RACI matrix, on the other hand, outlines who is Responsible, Accountable, Consulted, and Informed for each task and defines clear ownership and decision authority within the project.
Miro is one of the best tools for building a stakeholder map template because it lets you visualize relationships, influence, and engagement levels through customizable, drag-and-drop diagrams.
No, you can also use models like the salience model, relationship map, heat map, or rainbow diagram to analyze engagement from different perspectives.
A stakeholder register lists contact details, roles, and expectations. It complements the stakeholder mapping template by turning visual insights into actionable data for planning and communication.