

A vast majority of small businesses are missing the benefits of live chat software that can help increase productivity, customer satisfaction, and sales. See how with these live chat statistics.
Live chat is a customer service tool that human support representatives use to provide real-time, immediate assistance to customers. It enables businesses to provide a fast and reliable channel to interact with customers, saving them time and effort waiting for email responses and phone calls. In this article, you’ll learn the top live chat statistics to help your business deliver excellent customer service via real-time messaging.
Highlights
- Live chat’s global market share is increasing every year as many companies are investing in this tool even after the pandemic.
- As customer service agents are required to handle more live chat interactions every year, customer satisfaction has been trending downward.
- Combining chatbots and artificial intelligence (AI) with the expertise of human live chat agents helps boost efficiency and productivity.
- Live Chat Statistics: Market Share & Business Impact
- Live Chat Statistics: Chatbots
- Live Chat Statistics: Customer Service Agent
- Live Chat Statistics: Customer Service Manager
- Live Chat Statistics: Customer Experience & Preferences
- Live Chat Statistics: Industry Breakdown
- Frequently Asked Questions
- Bottom Line
Live Chat Statistics: Market Share & Business Impact
The live chat software industry’s market share significantly increased because of online shoppers’ growing preference for self-help options. Many consumers use live chat to find immediate answers to their product-related questions like customization options. This leads to positive business impacts, such as more sales opportunities and higher overall revenue. Check out the following statistics on the live chat software market size and its impact on your business.

1. In 2024, the global market share for live chat software is $866.15 million, with an expected compound annual growth rate of 7.84%.
Takeaway: Live chat software has become an essential tool in resolving customer issues, which became popular during the pandemic. Unlike other communication touchpoints, customers are the ones who first initiate conversations on live chat because it’s a self-service tool. Hence, businesses should invest in live chat software to provide this option to customers for omnichannel communication.
(Source: Precision Reports on LinkedIn)
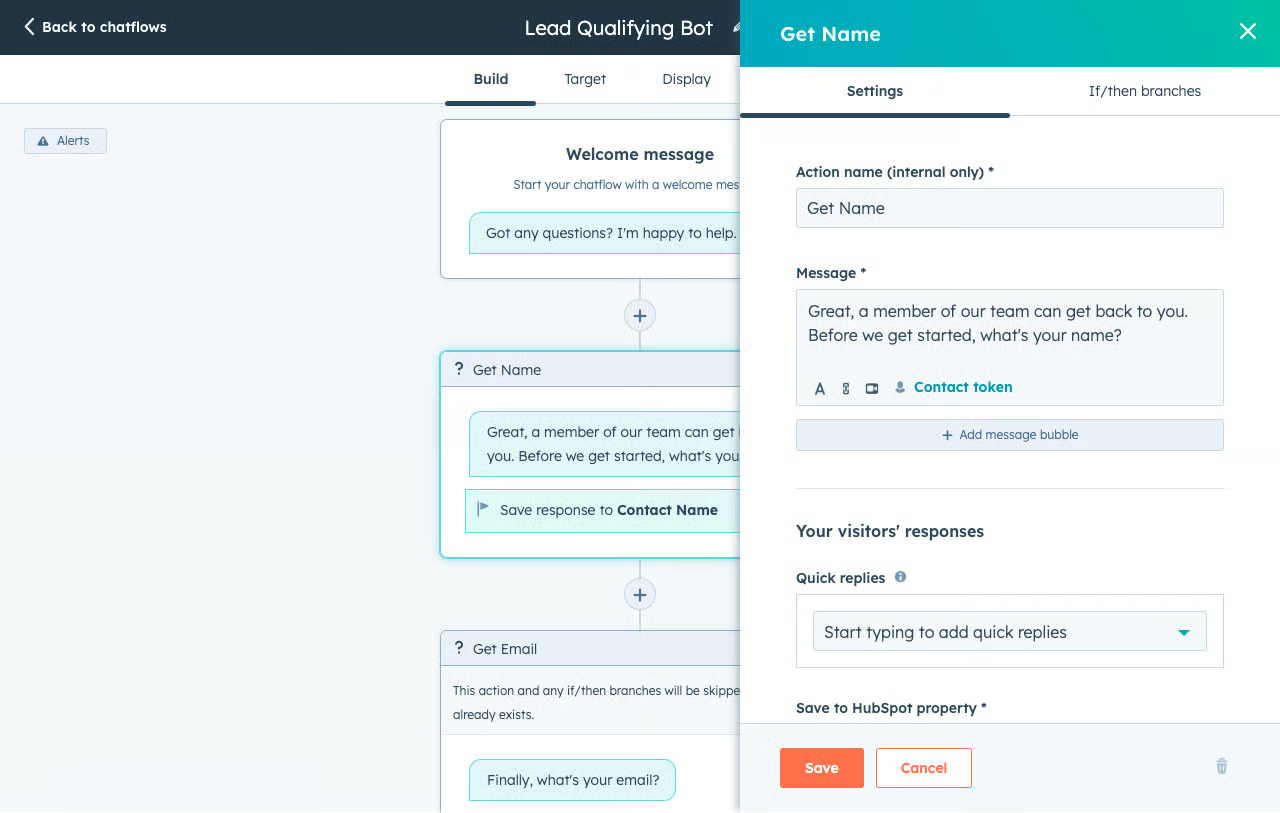
2. About 79% of businesses that implement live chat gain a positive revenue impact.
Takeaway: If you want to boost your sales, consider incorporating live chat into your omnichannel customer service strategy. This opens new lead generation, engagement, and sales opportunities for your small business. For instance, you can request for the user’s name, email address, and phone number before answering online inquiries, generating new potential sales leads.
(Source: Gorgias)
3. WhatsApp is the world’s No. 1 downloaded mobile messenger app, with 51.19 million downloads in 2024.
Takeaway: Messaging apps like WhatsApp can be integrated with other third-party apps like SleekFlow’s live chat widget to optimize omnichannel customer communication. It combines customers’ favorite social messaging channels into an all-in-one platform. This helps reps manage all messaging and live chat conversations in one place.
(Source: Statista)
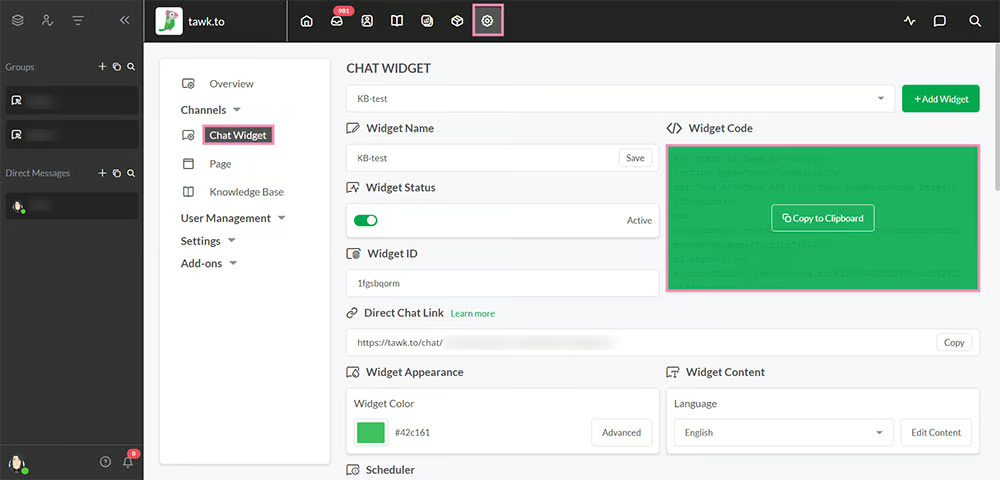
4. Tawk.to has a live chat market share of over 22% in 2023.
Takeaway: If you plan to invest in live chat software, choose a provider with a great track record of developing tools for proactive customer experiences. Check buyer’s guides like best managed live chat services to help you make a more informed decision. These resources are usually provided by tech media publishers, industry experts, and verified users.
(Source: Statista)
Live Chat Statistics: Chatbots
Chatbots assist customer service reps by processing tickets, responding to general questions, handling repetitive tasks, and providing self-service options. This helps reps focus on addressing more complex customer issues. Check out the live chat stats showing the average customer satisfaction (CSAT) score of chatbot conversations and the volume of chats handled with and without chatbots below.
5. Over 152 million cases were handled with the help of chatbots vs over 1.4 billion without it.
Takeaway: While some companies prefer to handle inquiries solely through live agents, you should consider using chatbots for assistance if you receive an increasing number of support requests than the average. Combining AI with the expertise of human live chat reps boosts efficiency and productivity.
(Source: LiveChat)
6. The average CSAT score of live chat in 2023 is 4.2 out of 5.
Takeaway: The live chat CSAT rate dropped by 0.3% from 2022 to 2023 and by 4.8% since 2020 based on the report findings because of the increasing number of chats that agents are required to handle per shift. Customer service managers must understand that agents have different skill levels and experience, affecting their chat concurrency limits. Moreover, leveraging AI can help agents focus on improving their CSAT scores. A combination of chatbot and live chat is a smart move for businesses wanting to provide omnichannel customer support.
(Source: Comm100)
Live Chat Statistics: Customer Service Agent
The performance of customer support representatives can be influenced by the number of agents working in a particular shift, the type of communication channels the company uses, and other operational factors. The following live chat support stats explains the average volume of live chats and how first response time affects customer satisfaction (CSAT) rates.

7. A live chat agent has to type 65 to 75 words per minute (WPM) like a professional typist.
Takeaway: Many live chat tools have canned responses and prewritten scripts, as well as artificial intelligence (AI) chatbots for AI-suggested responses. While these tools can help customer service agents save time and effort typing, hiring fast-typing reps can help reduce wait times and increase the average handling time to ensure all inquiries are answered for utmost customer satisfaction.
(Source: LiveChat)
8. A customer service rep can handle about 100 chats daily.
Takeaway: According to this customer service live chat statistics, human chat support agents can handle five chats simultaneously and still remain productive. If you want to determine the number of customer service agents you need, compare data like average handling time from the previous months, the nature of inquiries handled, and other relevant parameters to ensure you have enough agents to assist customers.
(Source: LiveChat)
9. Each chat has an average customer satisfaction rate of 68.3%.
Takeaway: Customer satisfaction in live chat conversations must be rated like phone calls to ensure customers are happy. Hence, like phone calls, a good CSAT score for live chat is between 75% and 85%. However, each industry’s CSAT score varies because of differences in clientele, products, and services. Determine your industry’s CSAT benchmark to align your performance, coaching, and training goals and strategies.
(Source: LiveChat)
Live Chat Statistics: Customer Service Manager
Customer service team managers oversee a customer service team’s operations. They monitor the performance and activities of agents and develop strategies to ensure consistent customer service quality. The following metrics are essential when planning agents’ live chat work and in efforts to improve overall customer service.

10. The average live chat wait time in 2023 is 23 seconds.
Takeaway: Queues are unavoidable, especially when a business has a huge number of customers. With proper agent shift scheduling, reps can significantly reduce the queue time. Moreover, live chat solutions with parallel conversations, canned responses, typing review, and ticket management like Zoho Desk enable users to handle online inquiries promptly.
(Source: Comm100)
11. The average live chat queue dropout rate is 24.9%.
Takeaway: Queue dropout rate measures the percentage of customers that dropped out of the chat queue or missed potential conversations. This happens because there aren’t customer service agents available to help them with their issues. Use this metric to compare your own numbers and keep this number low.
(Source: LiveChat)
12. The average availability of a business is 12 hours and 4 minutes per day.
Takeaway: While businesses aim to make their customer service team available on chat as long as possible, limitations in resources could impede this goal. Chatbots can help you handle common inquiries for you outside of work hours and even 24/7 when there are no agents on duty.
(Source: LiveChat)
Live Chat Statistics: Customer Experience & Preferences
While live chat support offers convenience, discrepancies in the quality of human assistance can lead to dissatisfaction among users. It is important to determine what frustrates customers and what they prefer when it comes to support channels, as well as what other businesses think about customer preferences in the live chat support statistics below.

13. Live chat CSAT rate decreased by 0.3% from 2022 to 2023.
Takeaway: While this data isn’t large, this has been seen as a trend for three years since 2020 with a total of 4.8% drop. This could be attributed to the increase in chats per agent every year since 2020. It’s crucial for any business adopting live chat to ensure they have enough reps to answer queries, especially during peak business hours. Moreover, regular training equips reps with the right, up-to-date information when answering live chats for customer satisfaction.
(Source: Comm100)
14. 94% of customers use mobile devices to chat with businesses.
Takeaway: According to this live chat usage statistics, many customers use their smartphones to reach live chat support. But this communication channel is just one touchpoint. Understanding where most inquiries come from through a live chat software’s analytics and reporting tools is still important. It is an excellent basis for agent training and personalizing sales, marketing, and customer service strategies.
(Source: LiveChat)
15. 95% of consumers value customer support quality over speed.
Takeaway: This trend stresses that while consumers expect instant resolution whenever they use live chat, they don’t want to compromise the quality of customer service they receive. They want to get a satisfactory solution, which currently can only be guaranteed with live chat agents instead of AI-assisted chatbots. Check out our chatbot versus live chat here.
(Source: Kayako)
16. 38% of customers get frustrated with poor user experience.
Takeaway: Customers have poor user experience when live chat is unavailable or is disconnected during a session. Filling up pre-chat forms before starting a live chat also frustrates some customers. Keep these details in mind when developing strategies to streamline and enhance user experience.
(Source: Kayako)
17. 24% of consumers say that their biggest frustration is long wait times.
Takeaway: Long wait times can lead to customer frustration. To address this issue, you have to ensure that you have enough customer service reps to handle live chat inquiries. Also, brainstorm regularly to assess the possible common reasons for lengthy wait times so you can resolve them promptly. For instance, agents might need additional training in answering complicated questions.
(Source: Kayako)
Live Chat Statistics: Industry Breakdown
Industries have varying live chat metrics. The most common ones include wait times, CSAT rate, and percentage of live chats on mobile. Use the live chat stats below as a benchmark to improve your customer service team’s performance.

18. Industries with the shortest wait time are entertainment (1.7 seconds), travel and hospitality (8.7 seconds), and real estate (8.8 seconds).
Takeaway: Meanwhile, the industries with the longest wait time are telecommunications (135.9 seconds), government (55.4 seconds), and technology (47.6 seconds). Knowing this data can help your business align metrics like average handling time (AHT) to industry benchmarks. With canned messaging, automated agent routing, and AI chatbots, customer service reps can reduce customer wait times.
(Source: Comm100)
19. Industries with the highest CSAT rates are real estate (97.7%), construction (93.9%), and insurance (92.2%).
Takeaway: Meanwhile, the industries with the lowest CSAT ratings are transportation (68.6%), banking and finance (76.8%), and technology (77.4%). If you belong in any of these industries, you must review your live chat customer service performance and strategies more frequently to increase your CSAT. Equip your reps with the latest industry trends, including the emerging needs of your customers through surveys. Download our free CSAT survey templates here.
(Source: Comm100)
20. Industries with the longest queue are iGaming or online gambling (216.1) and the government (204.6).
Takeaway: Meanwhile, the industries with the shortest queue in live chat include construction (0), transportation (1), and health, pharma, and biotech (9.3). Identifying the queue volume in your specific industry can inform your customer service management efforts to ensure there are enough reps to handle the queue and avoid long wait times.
(Source: Comm100)
21. Transportation is the industry with the longest chat duration at 23 minutes and 59 seconds.
Takeaway: Identifying your industry’s chat duration involves monitoring how long your reps answer queries via live chat. For instance, if you have three customer service agents, get their average live chat handling time per day. Total the hours or minutes they’re answering inquiries and divide it by the number of inquiries handled. This can help in training live chat agents to address complex issues quickly.
(Source: Comm100)
Frequently Asked Questions
What is the purpose of live chat?
Live chat aims to answer questions and address the requests of leads and customers promptly. This is a self-service option that’s easy to use, eliminating the waiting period of calling a company’s toll-free number and emailing.
How effective is live chat?
Live chat is very effective because many customers prefer engaging with businesses through live chat over other digital communication methods. The features that make live chat effective include artificial intelligence for real-time chats, chat routing, chat transcripts, canned responses, lead profiling, and integrations.
How many live chats can human chat support reps handle per day?
Human chat support reps can handle five chats simultaneously while maintaining their productivity. If you want to know the specific number of customer service reps you need for your small business, just get the average number of chats you manage daily.
Bottom Line
Live chat’s market size demonstrates this business communication tool’s great value to customers and businesses alike, especially to customer service managers and reps who want to improve their performance and service levels. AI-powered live chat tools have robust data analytics for accurate answers to online inquiries and report generation for intelligent decision-making on implementing customer service strategies.