Workforce analytics is the data collection and analysis that businesses use to understand their people (i.e., employees, teams, etc.). It can help your business measure employee performance, engagement, behavior, retention, and overall return on investment (ROI) related to your workforce. With technology, it is easier than ever to gather and crunch big data, simplifying work for managers wanting to make data-based decisions for their company.
Types of Workforce Analytics
All forms of workforce analytics help identify issues and present courses of action to improve business processes. Determining the specific type of analytics you need can help clarify the problem. This targeted approach ensures more relevant and actionable insights, although some complex issues may require more than one solution.
Depending on the purpose and end goal, these can be divided into the following types:
- Descriptive
- Predictive
- Prescriptive
- Diagnostic
Leveraging HRIS and workforce analytics platforms can transform fragmented employee data into a unified hub, making tracking and analyzing your workforce easier. Rippling, for example, brings all employee data (HR, IT, Finance, and third-party systems) into one platform and allows you to access various workforce data, such as turnover rates, labor costs, absenteeism, performance ratings, compensation and benefits, etc.
Descriptive
This data can provide a clear view of your employees’ current state or help you understand a past event. Here are some examples where you can use this:
- Running analytics reports to determine the steps taken when onboarding employees (when the offer letter was sent, how quickly the offer was accepted, how long onboarding took, etc.)
- Conducting a survey to analyze the hiring and onboarding process to find areas for improvement
This can help reduce costs for future hiring decisions by finding ways to expedite the process.
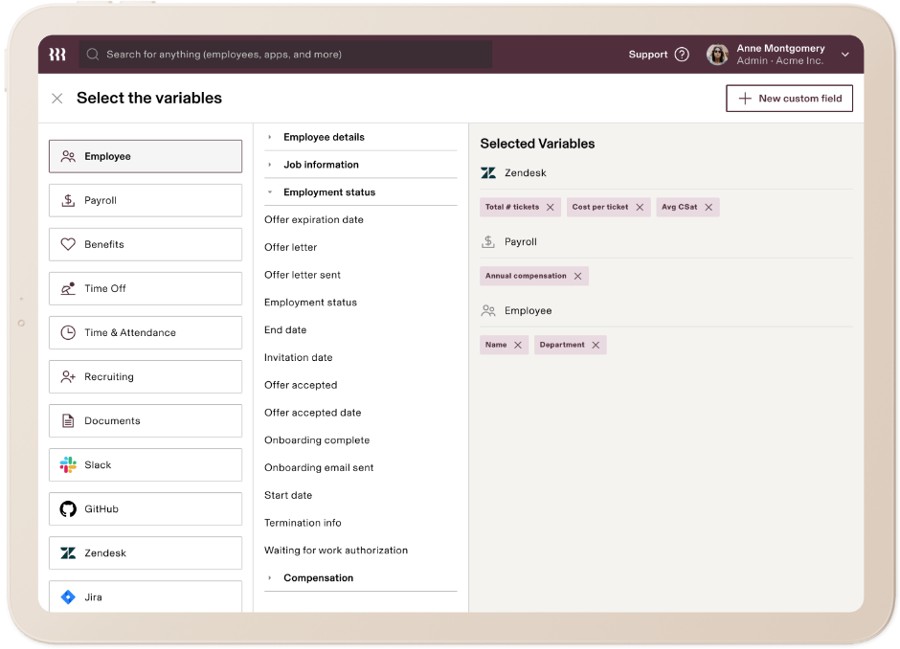
Rippling houses multiple employee variables in one place, allowing you to track and describe the historical and current state of your workforce. (Source: Rippling)
Predictive
This analysis helps you anticipate future outcomes based on current and existing data. For example, a company may run analytics on the number of support tickets plus the per-ticket cost over a period of time. From there, they can predict how much IT helpdesk support they may need based on trends throughout the year, answering questions like, “When do the number of issues peak, and what months are they at their lowest?” and “Is there a trend around when the most complex and costly issues occur, or is it sporadic?”
This data will help users predict the number of support tickets that will be produced and determine areas they can investigate to help them improve support time and potentially decrease their cost per ticket.
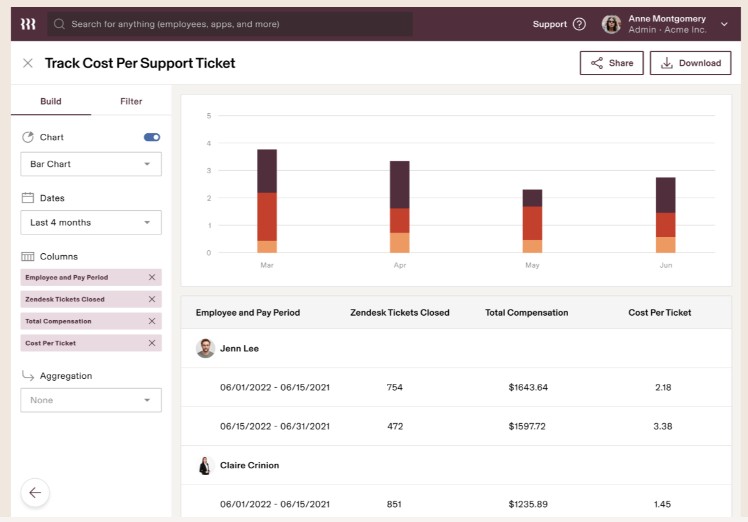
Rippling combines various workforce data points into charts or graphs, enabling more comprehensive predictive models. (Source: Rippling)
Prescriptive
This type of data can help in deciding better courses of action based on past performance. For example, a company can run a report on their target vs actual employee headcount to determine gaps in hiring and which departments have historically lacked necessary employees. Besides the use of software, such a report can be done from an analysis of records and using the results to project the growth within the company and each department. This data, when aligned with KPIs like time-to-hire and quality of hire, can then be used to make better hiring decisions and improve the recruitment process.
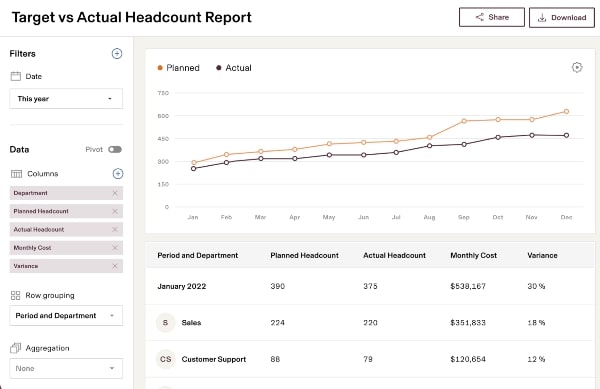
Rippling’s Headcount Planning feature gives you a bird’s-eye view of your workforce headcount (Source: Rippling)
Diagnostic
This type applies to solving specific problems and is used to find the underlying cause and suggest a course of action. For instance, a company with a high turnover rate may use workforce analytics to determine if the problem lies in pay, company policies, managers, or office culture.
A detailed compensation report can help determine where there may be a pay gap within a department or the company as a whole. Company surveys can also determine employee satisfaction, while exit surveys can identify areas where employees may be unhappy. You can use this information to adjust pay to be more competitive with industry standards.
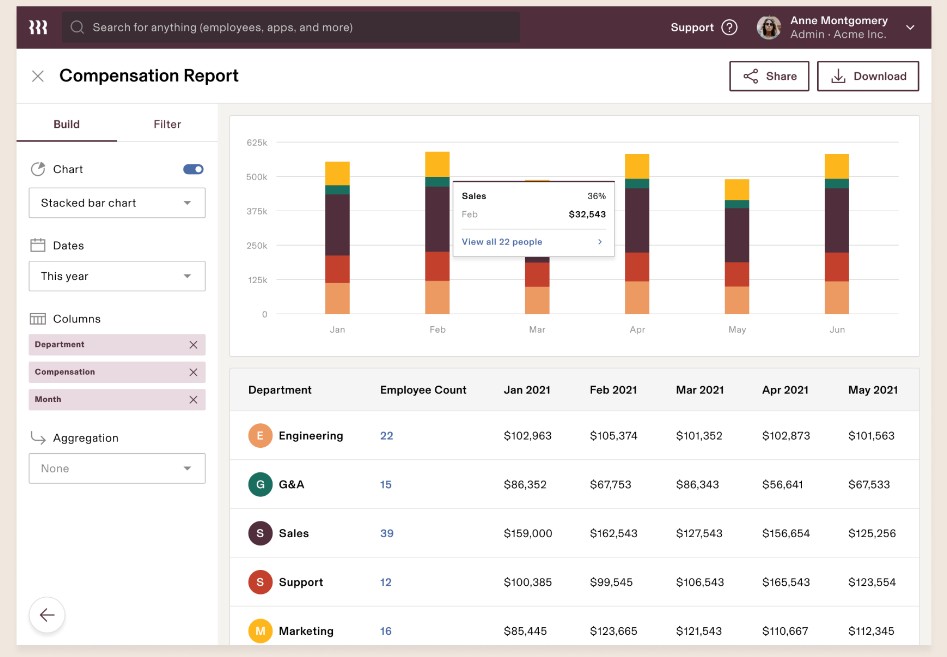
Rippling’s compensation report demonstrates workforce analytics by analyzing pay disparities and compensation trends across different employee groups. (Source: Rippling).
How to Use Workforce Analytics
Much of today’s HR software and workforce management software allows you to collect data on a regular basis. In addition, some HRIS systems, payroll services, and PEO programs come with employee survey data, which employers use every month to check in on worker satisfaction.
Hiring and interview notes, exit surveys, and performance feedback also provide excellent, ongoing data for workforce analytics. Regardless of how and where you get the data, you should have a clear game plan when using workforce analytics.
Identify the Problem
Begin with a clear idea of what problem you are addressing and how you want to solve it. Be specific—for instance, “causes for employee dissatisfaction” is very general, whereas “Why do employees leave after four to seven years?” gives you greater focus.
Determine the Information You Need
You are looking for actionable data—information your business can apply when making a decision. You also need to consider what information you have access to and can gather.
How you define the problem can determine the type of analytics you do. For example:
- Why do they leave? Use exit surveys and interviews to determine a pattern.
- How do we stop them from leaving? Specific questionnaires throughout the life of an employee can help with retention.
- What kind of employees leave after four years? Use hiring notes, personality tests, and manager feedback to determine the types of employees who leave.
- Can we improve retention by doing X? Researching who had the training, support, or promotions in question and whether or not they continued in the company can help determine a path for improved retention.
Set Benchmark Questions & Goals
Determine what your benchmark questions will be to help you gather the data for your overall goal. For example, if your goal is to improve employee retention, you could ask whether a certain action helps retain employees. Does a raise of a minimum percentage motivate employees to stay, or will a flexible schedule promote better retention?
It can also mean getting a certain number or percentage of replies and assessing which responses fall within the different metrics/criteria you use. For example, in the larger analysis of “Why do employees leave,” your benchmarks may include specific lifestyle markers, such as:
- a new baby
- completing an advanced degree
- employee satisfaction at the time of exit
- performance factors, or
- personality types.
To learn more about some of the most common HR workforce data points, check out our list of the most important HR metrics.
Gather & Analyze the Data
When you have identified the problem, gathered the information you need, and established benchmarks, you can determine how to gather and analyze your information. You’ll consider what data you may already have available and what new data you may need.
As we mentioned earlier, your software tools will often have data readily available for you. Other data you already have may come from previous survey results, resumes and personality assessments, company goals and key performance indicators (KPIs), etc.
If you need new information to make the best, most informed decision, consider new team surveys or adding new questions or areas of discussion to your performance review process. ClickUp is a cost-effective tool for running frequent informal surveys—check out our detailed ClickUp review to learn how its customizable forms and workflow automation can transform your feedback collection.
Benefits of Workforce Analytics
Workforce analytics can help lead to actionable changes that make a difference. Even for small businesses, data-driven insights can reveal opportunities to boost productivity and employee satisfaction.
While an investment, they can save you time, money, and headaches down the line.
For example, the Workforce Institute’s 2024 Retention Report found that the majority of reasons for employee turnover are preventable, and it cost companies nearly $900 million just to replace employees who quit in 2023. By monitoring workforce analytics, however, businesses can discover patterns and trends in employee performance or skills gaps. These insights can directly create targeted action plans, such as designing engagement initiatives to address low morale or creating development courses to enhance specific competencies identified as lacking across the team.
Learn how to accurately calculate, track, and analyze employee turnover rates to make data-driven decisions that boost retention and protect your bottom line. Read our step-by-step guide on how to calculate employee turnover.
The proper use of workforce analytics can:
- Improve Hiring: With analysis, you can determine the best types of employees for your business and what factors you should look for in recruiting and interviewing. Additionally, you can determine which of your company’s values and cultural aspects attract the best candidates (a 2024 survey shows that a company’s values, mission, and history are what candidates look for when accepting a job offer).
- Manage Employees: Managers can encourage traits that high-performers have in common and determine what keeps them loyal to the company. Analytics can be used to find a correlation between training and performance and improve company policies. According to a study, the lack of proper training is listed as one of the top reasons employees become dissatisfied with their positions.
- Organize Roles: Analytics can be used to determine roles within your organization. For example, you may find that three employees are doing different parts of the same task and getting in one another’s way. To ease the situation, you could reshuffle the project to one employee, whether an existing worker or a new hire.
- Engage Employees: Analysis of how engaged your employees are can give you insight into how you can improve the office culture and encourage collaboration. It will enable you to keep morale high in stressful seasons. According to the same Work Institute retention report mentioned above, when employees have a higher rating of their supervisors and managers, they stay longer with an organization.
- Reduce Employee Churn: Workforce analytics can give you insight into why employees leave. Knowing the metrics around employee satisfaction can help your business devise a plan to reduce turnover.
Workforce Analytics vs HR Analytics
Workforce analytics and HR analytics are different, although connected. Workforce analytics focuses primarily on people data (though there is a growing trend to include robotic workers in these assessments), while HR analytics is broader and can include procedures, operations, or strategies.
Here’s a table that shows some of their key differences:
Workforce Analytics | HR Analytics | |
|---|---|---|
Scope | Entire workforce, including contractors | Primarily HR processes and employees |
Focus | Overall organizational performance | HR function efficiency and effectiveness |
Data Sources | CRM, project management, CRM platforms, employee surveys, social media, time tracking, payroll, HRIS data, etc. | HRIS, ATS, payroll, etc. |
Primary Users | Executives and managers across departments | HR professionals, talent acquisition managers |
Key Metrics | Productivity, revenue per employee, skills gaps | Employee demographics, recruitment metrics, retention rate, attrition |
Strategic Impact | Directly informs business strategy | Primarily influences HR strategy |
Time Frame | Often future-focused and predictive | Typically historical and future-focused |
Analysis Depth | Deep-dive into workforce trends and patterns | Focused on HR process improvements |
Tools Used | Advanced analytics platforms, AI/machine learning | HR-specific specific analytic tools, HRIS reports |
Outcome | Business performance improvement | Enhances HR experience and optimizes HR function |
Despite their differences, workforce and HR analytics share several similarities. Both rely on data-driven approaches to gain insights into employee-related aspects of the organization. Both utilize similar tools and technologies for data collection, analysis, and visualization. Additionally, both often overlap in their focus on key areas, such as employee engagement, performance, and retention.
Workforce Analytics Frequently Asked Questions (FAQs)
Popular tools for workforce analytics include specialized HR analytics software, data visualization tools, and HRIS and ATS systems with built-in analytics features. The choice of tools often depends on the size of the organization, its needs, and its existing technology infrastructure.
Some of the common challenges include:
- Data quality and integration issues
- Privacy and ethical concerns
- Lack of analytical skills within HR teams
- Resistance to data-driven decision making
- Difficulty in measuring ROI of analytical initiatives.
Overcoming these challenges often requires a combination of technological solutions and organizational change management.
The exact ROI varies by organization and often manifests in multiple areas. For small business owners (even if they use basic tools like spreadsheets), the returns can show up in practical ways, like reducing costly turnover through smart hiring decisions and preventing over- or understaffing through data-driven scheduling. These insights lead to tangible savings in training costs and improved employee retention.


