





Short-term financing, often referred to as buy now, pay later (BNPL) or customer financing, lets consumers pay for purchases over time through a series of installments. It is also one of the most prominent trends in the retail market. Where financing used to be popular only for large purchases like furniture and cars, consumers now use it for everyday purchases—thanks to BNPL services like Klarna, PayPal, and Afterpay.
This article looks at 28 BNPL statistics and trends that will help your business understand how consumers use the service and how you can capitalize on its popularity.
The BNPL Landscape
First, let’s take a look at the big-picture buy now, pay later statistics to get a sense of the customer financing landscape.
1. The number of global BNPL users is set to grow to 900 million by 2027
According to Juniper Research, the 360 million global BNPL users in 2022 is expected to grow to more than 900 million by 2027. Juniper attributes this increase to an anticipated economic downturn and the proliferation of virtual credit cards, among other reasons.
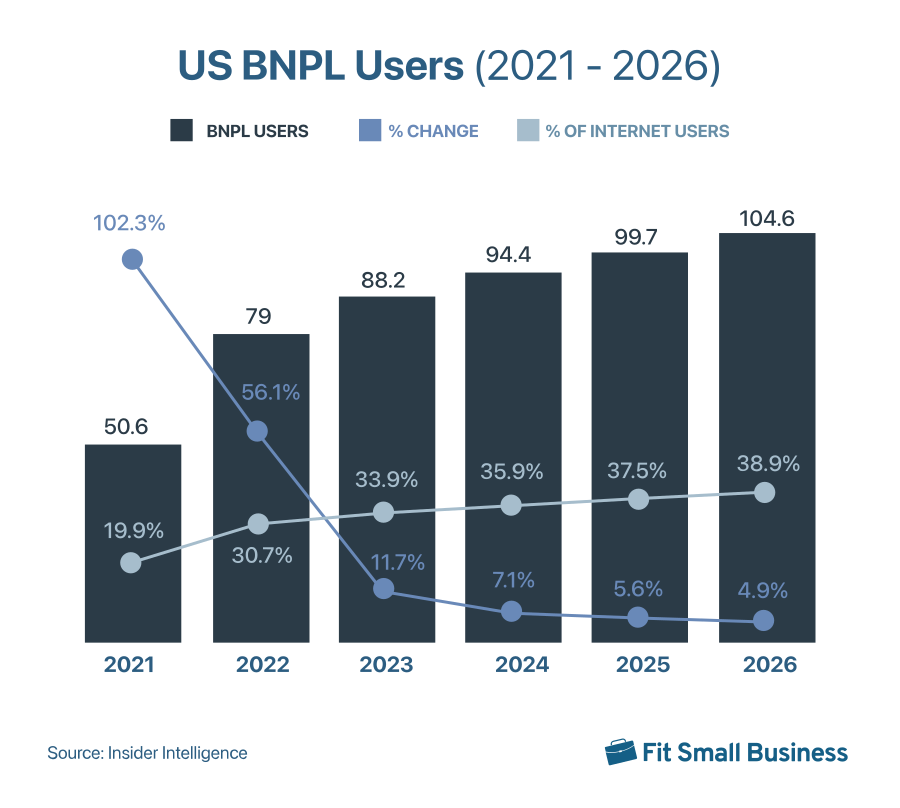
2. The number of US BNPL users will exceed 94 million in 2024 and 100 million in 2026
The number of BNPL users in the United States is also growing, in line with global levels. In fact, the 50 million buy now, pay later users America had in 2021 is set to exceed 94 million by the end of 2024, with a 7.1% year-over-year growth from 2023.
3. BNPL payment volume to grow nearly 20% from 2022 to 2023
According to a new report on the buy now, pay later market size, US BNPL payment volumes are forecast to hit $71.9 billion in 2023. This represents a 19.7% annual increase from 2022.
4. The BNPL market value is set to grow at a CAGR of 25.5% through 2026
According to findings from Global Data, the BNPL market size will be valued at $309.2 billion in 2023 and will continue to grow at a compound annual growth rate (CAGR) of 25.5% through 2026.
5. US BNPL transaction value will grow at a 14.8% annual rate from 2023 through 2027
In a study from Insider Intelligence, they forecast that the BNPL market value for the US will grow by 14.8% annually from 2023 to 2027. Among Klarna, Afterpay, Zip, and Affirm, that means that their BNPL transaction value will have grown from $48.88 billion in 2023 to over $81 billion in 2027.
BNPL Customers
With a picture of what the BNPL landscape looks like from a bird’s eye view, let’s now look at buy now, pay later statistics that give you a sense of the consumers taking advantage of BNPL financing.
6. 50% of US consumers have used BNPL services
BNPL is a fast-growing payment option with half the US population having used BNPL services by the end of 2022. This is a significant increase over 2020 when only 37.7% of American consumers had utilized BNPL services.
7. 17% of consumers have used BNPL in the last twelve months
In a survey looking at consumer behaviors, the Consumer Financial Protection Bureau found that 17% of consumers had used BNPL service during the twelve-month period between February 2021 and February 2022.
8. US and European shoppers make up the largest share of the BNPL market
Across the world, the United States and Europe are the highest BNPL spenders. According to findings from Global Data, 40% of BNPL’s transaction value comes from North Americans and 30% comes from Europeans.
9. Women are more likely to use BNPL services than men
While both men and women use BNPL services, women use them more commonly. According to new data, 20% of women have borrowed money using BNPL and only 14% of men have done so.
10. Black and Hispanic consumers are more likely to use BNPL
Along with gender, there is also a disparity in BNPL use between races. The Consumer Financial Protection Bureau found that 26% of black consumers have used BNPL services compared to 16% of white and that 24% of Hispanic consumers have financed purchases via BNPL compared to 15% of non-Hispanic shoppers.
11. Millennials are the most prolific BNPL users
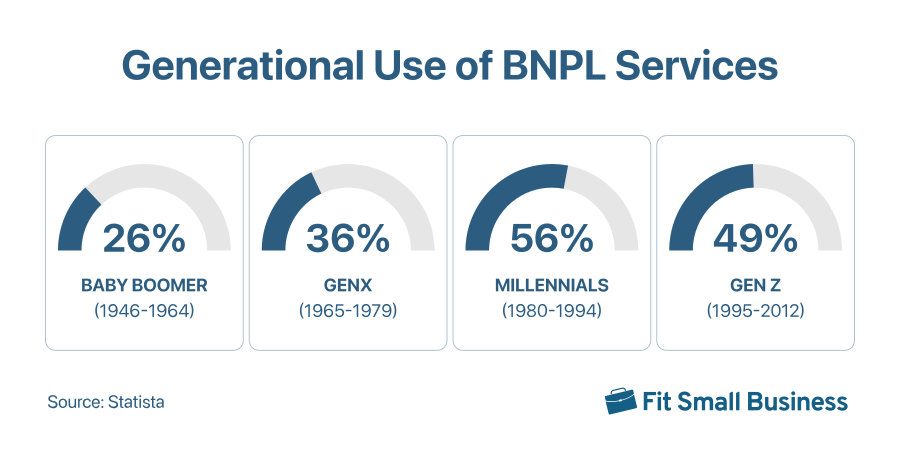
So we know that there are gender and race-based BNPL usage trends, but what about generational? As you might have suspected, there certainly are—and millennials are leading the way. According to findings from Statista, 56% of millennials use BNPL services, more so than any generation, even Gen X (49%).
12. 40% of BNPL users belong to the 25-34 years-old age group
With 56% of millennials admitting to having used BNPL services, it is no shock that a huge number of BNPL users fall within their age range. In fact, 40% of BNPL users are between the ages of 25 to 34—right in that millennial range.
13. BNPL is most popular with consumers that make $20k-$50k annually
There is also a trend on socio-economic circumstances and BNPL use—The Consumer Financial Bureau found that BNPL is most prevalent among consumers with an annual income between $20,000 and $50,000, with 21% of the demographic having made a BNPL purchase in the last 12 months. Not only that, BNPL use is least popular among consumers with annual income above $200,000, with only a 9% use rate in the last 12 months.
14. Two-thirds of BNPL users think the service could replace credit cards
A study from The Ascent found that 62% of BNPL users think that BNPL services could replace traditional credit cards in the coming years. This is mainly due to the services’ growing ubiquity and ease of use. It is important to note, however, that while two-thirds of users foresee this shift from credit cards, only about a third want to see it happen.
15. Making purchases that don’t fit their budget is the top reason consumers use BNPL services
Forty-eight percent of BNPL users say that they use the service to make purchases that won’t otherwise be feasible. Other reasons consumers use BNPL include:
- Avoid credit card interest (33%)
- Borrow without a credit check (24%)
- Can’t get approved for credit card (15%)
- Don’t like credit cards (15%)
16. People use BNPL services more than credit cards
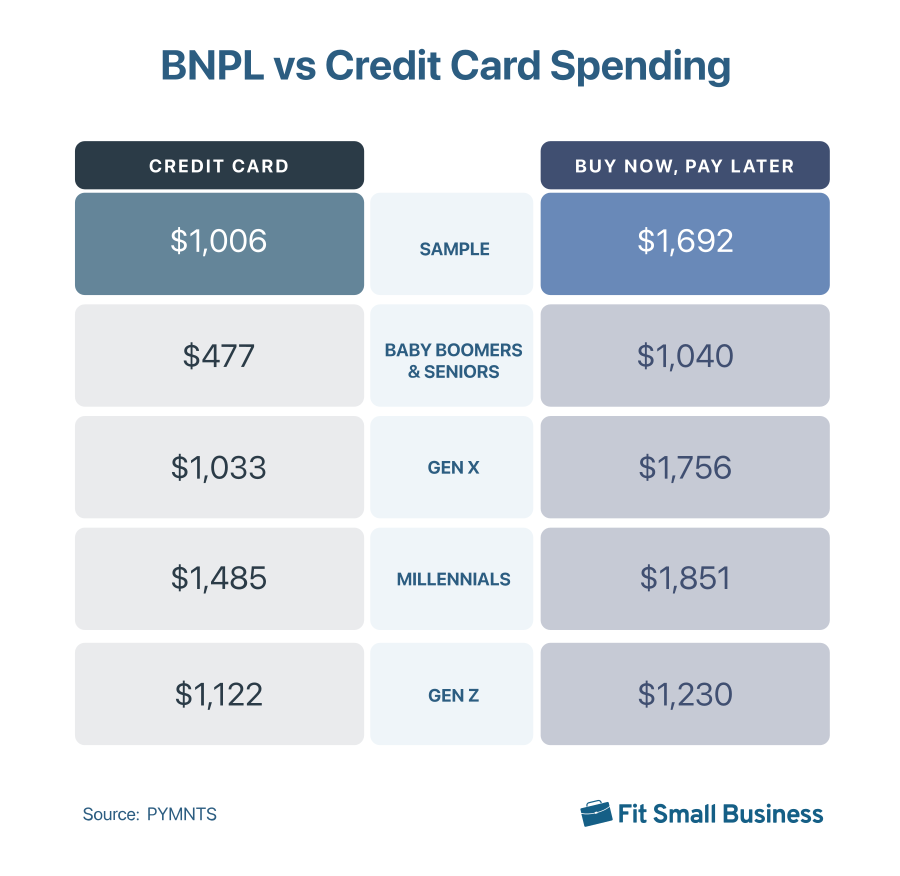
In March of 2023, a PYMNTS survey found that people spent more via BNPL than they did via credit cards IN A 90-DAY PERIOD – nearly $700 more. Across generations, people spent an average of $1,006 on their credit cards and $1,692 via BNPL services. You can see the generational breakdown of BNPL versus credit card spending below:
17. More than a quarter of BNPL users have missed a payment
While there are ways to put your loan installments on autopay and transparency in plan terms upon purchase, over a quarter (26%) of BNPL customers admit that they have had a late or missed payment.
18. Only 50% of BNPL users are very confident they can pay off their loan on schedule
Lending Tree found that even though most people get approved for BNPL loans, only 50% of them are “very confident” they will be able to pay off their loan on the designated schedule. Not only that, 4% are somewhat or very unconfident they will be able to pay on time.
19. 32% of shoppers use BNPL at least once a month
Along with overall use, the frequency with which consumers use BNPL services is also increasing. In fact, The Ascent study found that 32% of BNPL customers use the services once a month or more, with 5% using it more than once a week.
20. The average user has taken out over $2,000 in BNPL loans
Over the course of all BNPL purchases, consumers have borrowed an average of $2,085.
BNLP Industry Trends
Finally, we will end with buy now pay later statistics that look at trends within the industry. Think provider insights, loan types, what people are buying, and more that will help you understand the BNPL landscape and how you can capitalize upon it.
21. Klarna is the most popular BNPL service
Of the top BNPL providers, the most commonly used option is Klarna, with over 150,000,000 active users, 500,000+ merchants, and more than 2 million daily transactions.
22. The most common use of BNPL loans is to buy clothing items
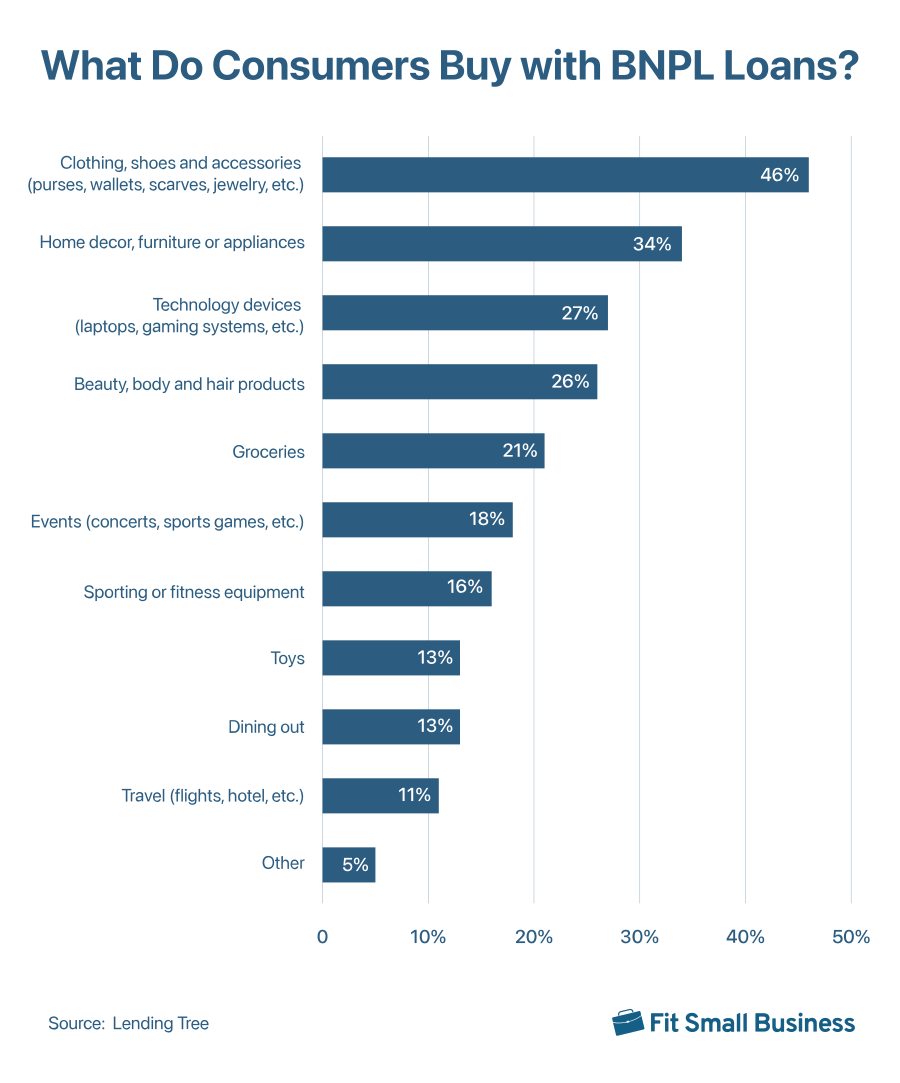
While you might have assumed that BNPL would be most commonly used for major purchases like travel or home improvement projects, the top BNPL spending category is actually apparel. In a survey from Lending Tree, they asked what people had bought with their BNPL loans over the past 12 months, and 46% of respondents said clothes, followed by home decor and furnishings (34%), and technology devices (27%).
23. The average BNPL loan is $135
Another unsuspecting stat. You might have assumed that people would use customer financing on large purchases exclusively, but the average BNPL loan is only $135. While this seems low, the average BNPL purchase amount actually grew 11.6% from $121 in 2020.
24. Businesses that offer BNPL saw a 2% increase in converted visits YoY
While businesses that offered BNPL services in 2022 saw a 2% increase in converted visits compared to 2021, businesses that did not offer customer financing saw an 11% drop in their converted visits.
25. BNPL has the largest impact on driving electronics sales
BNPL had the biggest impact in the consumer electronics category, with 26.7% of consumers using BNPL on technology purchases declaring they would not have bought the products without a financing option.
26. BNPL apps saw a 200% YoY growth in monthly active users
The number of active monthly users on Android and iOS BNPL apps* grew by nearly 200% between 2021 and 2022. In numbers that looks like 5.7 million active monthly users in February of 2021 to 11.2 active monthly users per month in January of 2022.
27. BNPL is set to be used for more than 5% of ecommerce transactions by 2025
The use of BNPL for online purchases is increasing globally. In 2021, BNPL accounted for 2.9% of e-commerce’s total transaction value, and by 2025 BNPL’s share is expected to nearly double to 5.3%.
28. BNPL is increasingly common for in-store purchases
While BNPL only accounted for 0.8% of 2021’s total POS transaction value, its share is projected to double to 1.6% by 2025, or upward of $940 billion globally. In the US, BNPL is anticipated to account for more than 2% of POS transaction value in 2025, and, in Europe, its POS transaction share is expected to hit 2.8% in the same year.
BNPL Frequently Asked Questions (FAQs)
Click through the questions below to get answers to some of your most frequently asked buy now, pay later questions.
How do you businesses add BNPL to checkout?
You can add a BNPL option to your checkout by signing up for a BNPL provider that is compatible with your ecommerce site and POS system, and then integrating it into your checkout both in-store and online.
Does BNPL cost money to offer?
While there are no monthly fees, you will have to pay your BNPL provider in processing fees. Warning, these fees are much higher than typical in-person and online processing rates—but these are generally worth it for the boost in conversion rates that BNPL offerings typically yield.
Do people like BNPL?
While there is still some skepticism and occasional frustration among BNPL users, people generally like to see a BNPL option, and offering customer financing has been shown to boost conversion rates.
What is the best BNPL service for small businesses?
All the major BNPL providers are good options, but the best BNPL service for small businesses is Klarna because of the variety of financing options it has for customers and the protections, tools, and rates they have for merchants.
Bottom Line
As we have seen throughout this article, the uptick of BNPL services is one of the biggest trends in the modern retail market. To stay competitive, examine the data above and consider incorporating a BNPL service into your business. Learn more about offering BNPL and customer financing to your shoppers by reading our guide.
