By performing a rental market analysis (RMA), investors gain valuable insights into a property’s income potential. An RMA involves in-depth research on comparable rental properties—scrutinizing local amenities and calculating formulas that include average rental rates. This meticulous examination of data reveals whether a property is likely to generate positive or negative cash flow and aids in investment decisions.
What Is a Rental Market Analysis (RMA) & Why Use It?
A rental market analysis (RMA) is a rental market forecast that evaluates specific criteria to help you determine the rental potential of a specific area and property. It involves examining factors that influence the rental market, such as property location, size, condition, amenities, etc. This data is subject to constant fluctuations, so it’s important for investors to conduct frequent RMAs in order to stay abreast of the ever-changing real estate market.

One of the purposes of an RMA is to help real estate investors determine whether a property is worth purchasing based on its potential rental income. Additionally, an RMA assists in setting the optimal rental price in a competitive market. This ensures that landlords maximize returns and make informed decisions when their property has a vacancy.
An RMA can be used to help real estate professionals in the following ways:
- Establishes competitive rental rates, reducing property vacancy.
- Optimizes property features and amenities to cater to tenant demands, enhancing property appeal.
- Assesses potential property profitability through cash flow projections, aiding in identifying lucrative investment opportunities aligned with financial goals.
- Maximizes rental income by staying informed about market trends and price fluctuations, enabling informed decisions regarding rent adjustments and lease renewals.
- Evaluate the income potential of potential property purchases within the local rental market, aiding in investment viability assessments.
- Empowers real estate agents and brokers with valuable insights to offer clients, enhancing their ability to provide guidance and assistance in buying or selling rental properties.
6 Steps for Performing a Rental Market Analysis
Completing a comprehensive rental market analysis involves a sequential process comprised of six distinct steps. These steps serve as a roadmap for gathering data, conducting analyses, and drawing meaningful conclusions about the rental market. By progressing through each step, property investors can expect to emerge with an understanding of the rental landscape and current rental rates within their chosen area.
1. Define Your Rental Objectives & Select Your Research Resources
Before embarking on a rent analysis, it’s important to define your rental objectives clearly. Are you seeking maximum profitability, aiming to assess potential investment opportunities, or evaluating the ongoing performance of your current rental property portfolio? These objectives will serve as a guiding compass to direct the rental rate analysis toward uncovering specific information to meet your objectives.
Once your rental objectives are established, investors must carefully select their research resources. The quality and reliability of your data sources can significantly impact the accuracy and effectiveness of your RMA. Reliable real estate websites, local listings, and market reports will be your primary sources of information. Leveraging a combination of these resources provides a well-rounded perspective that can strengthen the foundation of your rental analysis.
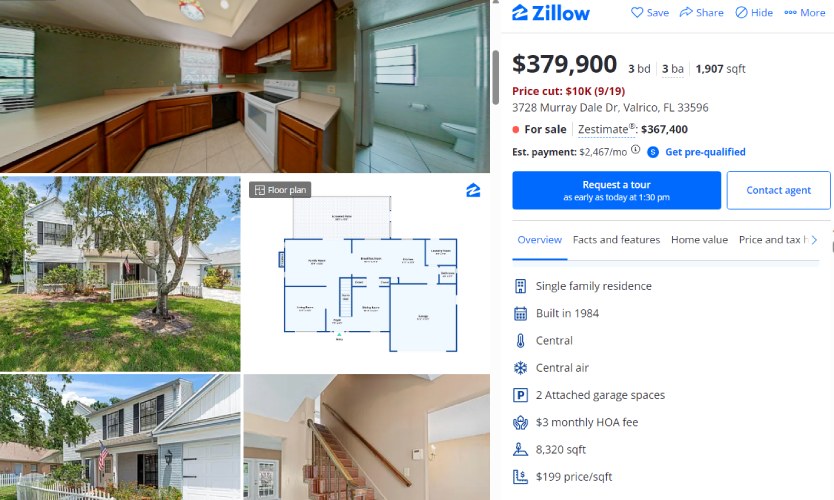
Detailed property information (Source: Zillow)
If you’re working with a real estate agent, they can provide access to the multiple listing service (MLS) that houses the property data for all properties currently on the market, pending, and rented. Many popular real estate listing websites, like Zillow and Realtor.com, offer valuable rental property details like square footage, lot size, and property features.
2. Collect Comprehensive Property Information on the Subject Property
Gathering comprehensive property information is the foundation of a thorough rent analysis. This initial step involves collecting a wealth of data related to the subject property, which is the property you’re analyzing, whether that is a potential purchase, recently purchased, or owned property. You’ll need details about its size, layout, amenities, condition, and historical rental income.
The data collected must also be effectively organized to be useful. By inputting the collected data into a spreadsheet, you create a central repository that houses all the essential information in an organized and easily accessible format.
Download the RMA spreadsheet provided below for seamless data collection and efficient calculations.
Thank you for downloading!
In addition to information about property size, condition, and amenities, you can gather the following relevant data for the property in question:
- Utility information: Details about utilities, including heating and cooling systems, energy efficiency, and utility costs.
- Parking: Information on parking options (e.g., whether there is on-site parking, a garage, or street parking).
- Appliances: The presence and condition of appliances, such as a refrigerator, stove, dishwasher, and washer/dryer.
- Flooring and finishes: The type and condition of flooring, as well as the quality of finishes, impact a property’s visual appeal.
- Outdoor space: Properties with outdoor spaces like patios, balconies, or gardens are often more attractive to tenants, especially in certain markets.
- Security features: Features like a security system, gated access, or secure entry can enhance tenant safety and comfort.
- Pet-friendliness: Policies regarding pets can influence a property’s marketability.
- Public transportation: Proximity to public transportation options, such as bus stops or subway stations, can be a significant selling point, particularly in urban areas.
- Neighborhood amenities: Access to nearby amenities like grocery stores, restaurants, parks, and entertainment venues can affect a property’s marketability and rental price.
3. Assess the Surrounding Neighborhood
The surrounding neighborhood of a property provides information about how well your property would resonate with prospective renters. Factors such as the quality of schools, safety, nearby parks, recreational areas, and the overall sense of community play a pivotal role in shaping a tenant’s decision. Understanding these neighborhood attributes allows property owners and investors to position their rental property prices more effectively in the market.
Some of the most important factors to consider when assessing the neighborhood:

While a neighborhood alone doesn’t determine rental price, it does give a perspective on whether you’re able to attract responsible and quality renters. Investors can focus on gathering data that gives insight into property appreciation, tenant demographics, and rental demand within a neighborhood. This information can help you make more informed decisions about property acquisition in a specific area.
4. Gather Data on Comparable Properties
Identifying and gathering data on comparable properties in a rent analysis is crucial for understanding how your property compares to the current rental market. These comparable properties serve as benchmarks for evaluating the subject property’s rental potential.

Seek properties that closely resemble the subject property in terms of size, condition, and amenities. Focus on listings that are currently available or have been recently rented in the same neighborhood. Here are items to look out for:
- Proximity to each other: In an urban area, they should be within a three-block radius. On the other hand, properties in a suburban area should be within a couple of miles, and rural areas may be even further away.
- Square footage: All properties should be within a couple of hundred square feet in size.
- Rent price: Although you may not have the final calculations for your rent price yet, find properties for rent in a similar price range that you are expecting to charge.
- Number of bedrooms: Must be the same in all comps; don’t compare a one-bedroom with a two-bedroom.
- Number of bathrooms: Should be similar, although you can compare two and 2.5 bathrooms.
- Lot size: This is an important factor for single-family homes in particular.
- Condition: Needs to fall in the same category, such as updated, original, distressed, etc.
- Amenities: Similar amenities in the unit and building; if not, then you can adjust for them.
- Days on market (DOM): If a property has been sitting on the market for over 60 days, then it may be priced too high or have some type of flaw. You can generally adjust the price down by about 5%, depending on the reason the DOM is so high.
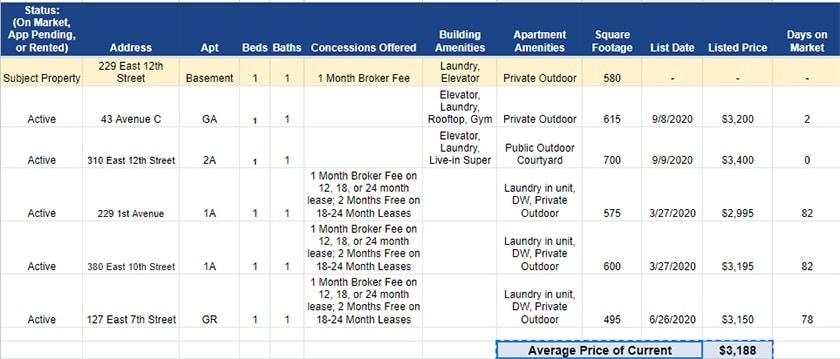
All the data points collected on your property in step two should be the same data points you collect on comparable properties. This will make it easier to do a side-by-side comparison of your subject property in relation to the comparable properties.
5. Perform Necessary Calculations
Once you’ve collected data on the subject property and comparable rentals, it’s time to perform essential calculations. With data already organized within a spreadsheet, you can input the necessary figures into formulas and equations to derive the results.
One of the main calculations performed should be calculating the average rental price for the comparable properties. This establishes a baseline of rent in the neighborhood. Additionally, consider various expenses, including property taxes, maintenance costs, and potential vacancies, to determine the property’s potential cash flow.
Press the arrow to review the following calculations that will provide critical insights into the property’s financial viability:
Since each investor’s objectives and circumstances are unique, it’s essential to acknowledge that the ideal numbers for these equations will vary accordingly. For investors with larger portfolios, it can be especially helpful to evaluate these numbers in the context of your current portfolio. This assessment allows you to determine if the performance of new or prospective properties aligns with your established investment strategy and broader financial goals.
6. Analyze the Price of Properties & Make Informed Decisions
The final step in the apartment rental market analysis process is to make informed decisions based on the insights gathered. If you’re using an RMA to purchase a new property, consider rental potential but also take into account the purchase price against the broader real estate market. If the purchase price of a property is significantly higher than what you can reasonably expect to generate in rental income, it may not align with your investment goals.
On the contrary, an abundance of low-priced properties in a particular area should also raise concern. For example, if there’s a surplus of similar properties for sale in close proximity, it may indicate a potential oversupply in the rental market. This oversaturation can lead to longer vacancy periods and financial challenges due to carrying costs without rental income.
For a rent market analysis used in the determination of the optimal rental rate for your property, property owners can strike a balance between attracting tenants and ensuring profitability. Setting the right rental rate in line with the comparable properties on the market is a strategic move that impacts your investment’s success. By aligning your rental rate with the prevailing market conditions, you make your property more competitive, attracting potential tenants with a fair pricing structure.
Frequently Asked Questions (FAQs)
By conducting an RMA, you gain valuable insights into comparable homes in your area. This can help you identify features and amenities that are in high demand among tenants. This information allows you to make informed decisions about potential improvements or upgrades to your property to meet the expectations of your target renters.
Additionally, the RMA provides a clear picture of the current rental market landscape, including the rental rates of similar properties. This data enables you to determine your property’s most competitive and attractive rent price. Setting the right rent rate is crucial for not only attracting new tenants but also retaining existing ones, which is essential for maintaining a stable rental income stream.
The answer to how often you need to perform an RMA depends on various factors, like the market’s volatility, the stability of your rental properties, and your investment objectives. In dynamic markets or when considering new acquisitions, more frequent RMAs may be necessary. However, stable properties in less volatile markets may require less frequent analysis. As a general guideline, conducting an RMA annually is a good starting point, but investors may adjust the frequency based on changing circumstances.
The data from an RMA can be valuable to a range of stakeholders in the real estate and property management industry. This includes property investors, landlords, property managers, real estate agents, brokers, and even tenants. Investors and landlords can use the data to make informed decisions about property acquisitions, pricing, and property management strategies. Property managers can utilize the insights to optimize rental income and property performance. Real estate agents and brokers can offer valuable market insights to their clients.
Even tenants can benefit from understanding local market conditions when negotiating leases or evaluating rental options. In essence, anyone involved in rental property transactions or management can leverage data from an RMA to enhance their decision-making processes.
Bottom Line
Conducting a thorough rental market analysis helps property managers and investors seeking to make informed decisions to be competitive in the rental property market. By considering factors such as location, size, amenities, condition, and days on market, you can accurately assess rental potential and establish competitive rental rates. These factors collectively contribute to a comprehensive understanding of the local rental landscape, enabling you to set the right rental prices, make profitable property investments, and optimize property performance.