The state of the call center in 2024 is all about the increasing expectations for a seamless customer service experience. Companies are putting more emphasis on customer satisfaction (CSAT), improving agent efficiency metrics, and driving deeper customer insights. To help you redefine your call center strategy, here are 14 statistics exploring call center metrics on customer experience, agent productivity, and call initiation.
Customer Experience Metrics Statistics
Businesses rely more than ever on key performance indicators (KPIs) to gain insights into whether they are providing the support customers need. The following statistics reveal how call centers are utilizing customer experience metrics to examine the quality of their interactions.
1. For CSAT, most companies aim for 80% & above
(Source: Call Centre Helper)
CSAT is an important call center key performance indicator (KPI) that reflects customers’ satisfaction with the support they receive. While CSAT scores vary across industries, call centers today typically aim for a score of 80% and above, equivalent to a 4 out of 5 rating or higher. The increasing standard for CSAT reveals how call centers are willing to go above and beyond to satisfy their customers with the level of service they offer.
2. 11.4% of companies cite video as the top interaction channel for customer satisfaction
(Source: Metrigy)
In the age of multichannel interactions, a growing number of companies identify video as the leading channel for delivering customer satisfaction (CS). The highest percentage goes to voice, with 73.1%, followed by self-service (21%) and live chat (16.8%). The same study also revealed how companies with above-average success metric improvements are more likely to embrace visual engagement to connect with customers.
3. CSAT remains the most important metric for almost 75% of customer service leaders
(Source: HubSpot)
CSAT remains one of the most widely used call center metrics to track feedback surveys, serving as a key tool for assessing the performance of customer service teams. It was followed by speed of resolution, which also saw a large increase at 38%. This reveals how call centers are targeting service KPIs to assess customer retention and identify areas for improvement in service delivery.
4. 25% of companies measure CSAT results at least once a month
(Source: Deloitte)
A study by Deloitte highlighted that the more often companies analyze CSAT data, the better the satisfaction of customers and employees. However, only 22% of companies analyze CSAT survey results at least once a day, while 13% do it once a week. The study recommends analyzing CSAT more than monthly to reach higher CS through platforms that support real-time data analysis—capturing trends better.
5. Only 14% of companies measure customer effort score
(Source: Deloitte)
Customer effort score (CES) measures how much effort customers put in to get their queries resolved. While it has emerged as a critical KPI for analyzing CS, it is the least used metric across many industries. CSAT has the highest percentage at 53%, followed by the net promoter score (NPS) at 49%.
Besides CSAT, businesses ought to take advantage of different call center performance metrics, such as CES, NPS, and first contact resolution (FCR), to gain further insights into the different aspects of customer interactions.

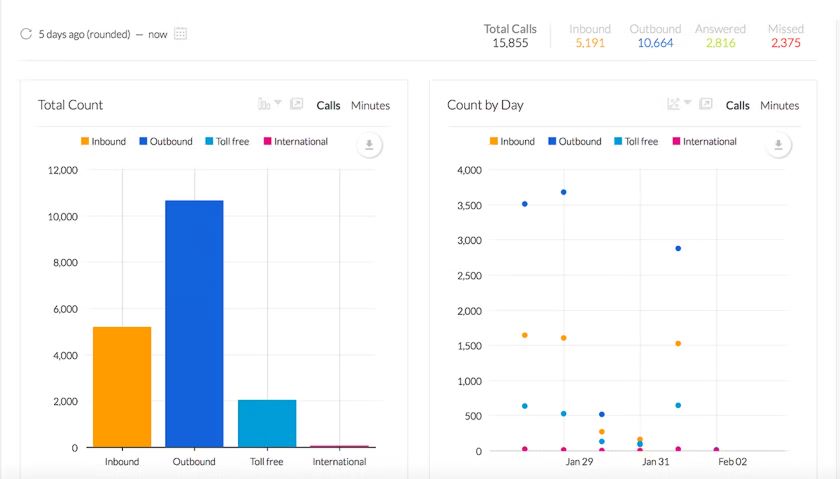
Nextiva offers a real-time overview of call activities across your company. (Source: Nextiva)
Nextiva is a customer experience management software that lets you visually access and control call data through dashboards, wallboards, and customizable call center reporting tools. Historical data are plotted in tables and easy-to-read graphs, and data-driven analytics let you predict future call trends. Read our Nextiva Contact Center Review for a more comprehensive look at this provider.
Agent Performance Metrics Statistics
Agent performance metrics track and measure agents’ efficiency in handling calls, including the speed of response and how well they address inquiries. Below are contact center statistics that illustrate how well agents perform across different call center metrics examples.
6. The average talk time was 2.6 minutes was in 2023
(Source: Ozonetel)
Average talk time (ATT) refers to the amount of time an agent spends talking to a customer over a call. Talk times have significantly decreased since 2019, averaging 4.3 minutes. This is mainly due to the increasing adoption of artificial intelligence (AI) tools (e.g., smart assistants) and third-party integrations, allowing agents to provide fast and accurate answers to customer inquiries.
7. The average speed of answer was 6.9 seconds in 2023
(Source: Ozonetel)
Average speed of answer (ASA) refers to the average time it takes an agent to answer the phone after a call is routed to them. In the last five years, ASA averaged between six to eight seconds. However, high ASA rates may imply that the call center is not giving agents enough time for their after-call work. This can be remedied by using call center systems that automate the call summary process so agents can easily move forward from one call to another.
8. The average time in queue was 69.4 seconds in 2023
(Source: Ozonetel)
This call center KPI refers to the amount of time a caller spends waiting in the call queue before they speak with an agent. Over the past three years, the average time in queue was noticeably increasing. For instance, 2021 recorded an average of 44.6 seconds, which increased to 56 seconds in 2022.
There are ways to improve the average time on queue, including automating after-call work, creating more self-service options, and configuring call queue settings.
9. The average wrap-up time was 43.6 seconds in 2023
(Source: Ozonetel)
Also known as after-call work, the average wrap-up time is the period when the agent attends to call-related tasks following the end of a call. The industry standard for wrap-up time ranges from one to two minutes. However, with the development of various automation tools, agents are now able to streamline post-call admin tasks like note-taking and order processing.
10. Quality of service was the most frequently used KPI for measuring agent performance in 2022
(Source: Deloitte)
For most call centers, providing personalized service is more important for determining customer satisfaction than the time it takes to resolve an issue. Even though efficiency is still important for most customers, many are shifting their focus toward getting personalized service, directly impacting customer satisfaction.
Integrating your call center system with your customer relationship management (CRM) system is critical in facilitating personalized service delivery. Third-party integrations allow seamless access to customer records within the CRM system. When a customer calls, the agent can tailor their interactions by accessing the caller’s information, including recent purchases, previous conversations, and account profiles.

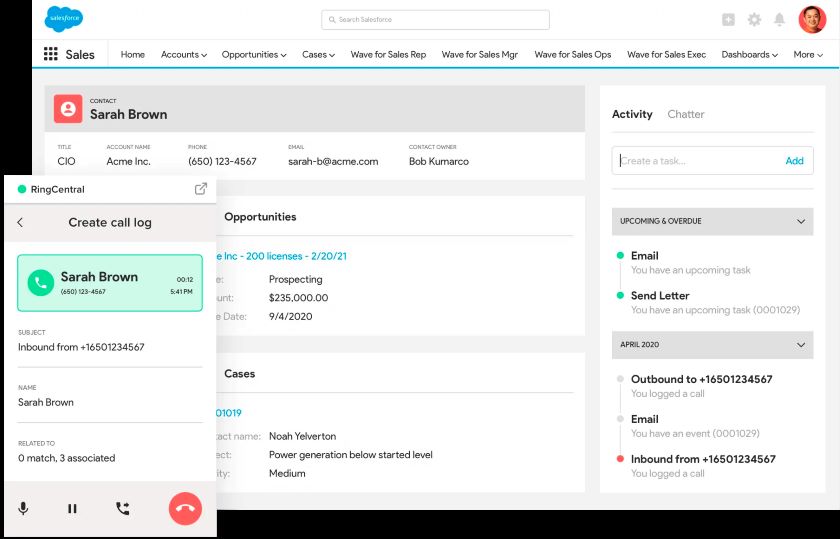
With the RingCentral and Salesforce integration, you can make calls directly from the Salesforce platform. (Source: RingCentral)
RingCentral is a voice-over-internet-protocol (VoIP) phone system provider with over 300 third-party integrations, including popular CRM apps. This allows you to initiate and receive calls directly from your CRM and retrieve the caller’s account history without switching between apps. It has powerful analytics with intuitive graphical dashboards and predefined templates. For more on RingCentral’s offerings, check out our RingCentral Contact Center review.
Call Initiation Metrics Statistics
The perception of customers toward your business is significantly influenced once they initiate contact with your call center. Factors such as wait times and the ability of the agents to address the issue promptly contribute to forming a good first impression. Take a look at the top statistics on call initiation metrics.
11. The government/public sector has the highest average abandonment rate at 7.44%
(Source: Talkdesk)
Abandonment rate is the percentage of callers who hang up before reaching a live agent. Average rates vary depending on the industry, call reason, and business type. The industry standard for call abandonment rate is 6%, but the acceptable rate can be between 5% and 10%. To reduce your call abandonment rate, consider offering a callback option, optimizing staffing levels, and introducing more self-service options.
12. The transportation & logistics industries have the highest average hold time of 5.52 seconds
(Source: Talkdesk)
This call center KPI measures the average time agents put callers on hold during a call. Across call center industries, transportation, healthcare, and hospitality have the longest average hold time. Typically, a longer hold time may be the result of a complex customer inquiry, requiring the agent to take longer to search for a solution or transfer the call.
13. There is a difference in CSAT & FCR for customers who are put on hold than for those who are not
(Source: SQM)
When callers are put on hold, CSAT is 13% lower, and FCR is 16% lower than when callers are not put on hold. In fact, callers prefer a live hold, where they can talk to the agent anytime instead of being on mute and not talking to the agent entirely. Another finding is that the average handle time (AHT) is shorter with a live hold than with a mute hold. This is because a live hold gives the agent a sense of urgency to resolve the call.
14. 45% of companies use service level agreement to measure individual & team performance
(Source: Deloitte)
Service level agreement (SLA) refers to a call center’s ability to answer a certain number of calls in a given time frame. In a study by Deloitte, SLA comes in at the third spot as the commonly used metric to gauge employee performance. Monitoring the service level helps manage customer expectations, particularly how easy it is for customers to get through.

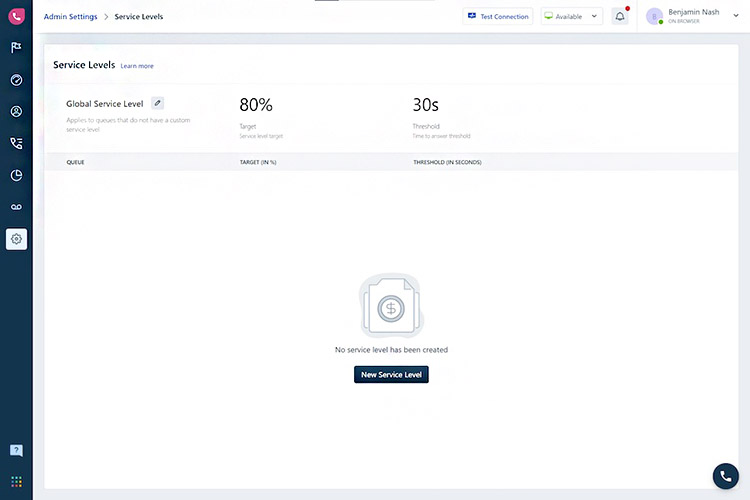
Freshdesk Contact Center lets you set a target service level within a given period. (Source: Freshdesk)
Freshdesk is a call center software with various analytics tools for monitoring customer experience, quality of conversations, and team performance. You can configure your account’s service level by setting the target percentage and the expected threshold time.
Frequently Asked Questions (FAQs)
Analytics and reporting are essential tools that help call centers generate actionable insights into daily call activities. Analytics involves tracking contact center performance metrics based on call data and agent activities, while call center reporting converts raw data into simplified summaries, such as graphs and charts.
There are various strategic approaches on how to improve call center metrics. These include providing agent training, investing in the right call center software, and conducting regular data analysis. Training opportunities equip agents with the right skill set and knowledge to deliver better customer service, while regular monitoring of data using a call center solution enables supervisors to find areas of improvement and identify key trends.
There may be overlap in the metrics used for inbound and outbound call centers, but the analysis of call data varies based on their objectives. For example, inbound call centers typically focus on customer experience metrics, such as AHT, FCR, and CSAT. Outbound call centers, on the other hand, pay attention to sales-related metrics like dialing efficiency, calls per hour, and conversion rate.
Bottom Line
Learning about the recent trends in call center metrics helps in evaluating the performance of your call center operations. At the same time, this provides you with a clear understanding of how each call center metric contributes to the effectiveness of your overall customer service. If you want to discover new business opportunities, make sure to use the right call center phone system to uncover key insights and tailor your services accordingly.