


Call center reporting transforms raw data collected from call center activities into insightful summaries. Data points are categorized based on key performance indicators (KPIs) and organized into different visual elements, such as graphs or charts. These reports help call center managers monitor agent performance, evaluate the quality of customer service, and make informed decisions to optimize call center processes.
How Call Center Reporting Works
Call center reporting works as part of a call center phone system that sources and converts raw data derived from different business phone features. These include automatic call distributors (ACDs), interactive voice response (IVR) systems, and workforce management (WFM) systems. While creating the reports, the call center software uses formulas for calculating each metric.
From there, it will be automatically compiled and organized in charts or graphs based on the established KPIs. Often, information is displayed on a live dashboard to track key metrics in real time. To ensure everyone stays informed, reports may be delivered across the company in various formats, such as wallboards, email, or data-driven notifications.
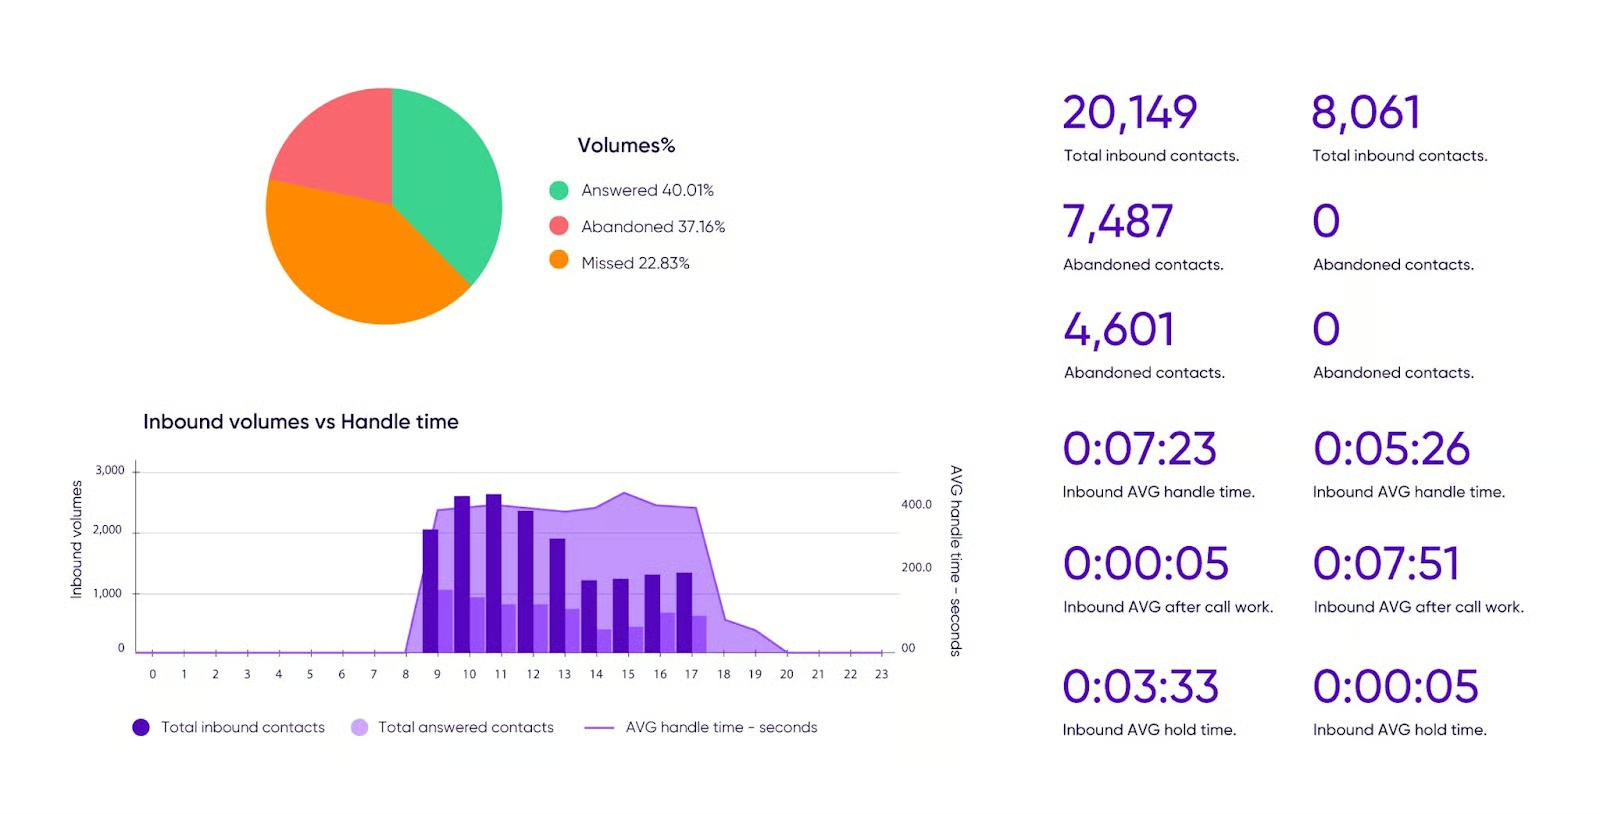
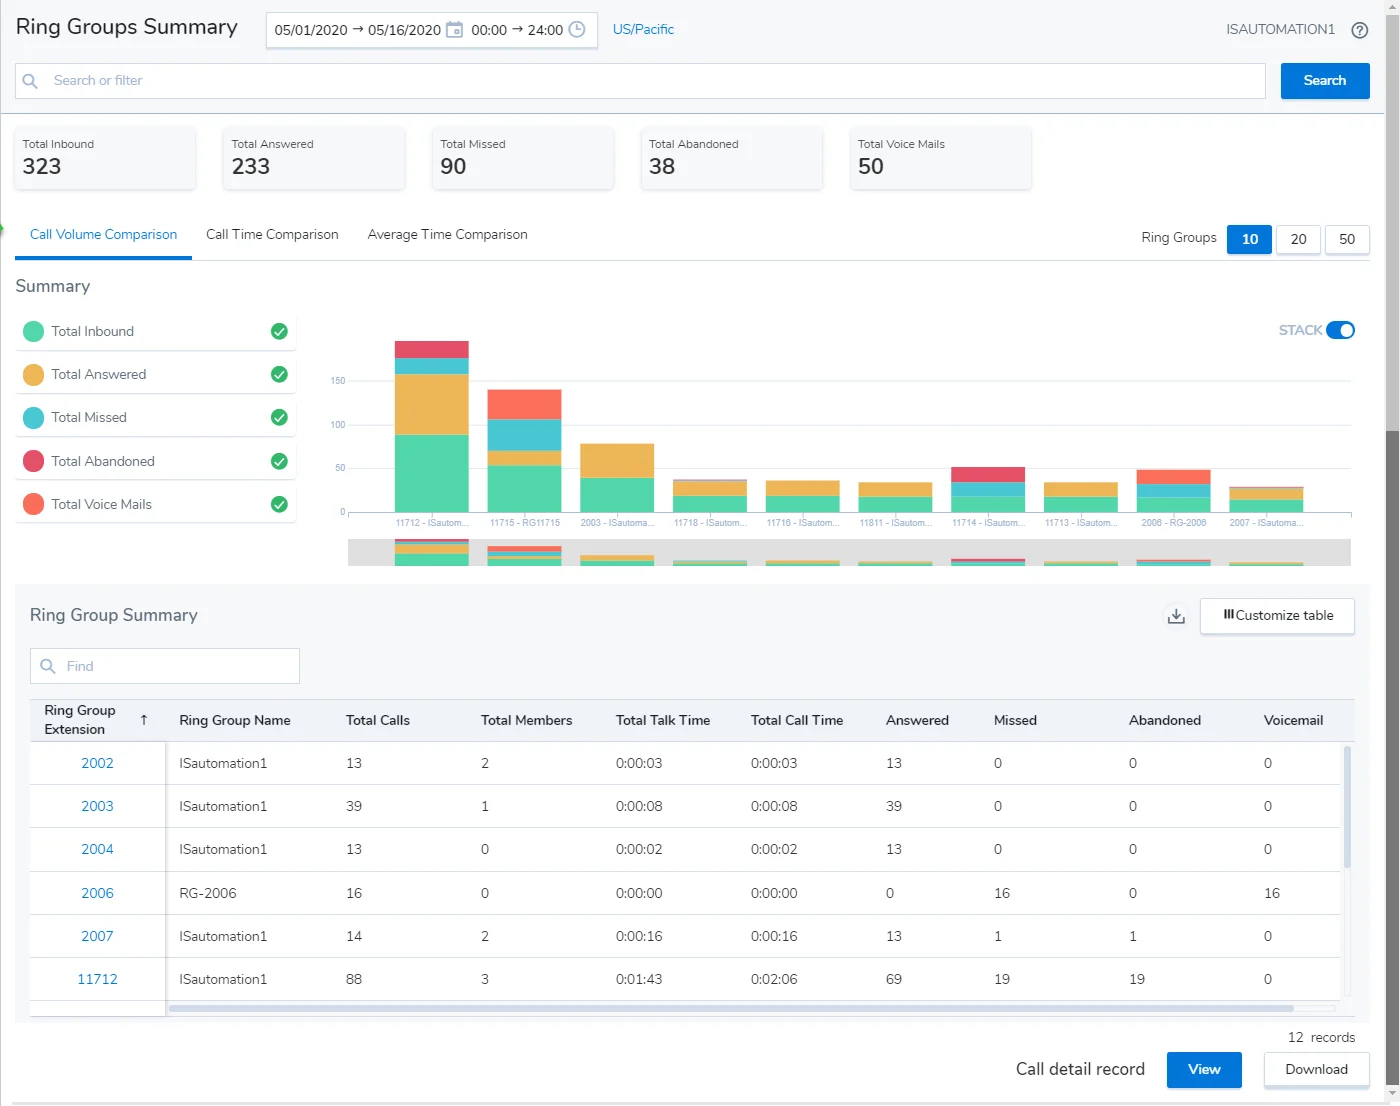
Here’s an example of call center reporting from one of our top recommended contact center solutions, Talkdesk. Talkdesk utilizes artificial intelligence (AI) for data mining and making data visualization easier. The image below shows a real-time dashboard that offers visibility on specific metrics, including average hold time, total answered calls, and abandoned contacts.
Below are standard call center reporting metrics. Check out our guide about the call center metrics and KPIs for the full list.
- First contact resolution: Measures the agent’s ability to address a customer’s query during the first call.
- Average handle time (AHT): Calculates the average duration an agent spends to complete a call transaction from the initial contact until the final solution.
- Call abandonment rate: The rate of callers who disconnect or hang up before speaking to a live agent.
- Call arrival rate: The percentage of incoming calls a call center receives within a given time period.
- Service level: Measures the rate of calls answered in a target time threshold.
- Customer satisfaction (CSAT): Determines how satisfied your callers are after interacting with your call center.
Top Providers With Call Center Reporting
Most call center software systems have analytics and reporting capabilities. Some include robust customization features through wallboard views, templates, alerts, and predefined dashboards. Here are the top call center providers with reporting and analytics tools:

RingCentral, the leading business phone system provider, offers a contact center solution with smart routing, enhanced self-service, and agent assistance. Among competitors, this provider has the most comprehensive analytics tools, including prebuilt reports, surveys, dashboards, and business intelligence integrations. With omnichannel analytics, you get a full view of the customer journey and agent performance across channels.
Check out our RingCentral Contact review to explore its features and determine if it suits your call center needs.

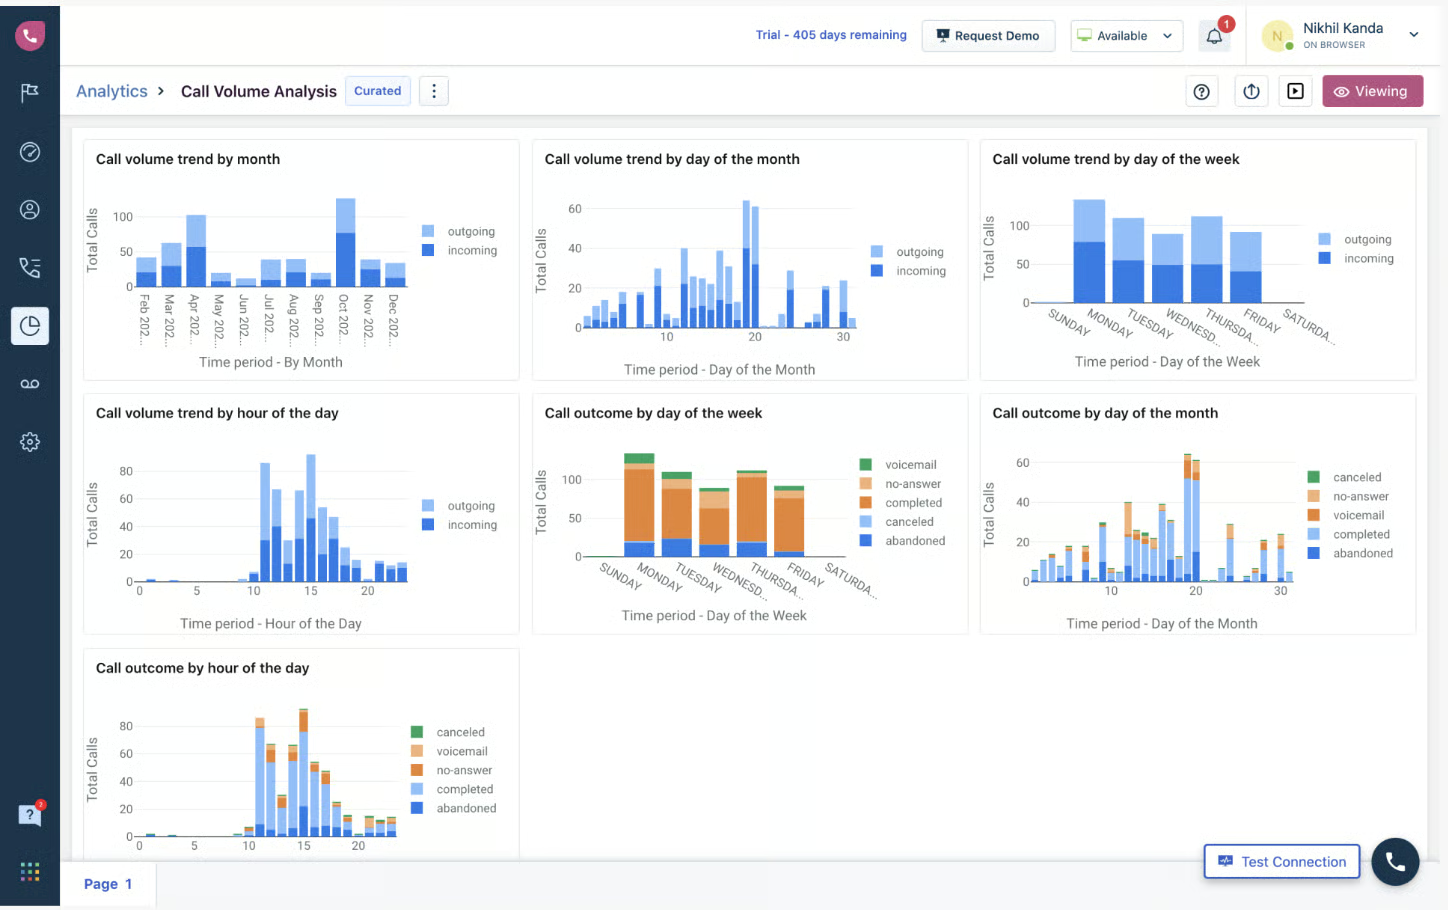
Freshdesk is a budget-friendly call center solution with prebuilt reports for call summary, agent performance, and call volume analysis. A free version is available for a maximum of 2 agents, while paid plans start at $18 per user, monthly. It includes a custom report builder that lets you utilize call metrics and convert them into data sets for analysis. Add filters to your data for easy viewing and schedule reports to be delivered to your work email.
Visit our full Freshdesk review for more information about its features, pricing, and customer support.

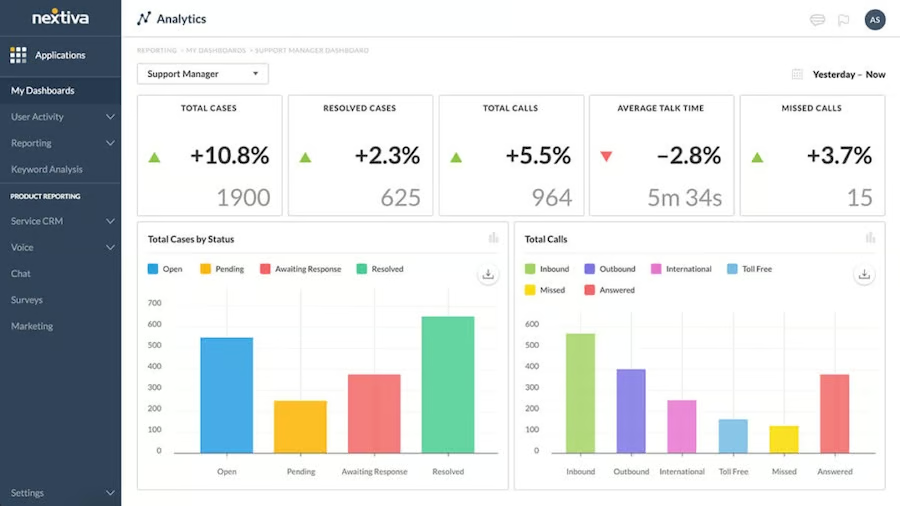
Nextiva Contact Center is a blended contact center as a solution (CCaaS) that enables teams to move quickly between inbound and outbound communication within any channel. It integrates with a customer engagement solution that lets you automate actions and monitor sentiment changes. Configurable reports let you display important call data and save them for future viewing.
In our Nextiva Contact Center review, we explore its potential use cases, feature inclusions, and ease of use.

8×8 is a unified communications (UC) platform that lets you easily scale into a full contact center solution. Contact center plans start at $85 per user, monthly, which includes advanced reporting and call activity analytics. Reports are exportable into a spreadsheet file for archiving. There are four types of reports: agent status, agent interactions summary, queue interactions, and detailed reports. Set alerts on the dashboard when a particular metric requires attention.
Call Center Reporting vs Analytics
Call center analytics and reporting are used almost interchangeably, but each has distinct functions. Reporting converts raw data into simplified summaries for easy metrics tracking, while analytics refers to identifying data trends and patterns to make improvements. Here is a detailed overview of the difference between contact center reporting and analytics:
| Reporting | Analytics | |
|---|---|---|
| Objective | Helps understand key indicators and shows if a metric is up or down | Shows why you’re encountering specific issues or results |
| Function | Raw data is compiled and organized | Identifies trends and patterns in the data presented |
| Output | Graphical data representation (e.g., charts, graphs, tables) | Actionable insights and suggestions for improvement |
Reporting is the initial step in understanding the performance and efficiency of your entire operation. It provides an overview of the data extracted from your call center activities. Analytics, in turn, determines which areas you need to fix and improve. For instance, reports show that your agent team has a low CSAT rate, while analytics help you understand why this occurred so you can make necessary adjustments.
Types of Call Center Reports
Dealing with large amounts of data from your call center software can be overwhelming with all the metrics and KPIs to monitor. To quickly identify which metrics align with your business needs, call center reports are classified into three categories: agent-related, call-center-related, and customer-related. Below we discuss each type in detail.
Agent-related Reports
As the name implies, agent-related reports consist of data evaluating agent performance. Here are some common agent-related call center reports:
- Agent status report: Also known as agent availability report, it displays the agent’s name, user IDs, and ACD status (available, break, idle, or signed out). It helps in measuring schedule adherence.
- Agent call report: Often presented by call type, this outlines all the information from the calls handled by agents. Along with the activity report, it measures the agent utilization rate.
- Agent call by skill report: Shows the number of calls handled by agents at different skill levels. This is used to optimize the skills-based routing system.
- Agent call detail report: Lists all the key details of every inbound and outbound call, including the call duration and the time the call was placed.
- Agent activity report: Summarizes the number of calls handled, average handle time, total handle time for the calls, and shortest and longest handling time.
- Agent summary report: Breaks down agents’ time and corresponding activities. This shows how long they are online, in the queue, and off the queue. Similar to the agent status report, it evaluates an agent’s schedule adherence.
- Agent disposition code report: Summarizes all the disposition codes or call tags agents used for calls. Call tags include the call’s general description, such as “interested,” “appointment scheduled,” and “abandoned in a queue.” It is used for monitoring call outcomes and improving call campaign lists.
Call Center-related Reports
These reports include data that measure the overall performance of your call center. Here are examples of call center-related reports:
- Call direction report: Shows the volume of inbound and outbound calls across a channel over a certain period. This reveals the demand for your call center and helps forecast staffing requirements.
- Service level agreement (SLA) report: Evaluates how well a call center accommodates callers. This helps managers identify SLA breaches and adjust workflows accordingly.
- Call center health report: Outlines the call center’s overall performance within a given period. It shows the total number of incoming calls, outgoing calls, total transfers, missed calls, missed transfers, and abandoned calls.
Customer-related Reports
Customer-related reports use real-time or historical data related to customer experience. Here are examples of customer-related reports:
- First contact resolution (FCR) report: Shows the number of calls resolved during the first interaction with an agent. High FCR rates relate to better customer experience.
- Average wait time report: Measures the average time a call stays in the queue before an agent answers. Longer wait time translates to poor customer experience.
- Call abandon report: Displays the rate of abandoned inbound calls and the time before disconnecting. A high percentage of abandoned calls points to frustration among customers.
Benefits of Call Center Reporting
Contact center reporting improves customer service by providing information about customer sentiment and demands. For instance, when you look at the net promoter score (NPS) and average wait time, you’ll instantly determine if customers are satisfied with the support or response they received. This information makes it easier to develop steps for improvement.
Aside from better customer service, your business benefits from call center reporting in these aspects:
- Improves agent performance: KPIs in agent-related reports evaluate team performance in terms of handling customer queries. This allows you to monitor them in real time, give timely feedback, and provide relevant training to enhance agent skills.
- Reduces costs: Competent, well-trained agents are productive during calls, reducing the need to add more staff to accommodate demand. Monitoring cost-related KPIs, including the cost per call and average handle time, helps allocate resources better.
- Enhances call center efficiency: As agents become more productive at dealing with various call types, it will positively affect the overall efficiency of your call center. Call center reporting offers insights into the performance of your ACD and IVR, specifically on whether they’re correctly routing callers to the right agent or department.
- Better customer experience: Customer-related reports help measure customer satisfaction and sentiment through phone interactions and post-call surveys. Gathering feedback lets you spot service inefficiencies, improve complaint response, and find ways to serve customers better.
Call Center Reporting Best Practices
The key to utilizing call center analysis reports is to follow the best practices. Here are some recommended action points when evaluating what’s happening with your contact center:
- Prioritize the most critical metrics: With an overwhelming number of call center metrics, it’s important to focus on which ones to monitor based on your business goals. For example, if you’re evaluating customer satisfaction, the metrics you should consider first are contact resolution, call abandonment rate, and net promoter score.
- Set measurable goals: KPIs tell how your company is performing and if it’s on the right track to achieve its goals. When looking at reports, look at the figures and see how they fare in relation to the company goals you want to achieve for a specific period. With call center reporting tools to monitor your team’s progress, it will be easier to optimize your strategies and reach benchmarks.
- Refer to industry standards: It’s difficult to make sense of the figures on your call center platform if you don’t have a point of reference. Be aware of the industry standards for different metrics. For instance, the FCR rate should be between 70% and 75%, the average speed of the answer should be at least 28 seconds, and AHT should be around six minutes.
- Find a user-friendly call center platform: Your call center platform should be easy to use, especially for new agents. The best call center platforms provide the following reporting features, such as an intuitive interface, custom dashboards, prebuilt reports, and interactive data visualizations (e.g., graphs, tables, and charts).
Frequently Asked Questions (FAQs)
What is a call center dashboard?
A call center dashboard displays different call center reporting metrics in charts, graphs, and tables. With the data laid out in visual elements, it’s easy for managers to track specific metrics and evaluate progress.
What is the difference between dashboards & wallboards?
Both dashboards and wallboards are visual displays of data and showcase real-time information on performance metrics and KPIs. However, dashboards are designed for personal use and contain more detailed information, while wallboards are often broadcasted on a big screen for large teams and contain KPI widgets.
What are the types of call center analytics?
These are four common approaches to analyzing call center data:
- Speech analytics: Uses algorithms to analyze sentiment and evaluate customer emotion and satisfaction.
- Performance analytics: Displays agent-related reports to allow managers to identify training gaps and opportunities and process inefficiencies.
- Post-call surveys: Offers insights about how customers felt about their most recent contact with your business.
- Predictive analysis: Uses historical data to forecast trends on staffing needs.
Bottom Line
Call center reporting is essential to companies wanting to ensure the success of their contact center operations. When managed well, the data provides opportunities for enhanced agent productivity, customer service success, and cost optimization. With a good call center solution, you can make effective data-driven decisions and empower your teams toward achieving strategic goals.