Microsoft Excel is an incredibly powerful tool for accountants, especially when it comes to handling complex calculations that most bookkeeping software can’t. While I wouldn’t suggest relying on Excel as your main bookkeeping system, it’s perfect for filling in gaps where your primary tool might fall short, like with reconciliations and specialized calculations.
In this guide, I’ll walk you through ways to use Excel to boost your accounting work. Plus, you’ll find templates for bank reconciliation, invoice tracking, bill tracking, loan amortization, and a general ledger—all designed to help streamline and support your processes.
Using Excel to Reconcile Bank Accounts
Bank reconciliation is crucial for ensuring your bank and book balances align accurately. Often, timing differences cause discrepancies, meaning your bank statement and accounting records won’t always match up. While many accounting software options include reconciliation tools, these are often reserved for premium versions.
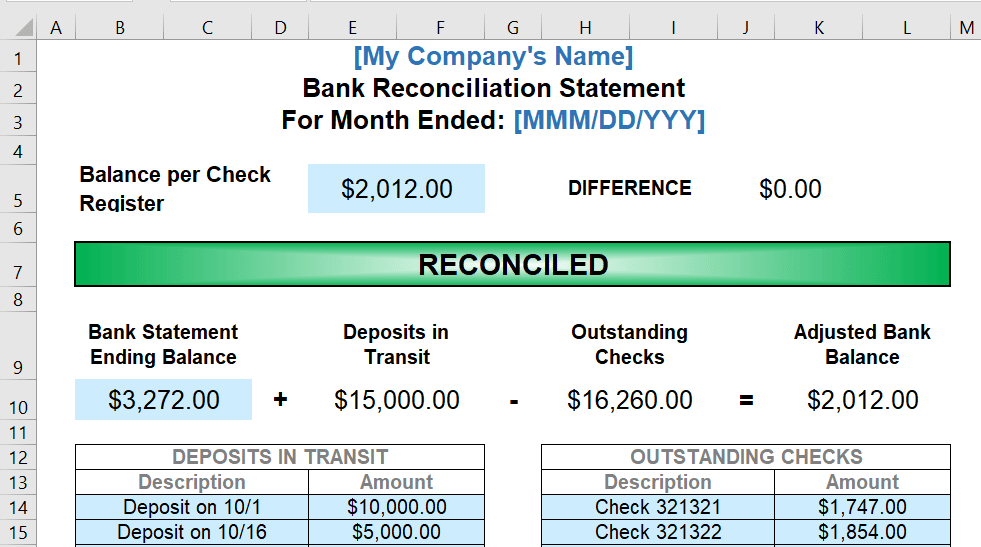
I created a template to help you manually reconcile bank accounts, especially for those using free accounting software that may lack a bank reconciliation feature. With this file, you can easily reconcile your check register and bank statement balances by accounting for deposits in transit and outstanding checks, making it a simple and accessible tool for managing your accounts effectively.
To prevent any problems with Excel formulas in the sheet, you only need to fill out boxes in blue. Gather the following information:
- Balance per check register (tip: update first your check register before reconciliation)
- Bank statement ending balance
- Deposits in transit, which are deposits you’ve recorded in your check register that aren’t shown on the bank statement
- Outstanding checks, which are checks recorded in your check register that aren’t shown on your bank statement
The template matches the adjusted bank balance with the balance per check register. If it’s not equal, the template will show you the difference. Once reconciled, you’ll see the word “RECONCILED.”
Using Excel to Track Unpaid Invoices (A/R)
An A/R aging report is used by many businesses that invoice their clients to keep track of what payments are due to them. It shows when payments are owed, the amount due, and from which customer. It serves as an effective way to forecast cash flow and know exactly how much you’re owed at any given time.
I created a pivot table template to help you track invoices effectively. However, from my experience, using Excel for A/R tracking works best if you have only a few clients. If you’re managing over 30 clients, I recommend moving away from Excel, as keeping up with a larger client base can be challenging due to Excel’s limited automation capabilities. You may want to consider using one of the best free invoice generators, which automates the invoicing process.
After downloading the template, go directly to the CustomerList sheet. Replace all the information in the sheet with your actual customers. Once done, go to the InvoiceData sheet.
Items you can delete and replace with actual data in the InvoiceData sheet:
- Invoice Number
- Invoice Date
- Status
- Company Name
- Invoice Total
The Customer Name and Days Overdue columns cannot be replaced and deleted—these cells contain the formulas. After updating the sheet, go to the Customer Tracker or A/R Aging sheets. Right-click on the table, and click Refresh to reflect your changes.
Using Excel to Track Unpaid Bills (A/P)
Tracking how much money is owed to vendors, when the bills are due, and when they have been paid is known as A/P. If you aren’t diligent with paying your vendors on time, you can end up with bad credit and a lack of supplies, among other things. Creating an A/P aging report in Excel will help you monitor your payable accounts to know which bills you must pay first and how behind you are on past-due accounts.
I created a dynamic A/P tracker using pivot tables, similar to the A/R tracker. With this setup, you can easily keep track of suppliers and due dates using Excel’s built-in filters and sorting functions, making it straightforward to manage your A/P.
After downloading the template, go directly to the VendorList sheet. Replace all the information in the sheet with actual vendors, then go to the BillData sheet.
Items you can delete and replace with actual data in the BillData sheet:
- Bill Number
- Bill Date
- Status
- Vendor Company Name
- Bill Total
Using Excel to Track Cost of Goods Sold
The main challenge of inventory accounting is determining the cost of inventory on hand at the end of the year versus the cost of inventory sold during the year, also known as the cost of goods sold (COGS). Tracking COGS is crucial in determining net income. With the COGS tracker I designed, you can compute the most recent COGS balance of a particular inventory item and determine individual inventory gross profits or cost per unit.
The computation of inventory ending balance and COGS depends on whether you’re using the average cost (AVCO) method or the first-in, first-out (FIFO) method. In the template I created, I used the AVCO method because implementing the FIFO method in Excel requires complex functions that some end users might not fully grasp.
The template above uses the AVCO method of inventory costing. You should fill out only the yellow cells, and Excel will compute the rest. Don’t touch the white cells because these contain formulas that compute certain values. Remember that this template assumes that you’re tracking only one inventory product. If you have several inventory products, copy the sheet and rename it, such as sheet 1 = “Light Bulbs.”
Using Excel to Create Amortization Schedules
A loan amortization schedule shows you the schedule of payments, the amount of interest you pay, and the amount that gets deducted from the principal balance. You can use the amortization table to record monthly interest expenses and update loans payable in the books. Most accounting software don’t have an amortization schedule feature.
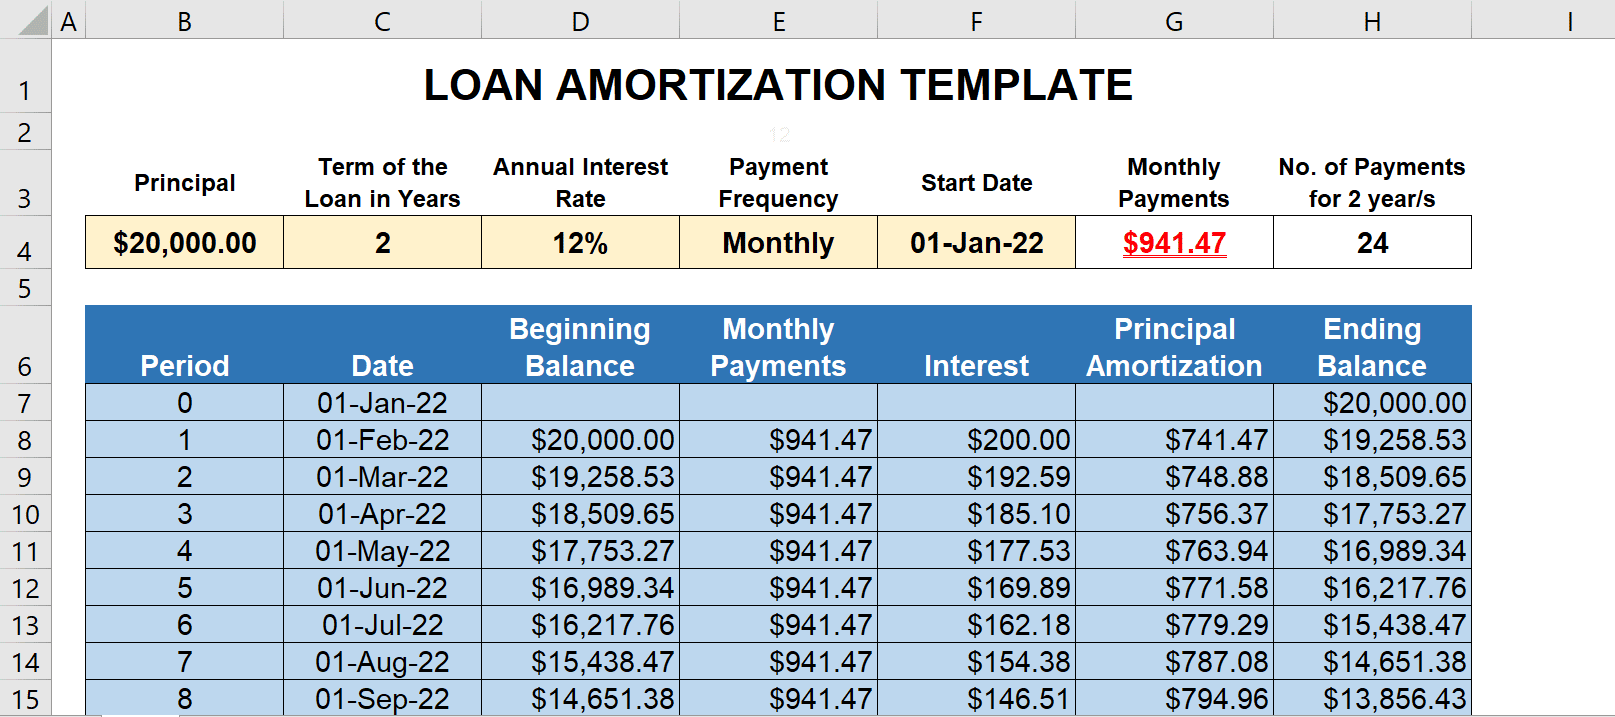
While most lenders offer an amortization schedule, I designed this template to help you evaluate loan options before borrowing. With this tool, you can adjust the principal amount, interest rate, and amortization period to see exactly how much interest you’d pay over the loan’s term, giving you a clear picture of the cost involved.
The template is a dynamic amortization table, and it adjusts based on the number of payment periods and terms. All you need to do is fill out the yellow cells, and Excel will generate the table automatically. Take note that the maximum loan term in this template is 40 years.
The amortization table contains the following information:
- Period is the ordinal number corresponding to the number of payment periods. For example, period 1 pertains to the first payment, while period 6 pertains to the sixth payment.
- Date refers to the date when payment is due.
- Beginning Balance is the loan balance at the beginning of the payment period.
- Payments is the installment payment you need to make based on the payment frequency. If you choose a payment frequency, this cell changes dynamically.
- Interest is the amount of interest expense based on the beginning balance of the loan.
- Principal Amortization is the portion of installment payments deducted from the loan’s beginning balance.
- Ending Balance is the loan balance after deducting the principal amortization.
Using Excel as a General Journal & General Ledger
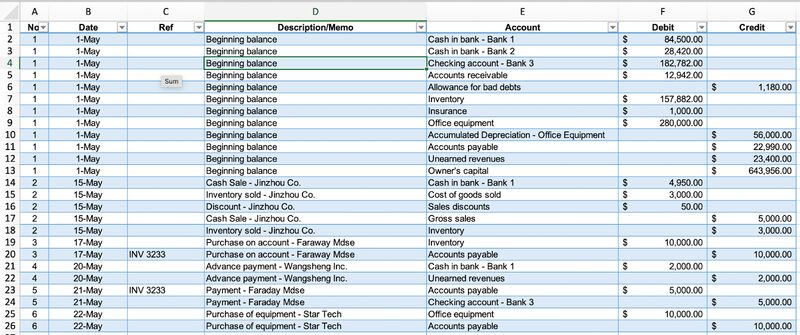
The general journal (GJ) and general ledger (GL) are the two most important records in accounting. All transactions in a business are recorded in the GJ and summarized in the GL. Without these two books, it’s almost impossible to have an organized accounting system.
I recommend using this template if you don’t need to keep detailed records of transactions. It will enable you to keep tabs on all accounts related to your business. If you don’t have accounting knowledge, you’ll have a hard time using this template, so ask someone with accounting experience to use this sheet for tracking your accounts.
Instructions on how to manipulate the template are included in the Excel file. Download it, and read the instructions carefully.
Importing Data From QuickBooks Online Into Excel
QuickBooks Online can export any of its reports to Excel. This is useful as you can pull sales data, banking data, and invoices from many sources into one central workbook to support your accounting activities.
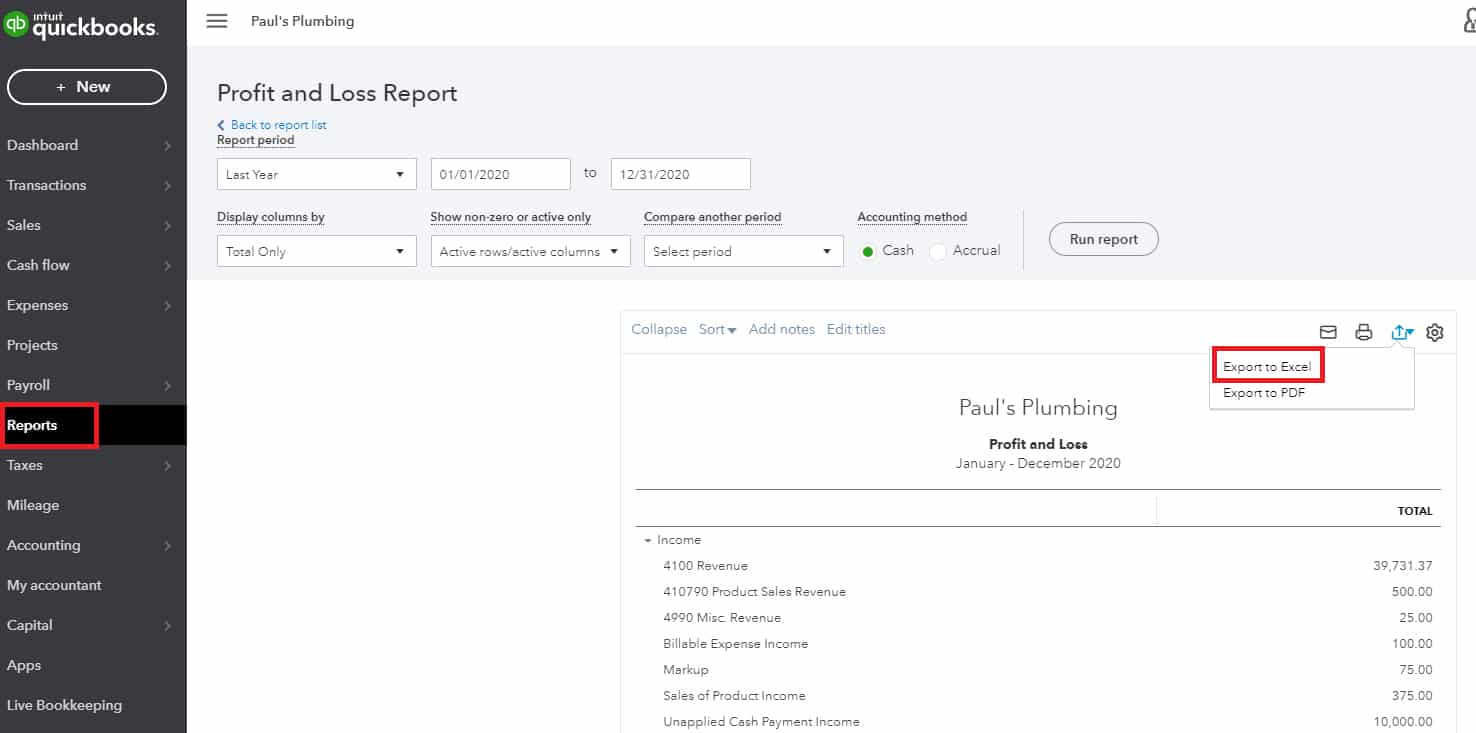
Exporting Reports to Excel in QuickBooks Online
Exporting the report is simple and can be done with the following steps:
- Step 1: Select Reports in the left sidebar.
- Step 2: Search for and select the report that you want to export.
- Step 3: Scroll to the top of the report to adjust the time period, accounting method, and other preferences, if desired.
- Step 4: Click the Export icon in the top right corner of the report, then select Export to Excel. You also have the option to save the report as a PDF.
- Step 5: Save the report in a location that you’ll be able to find easily, such as your desktop.
Here’s a sample Profit and Loss report exported to Excel from QuickBooks Online:
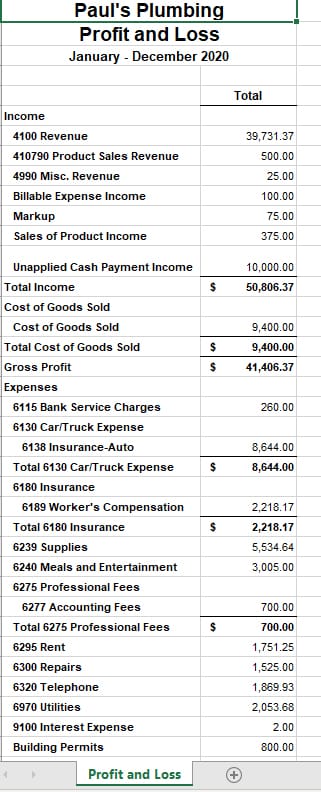
Sample Profit & Loss Statement Exported to Excel from QuickBooks Online
Advantages and Limitations of Using Excel for Accounting
Excel’s design originally drew inspiration from traditional accounting ledgers—and its familiar grid structure of rows and columns made it intuitive for financial professionals. Over time, however, Excel has transformed into a highly versatile tool used across numerous fields beyond accounting. Its powerful formula capabilities, data visualization tools, and chart builders make it indispensable for data analysis and presentation.
Yet, as accounting software advances, does Excel still hold a competitive edge against accounting software in today’s world? Here’s a look at some of its key advantages and disadvantages:
| ADVANTAGES | DISADVANTAGES |
|---|---|
| Data visualization: Excel remains a powerful tool for basic to intermediate data visualization. Its ability to generate charts can help accountants quickly visualize financial information. | Prone to human error: Excel can’t automatically spot errors unless you add a function or macro that spots errors. |
| Formulas and functions: With built-in formulas, functions, and pivot tables, Excel enables complex calculations and data analysis, essential for budgeting, forecasting, and financial modeling. | Limited automations: Adding macros in Excel can automate things for you, but it can’t compete with advanced automation features found in accounting software. |
| Popularity and widespread use: Schools nowadays include Excel in basic computer courses for kids, making a tool that’s familiar to almost every person on the planet. Moreover, accounting courses also include Excel in the curriculum since Excel remains an accountant’s primary tool for data analysis. | Security: Though Excel files can be password-protected, they may be prone to unauthorized access and accidental deletion or modification of data. |
Overall, Excel is still great for accounting—but only to some extent. If you’re a freelancer wanting to track income and expenses, Excel is like a Swiss army knife. Within Excel, you can even manage projects that can connect with your invoice tracking.
When to Use Bookkeeping Software
While Excel has many accounting uses, I don’t recommend using it as your primary bookkeeping software to track your cash flow and classify your income and expenses. Here are some reasons why a bookkeeping software makes more sense than using Excel.
- Growing business with high transaction volume: If your business handles a large number of transactions, bookkeeping software can automate data entry, categorize expenses, and streamline bank reconciliations. Excel would require manual input, which is time-consuming and prone to errors.
- Need for financial reporting: When you need to generate financial reports like profit and loss statements, balance sheets, or cash flow reports regularly, bookkeeping software can do this automatically. In Excel, you’d need to build and maintain complex formulas, which can be inefficient and error-prone.
- Integration with other business tools: If your business uses multiple apps (e.g., payroll, inventory management, CRM), bookkeeping software offers seamless integration, ensuring data flows smoothly across systems. Excel lacks this capability, making it harder to keep everything synchronized.
Check out our list of the best small business accounting software for options.
Frequently Asked Questions (FAQs)
Yes, but it’s not recommended. Excel is cost-effective for very small businesses. However, it can be counterproductive and difficult to use for small businesses with complex processes. I recommend getting one of the best small business accounting software instead.
Accountants and bookkeeping professionals use Excel to perform complex calculations, like amortization tables and depreciation schedules. They also use it to compute product cost, allocate overhead, and perform budgeting and forecasting.
Overall, yes, QuickBooks is better than Excel for accounting. QuickBooks is also easier to use because you don’t need to create formulas to perform calculations and process data. Excel requires users to have in-depth knowledge of formulas and even a little bit of programming to create automations.
Accountants need to have technical skills in using Excel. They must know all the Excel functions and features to maximize the full potential of the software. It would be a big plus if they know the keyboard shortcuts.
In accounting, functions like VLOOKUP, HLOOKUP, or INDEX-MATCH (now replaced by XLOOKUP) are extremely useful for accountants, especially when getting values from different tables. However, logical functions like IF, IFS, SUMIFS, or COUNTIFS enable accountants to execute conditional statements that are very useful for filtering data.
Bottom Line
While using Excel for accounting tasks can be beneficial and inexpensive, it can be a time-consuming process and comes with the potential for errors. If you’re looking for a simpler and much more efficient way to manage your accounting, I recommend exploring different accounting software solutions to identify the one that’ll work best for you.
