Using a sales forecast, business owners can create realistic projections about incoming revenue and business performance based on their current data and past performance. Sales forecasts may cover weekly, monthly, annual, and multiannual projections and can be done using Google Sheets, Excel templates, or customer relationship management (CRM) software.
We’ve compiled nine free sales forecast templates you can download. Each downloadable file contains an example forecast you can use as a reference. We also included a blank template you can copy and fill in with your sales data.
Did You Know?
Sales forecasts create projections that can help you set goals, measure performance and budget, obtain financing, attract investors, and grow your business. So many parts of the business depend on forecasts, so it’s important to use software tools or a CRM system that gives you realistic, data-driven forecasts.
1. Simple Sales Projection Format in Excel and Google Sheets
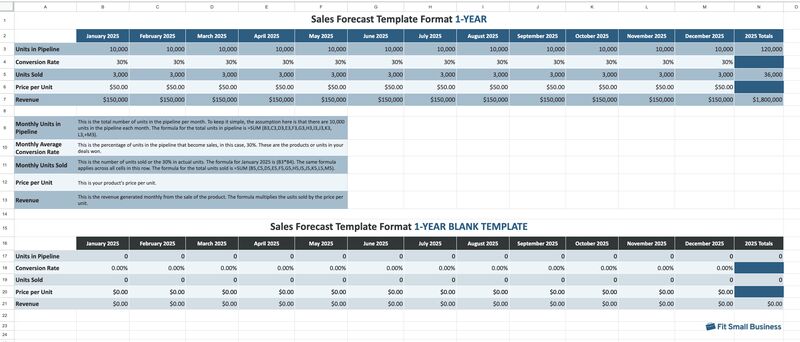
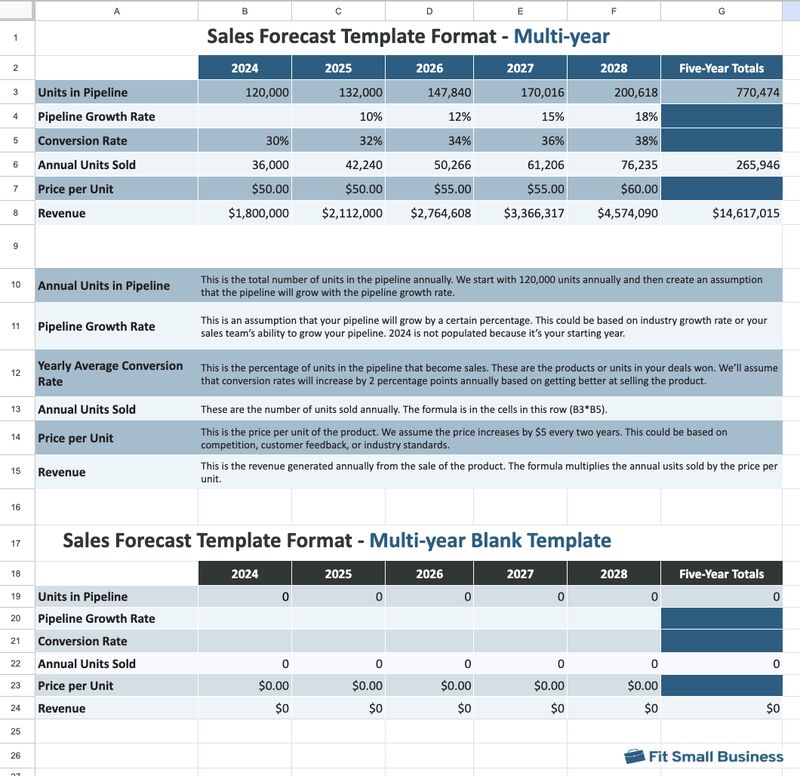
Our free simple sales forecast template will help you get started with sales estimates to plan and grow your business. You can modify these one-year and multiyear projections in either Google Sheets or Excel. They can also generate future revenue estimates based on units sold, pipeline growth percentages, lead conversion rates, and your product pricing. This gives you an idea of how much your business can grow sales-wise in the next few years.
2. Long-term Sales Projection Forecast
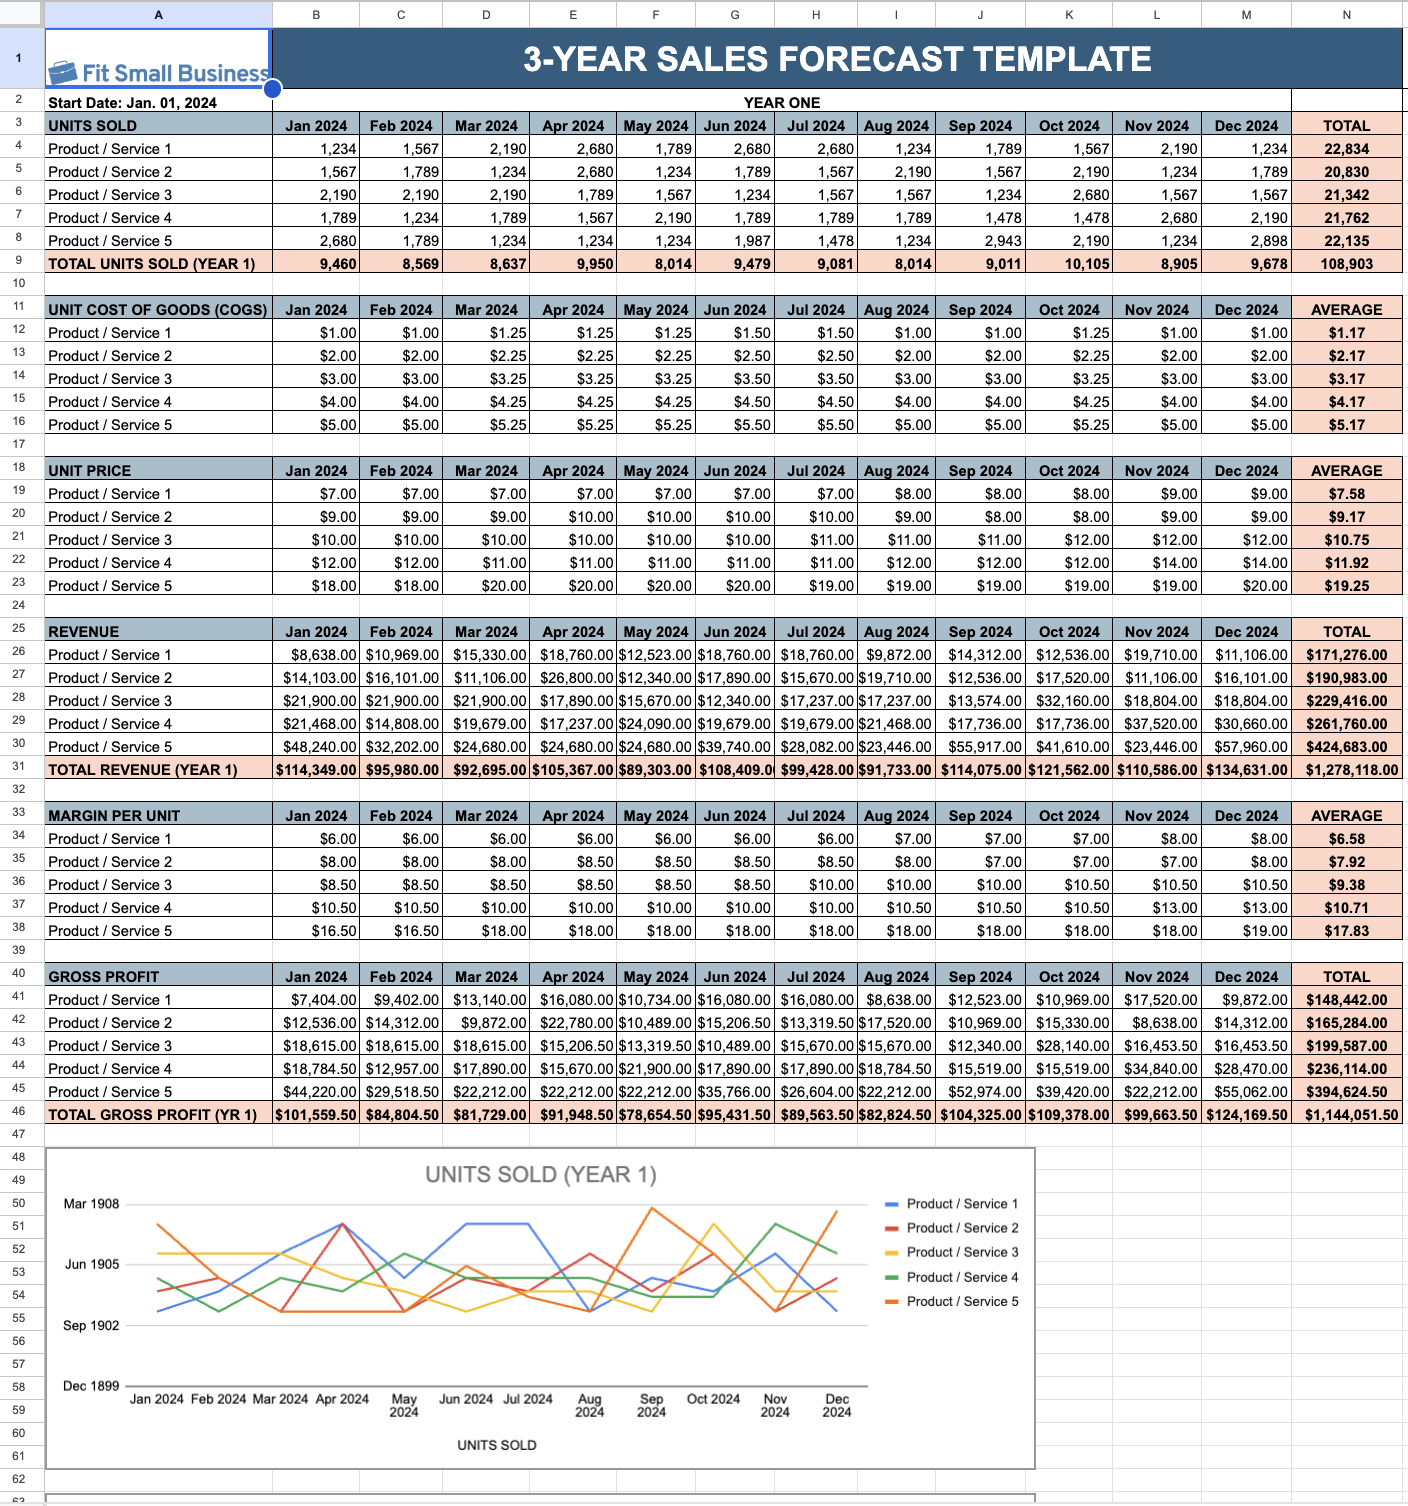
Part of creating a sales plan is forecasting long-term revenue goals and sales projections and then laying out the strategies and tactics you’ll use to hit your performance goals. Long-term sales projection templates usually provide three- to five-year projections. These templates are accessible in both Excel and Google Sheets.
Long-term sales prediction templates are best for businesses looking to scale and that want insights about how much working capital they can expect to tap into for growth initiatives. This type of sales projection template is also often required when applying for commercial loans or funding through outside investors or crowdfunding.
Salespeople can use a multiyear sales projection format in Excel or Google Sheets to track performance against targets, identify trends, plan inventory needs, and make informed decisions.
3. Budget Sales Projection Template
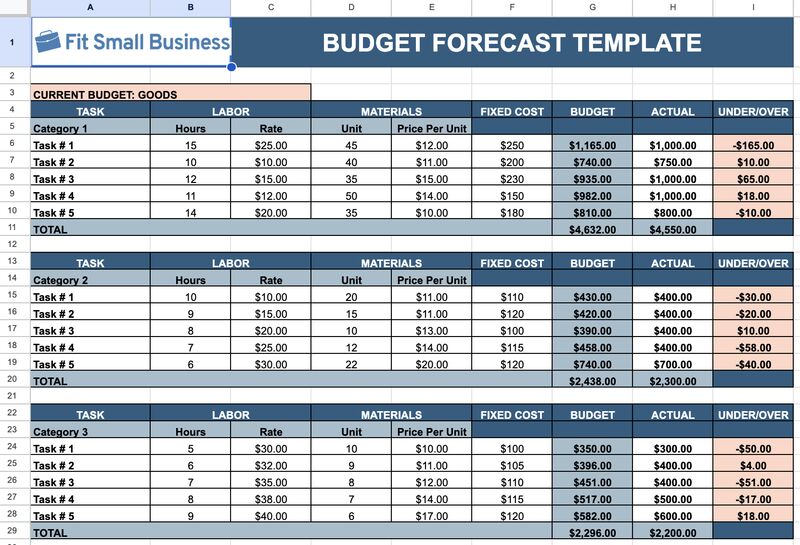
A budget sales forecast template shows expense estimates in relation to revenue, allowing you to calculate how much you can spend during a specified period. Budget templates will enable you to enter income projections and available cash to indicate your spending capabilities for that time frame.
This type of template is best for new and growing businesses trying to figure out their future available expenditures. Additionally, businesses interested in purchasing a large asset, such as a company vehicle, piece of equipment, or commercial real estate, can use this template to see how much of the asset can be self-financed.
Sales managers can use a budget sales projection Excel template to align sales goals with financial resources and monitor performance against budgeted targets.
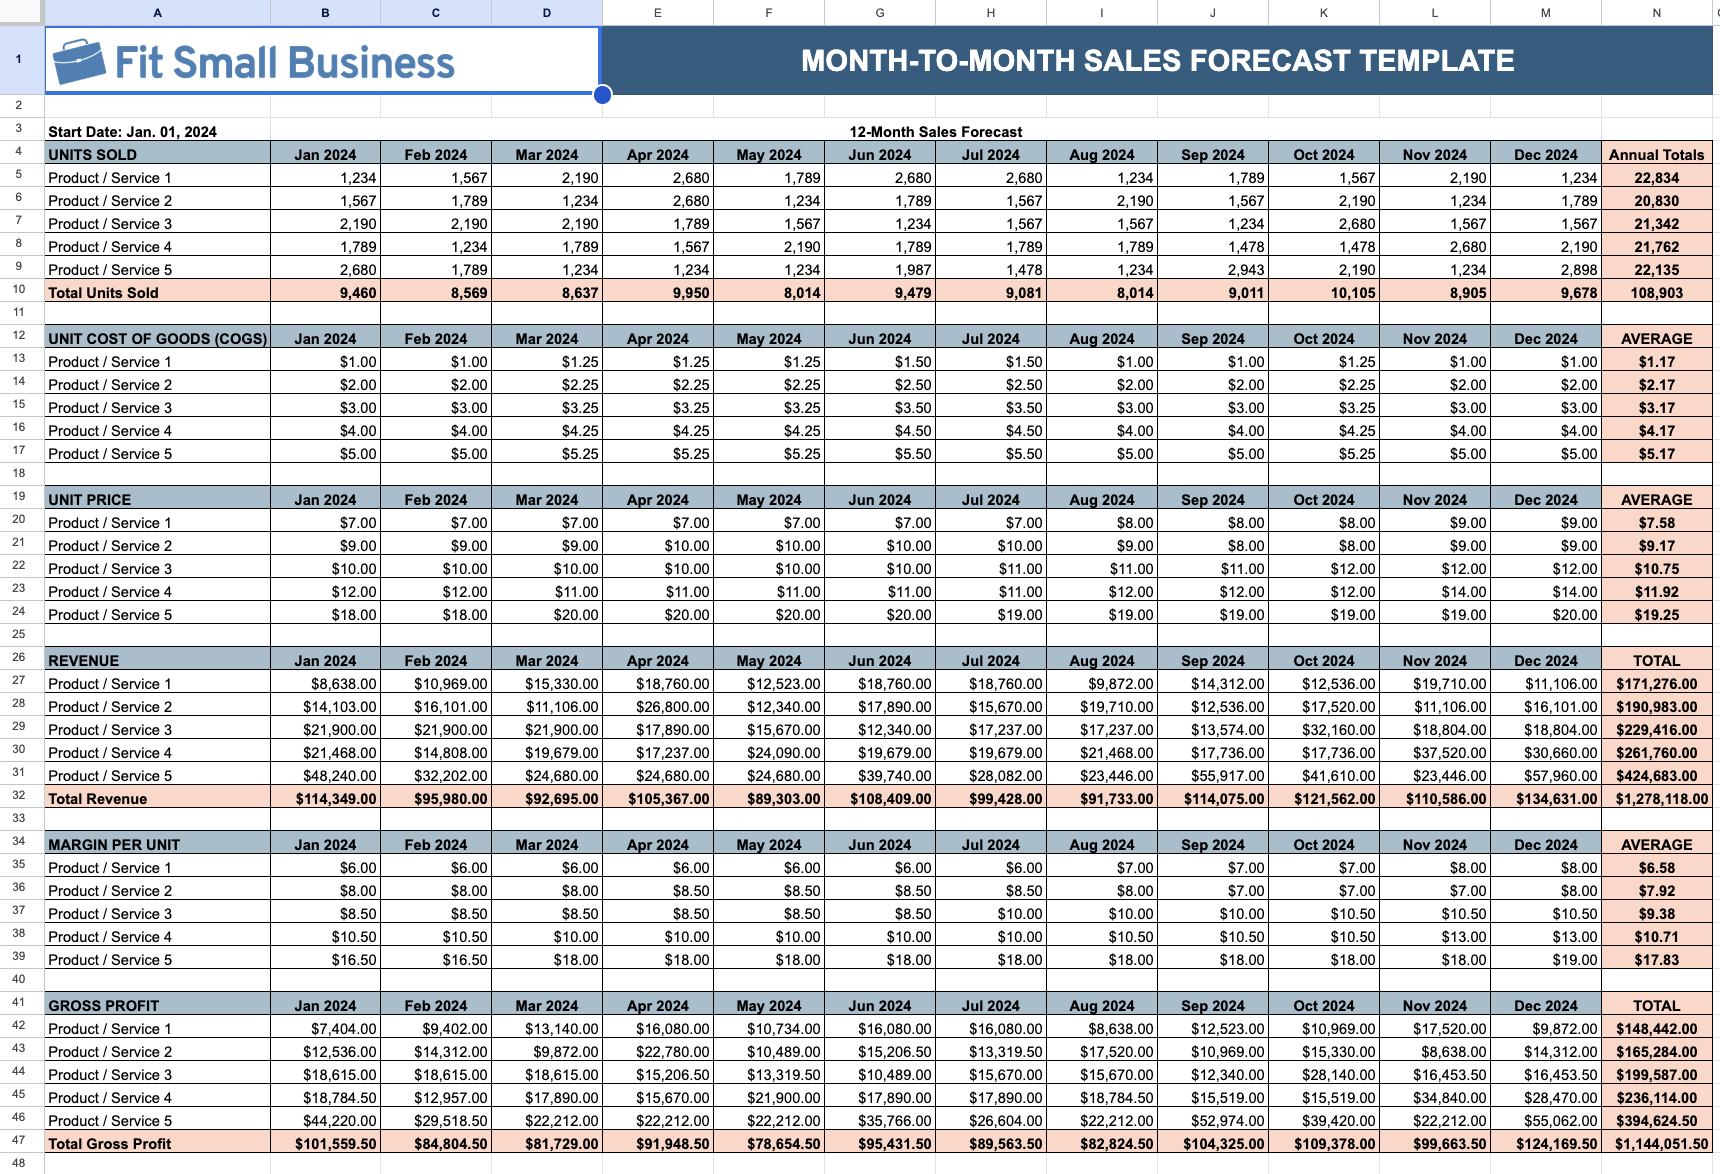
4. Month-to-Month Sales Forecast Template
The month-to-month sales projection template shows sales projections for a year divided into monthly increments. This type of revenue forecast template makes it easier to estimate your incoming revenue because you can break down your pricing model, such as the average number of units sold, monthly rather than annually.
This monthly sales projection example is best for seasonal businesses that experience significant revenue fluctuations in some months compared with others. It’s also appropriate for companies that want to view rolling 12-month projections as a key performance indicator (KPI). You can also use it to project one-year sales estimates before implementing major campaigns or growth initiatives.
Sales teams can use a month-to-month sales forecast Excel template to track short-term performance and adjust tactics based on real-time data.
5. Individual Product/Service Sales Forecast Template
Businesses that sell one product or service can use an individual sales projection template to project sales of a new (or any single) product or service. This forecast indicates how you expect the product to perform based on units sold and the price per unit monthly.
An individual product forecast template benefits businesses that sell products through a physical storefront or online. It helps businesses adding a new product to their arsenal estimate sales exclusively for that product. It is also recommended for companies that need to track individual performance for the most popular or profitable products.
Sales reps can use an individual product forecast template to predict sales, track performance, and adjust strategies for specific products.
6. Multiproduct Sales Forecast Template
Use this revenue projection template to generate sales projections if your business sells multiple products. Through this type of template, you can compare the estimated performance of specific products by tracking the units sold and the price per unit. In turn, this will yield a total sales revenue estimate.
The multiproduct forecasting template is best for retail or wholesale businesses selling various products. You can also use it to project the revenue of multiple product categories. Each “item” represents a category rather than an individual product, and the price per unit is calculated in aggregate.
A multiproduct forecast template can help track and predict sales across multiple products, prioritize efforts, and optimize inventory and resource allocation.
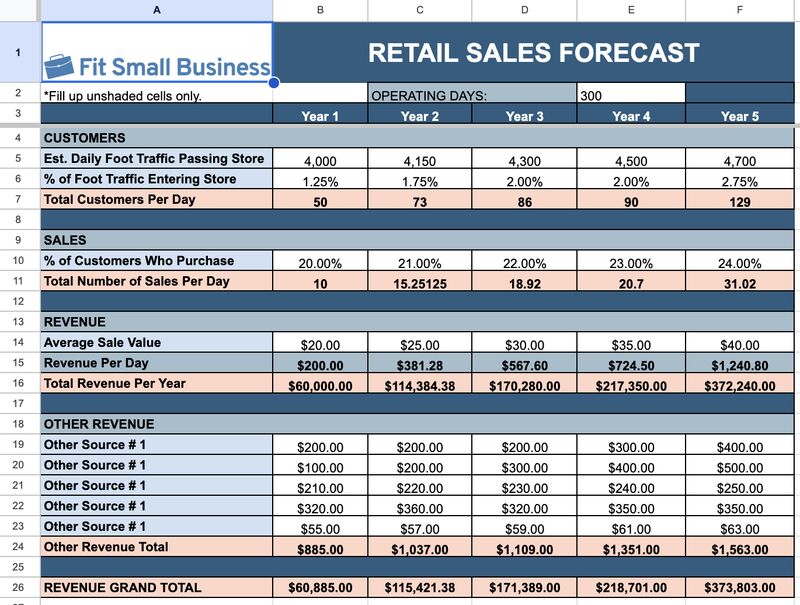
7. Retail Sales Forecast Template
A retail sales projection template forecasts revenue for brick-and-mortar stores since it includes data related to foot traffic. The retail sales template calculates projected revenue by year based on the percentage of foot traffic that enters the store and the scale of conversions or those who make a purchase. Since it has a field for “other revenue,” it can be used by retail stores selling online.
This business forecast template is mainly designed for brick-and-mortar retail businesses. However, multichannel ecommerce and brick-and-mortar businesses can also use this forecast template (just add ecommerce sales under other revenue). Or replace “Est. daily foot traffic passing stores” with “website traffic” to convert this sales forecast Excel sheet into an ecommerce sales forecasting template.
A retail sales forecast template helps businesses predict sales, manage inventory, and plan marketing strategies.
8. Subscription-based Sales Forecast Template
Businesses relying on recurring revenue from sign-ups or contract renewals should use the subscription-based sales prediction spreadsheet. Enter data into the visitor and sign-up fields to show the visitor-to-sign-up conversion rate. Then, enter the number of new customers to show the percentage of sign-ups that convert to paying customers.
This business projection template also helps you track customer churn. It calculates your churn and retention rate based on the number of paying customers at the end of the period compared with the number at the beginning, plus the number of new customers added. Knowing your churn rate is essential since a high or increasing rate of customer turnover could indicate problems with your organization or its products or services.
The fields of this template can be altered for use by contract renewal businesses like insurance agencies, information technology (IT) companies, and payroll processors. For example, subscribers can be replaced with “leads,” and new subscribers can be replaced with “presentations,” “free trials,” or “demos.” Then, change the churn rate to “nonrenewed contracts” to estimate new and recurring business revenue year-to-year.
A subscription-based forecast template helps businesses predict recurring revenue, track subscriber growth, and manage retention strategies.
How to Calculate Your Churn Rate:
Divide the number of lost customers by the total customers at the start of the time period, then multiply the result by 100. For example, if your business had 200 customers at the beginning of January and lost 12 customers by the end, you would divide 12 by 200 to get 0.06. Multiply that by 100, and 6% is your monthly churn rate.
% Churn = (Total Number of Customers Lost/Total Number of Customers) × 100
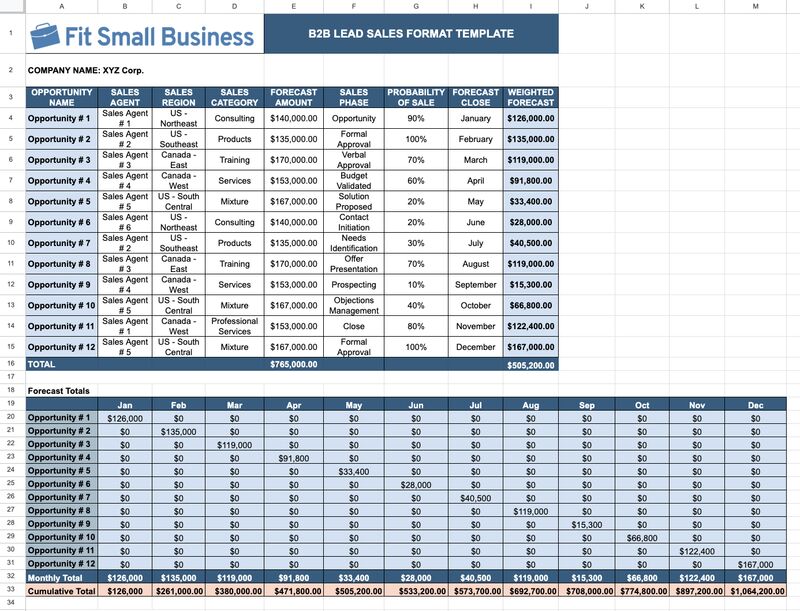
9. B2B Lead Sales Projection Format in Excel and Google Sheets
A business-to-business (B2B) lead forecast template estimates sales revenue from current deal opportunities in the sales pipeline through business leads. Businesses can use estimated deal values and the percent chance of closing those deals to obtain a sales projection.
This revenue projection template is best for B2B organizations or businesses selling to other businesses or organizations rather than business-to-consumer (B2C) organizations. It can also be used for direct sales prospecting activities and businesses that submit business proposals in response to solicitation requests. Download our free sales projection format in Excel and Google Sheets to save time and effort.
A B2B lead forecast template helps businesses predict lead generation, track conversion rates, and optimize sales strategies for B2B sales pipelines.
CRMs With Built-in Sales Forecasting Features
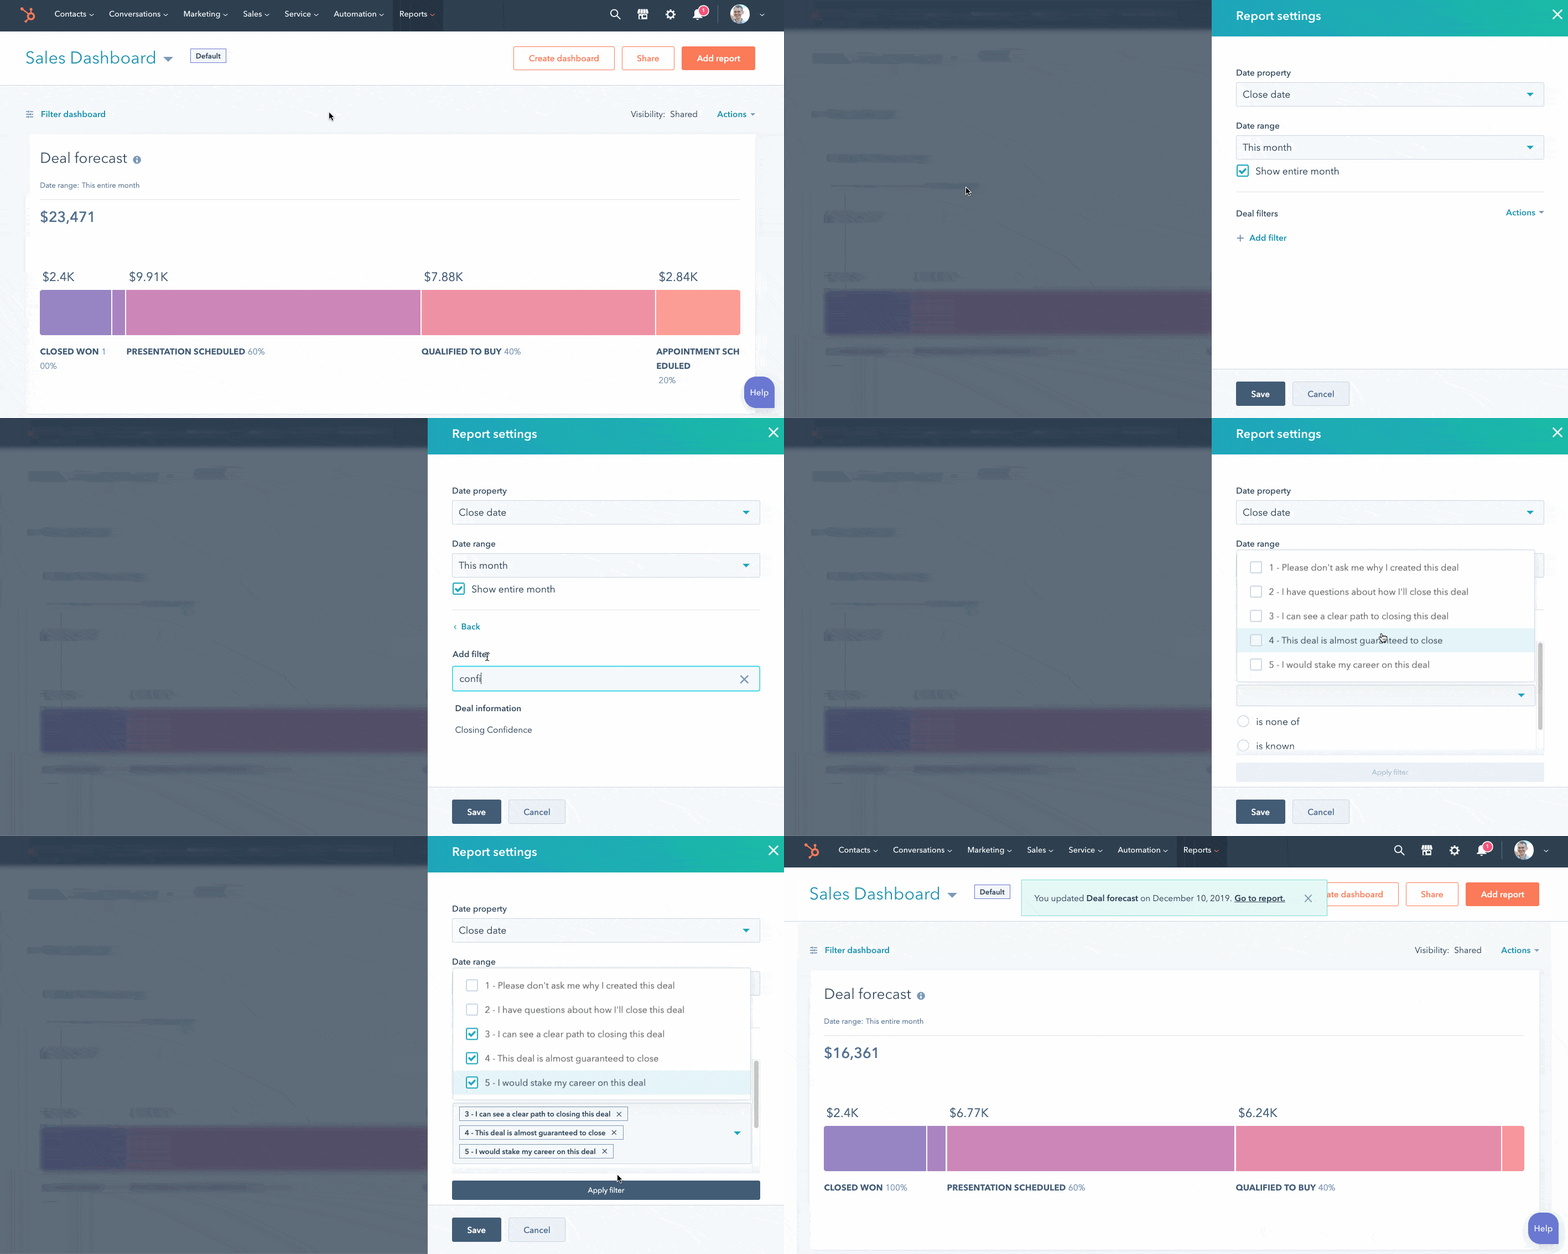
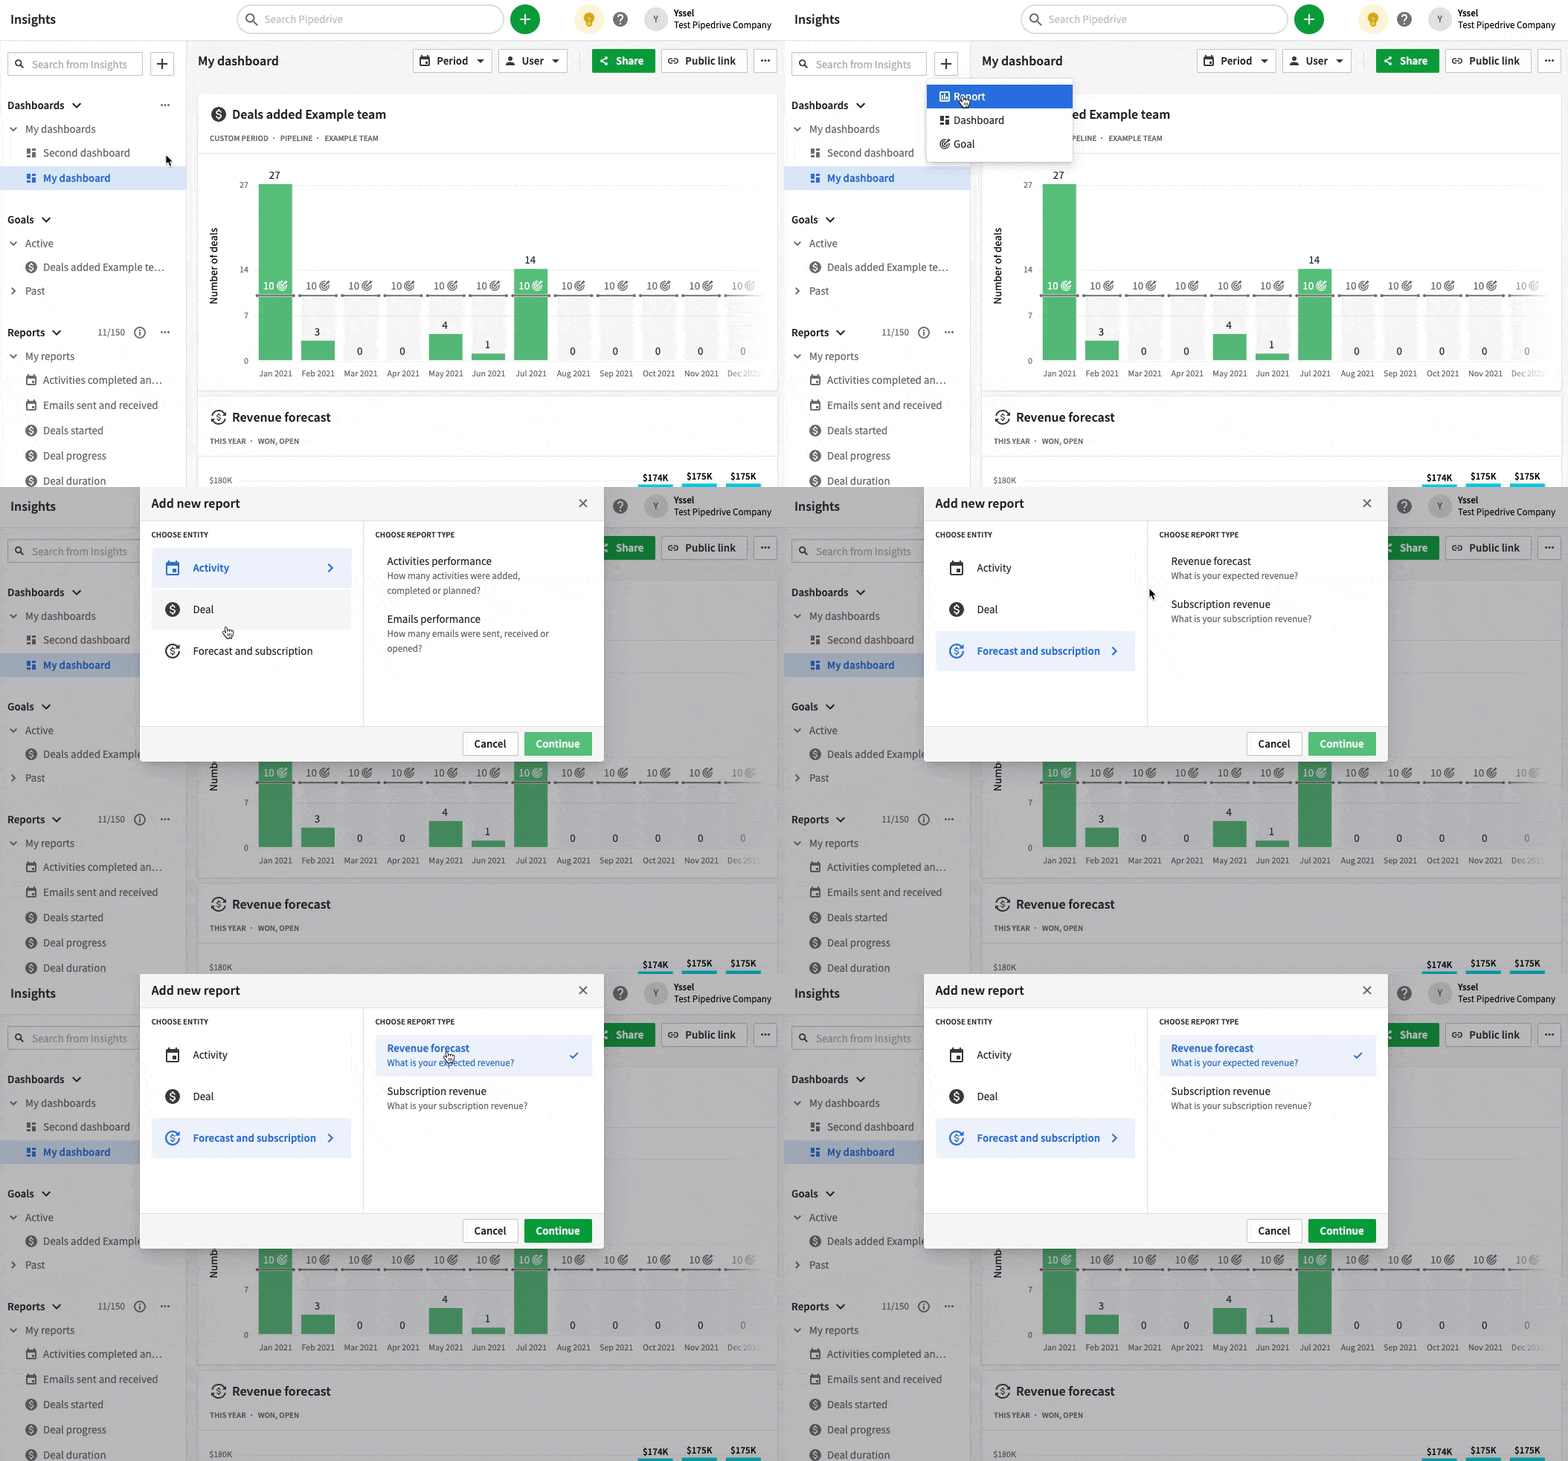
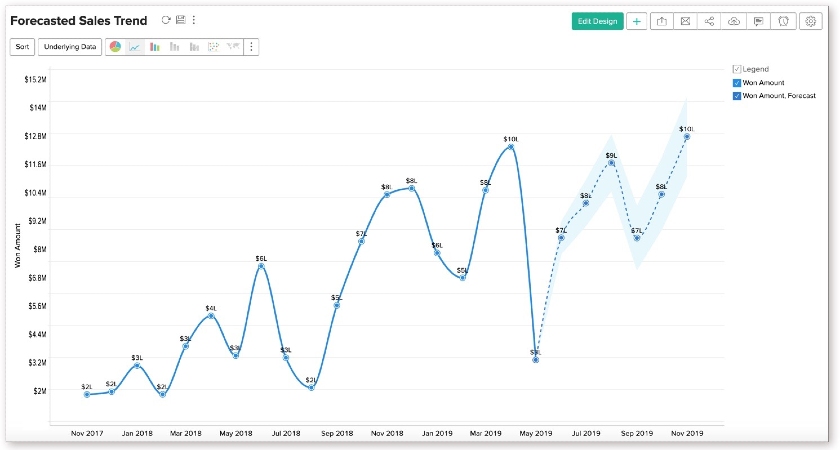
Sales forecast sample templates are easy to modify. However, customer relationship management (CRM) systems generally offer more robust tools for managing revenue opportunities that can be converted into sales forecasts. They are valuable tools for providing sales predictions on premade charts through the data collected in the system. Below are examples of CRM platforms that could double as great sales forecasting software.
Benefits of Using Sales Forecasting Templates
Sales forecasting can help small business owners understand their revenue potential, align their resources effectively, and make data-driven decisions. Sales forecasting templates are a key tool for streamlining this process. Here are five key benefits of sales forecasting supported by recent statistical findings.
1. Improved Accuracy in Sales Projections
About 80% of sales and finance leaders have missed a sales forecast in the past year. This data highlights the challenge many face in making accurate projections, which could result in missed sales opportunities. Sales forecasting templates integrate historical data, trends, and industry benchmarks to help business owners and managers generate more reliable sales and overall revenue projections.
2. Enhanced Resource Allocation
Sales operations leaders can improve forecasts by using revenue projection templates and integrating predictive analytics. These tools enable the visualization of trends and real-time adjustments to sales and marketing strategies, optimizing resources such as personnel, budget, and inventory.
For example, a sales team using predictive analytics can predict a 30% drop in demand for winter apparel by late February because of unseasonably warm weather. This insight allows them to shift their budget toward promoting spring collections earlier than planned and reassign staff from winter-focused sales regions to areas where demand for transitional clothing is growing.
3. Streamlined Decision-making
Artificial intelligence (AI) has the potential to increase corporate profits by up to $4.4 trillion annually. The majority of potential value in high-tech industries stems from generative AI’s capability to accelerate and streamline software development processes. AI boosts performance in key areas, like marketing and customer interactions. Leveraging AI-powered predictive analytics and sales forecasting templates enables sales leaders to make faster, more informed decisions.
The data-driven insights allow teams to pivot strategies rapidly to meet shifting customer and market demands. For example, a sales team using AI-powered predictive analytics can detect an upcoming surge in demand for fitness equipment ahead of the New Year. This allows them to adjust marketing campaigns, increase inventory levels, and assign sales reps to high-demand regions.
4. Improved Sales Team Alignment
Sales forecasting templates help align sales teams with other departments. CRMs with forecasting tools, like analytical reports, improve cross-functional collaboration and reduce miscommunication. For example, a sales manager predicts a 63% increase in demand for a new software product in the next quarter. With this insight, the marketing team can quickly adjust digital campaigns to target the right audience, while the customer support team can prepare by increasing staff levels.
5. Increased Revenue and Profitability
Sales forecasting is key to driving revenue, but 66% of sales professionals struggle because of reporting systems that can’t access historical CRM or performance data. CRM sales forecasting software with templates can help sales teams overcome this challenge. This means more accurate targets, better resource allocation, and improved performance tracking.
For example, a sales team using CRM revenue forecasting software notices that a particular line of smartphone cases has a 40% increase in sales every holiday season. With this in mind, salespeople can work with marketers to ramp up advertising in advance and ensure that inventory levels are increased to meet the expected demand.
How to Choose the Right Sales Forecast Template
Choosing the right sales projection format in Excel or Google Sheets is crucial to making accurate and actionable predictions to drive your small business forward. Below are some tips to help you get started.
1. Define Your Forecasting Needs
Identify the core requirements of your sales forecast by considering the time horizon (monthly, quarterly, or annual). The level of detail (high-level vs granular by region or salesperson) and the type of forecast you need (sales volume, revenue, or both) are also important considerations to ensure a seamless sales process.
2. Consider Your Sales Cycle and Data Sources
A short sales cycle (common in B2C sales) requires a more dynamic and frequent template updating process. On the other hand, a longer cycle (common in B2B sales) calls for pipeline-based forecasting that accounts for deal stages over time. Sales templates that integrate with existing data sources, such as CRM systems, enable automated info input and provide accurate insights for efficient operations.
3. Evaluate Template Customization and Features
Look for templates that allow customization based on your specific sales process. The ability to add custom fields, adjust assumptions, and use formulas for more accurate forecasting is essential. Add graphs, charts, or pivot tables for more effective data and trend analysis. Scenario planning options (best-case vs worst-case) can help sales teams create more flexible forecasts.
4. Test for Ease of Use and Collaboration
Choose a template that is easy to use and update regularly. The best ones don’t require complex calculations and have easy-to-fill data fields. It’s also best to use a template with multiuser access, version control, and the ability to add comments for seamless collaboration.
5. Plan for Scalability and Flexibility
As your business grows, your forecasting needs evolve. For instance, as you launch new products, you’ll need an additional forecast to determine demand. Therefore, we highly recommend choosing scalable forecasting templates through a spreadsheet or built-in software like a CRM.
Frequently Asked Questions (FAQs)
A sales forecast template is a predesigned spreadsheet that allows businesses to project their future sales revenue for a specific period. It’s typically based on historical sales data and market trends. It also includes various factors that may potentially affect future sales performance, such as new product launches, seasonality, economic conditions, and changes in consumer behavior.
To create a sales forecast, first gather and analyze past sales data to identify trends, seasonality, and patterns. Then, apply forecasting methods like moving averages or regression analysis to predict future sales. Next, incorporate market research and insights from your sales team to refine the forecast, considering market conditions or upcoming product launches. Finally, regularly update the forecast by comparing actual sales with predictions and adjusting for changes in the market or business environment to ensure its accuracy over time.
The formula for a sales forecast typically varies depending on the method, but a simple approach multiplies your average sales per period by the number of periods.
Sales Forecast = (Average Sales per Period) × (Number of Periods)
To perform sales forecasting in Excel, first gather your past sales data by date (e.g., monthly or quarterly). Then, use Excel functions like AVERAGE, TREND, or FORECAST.LINEAR to calculate future sales. Next, create a time series chart to visualize sales trends over time. Finally, update the forecast regularly with actual sales data to refine predictions and maintain accuracy.
Bottom Line
Business forecast templates are available in both Excel and Google Sheets that you can download and customize. You may also take advantage of CRM features that organize, estimate, and visualize your company’s sales information, including sales predictions. A CRM can save sales reps time making projections and optimize your sales pipeline to generate leads and close more deals.
