


Sales forecasting is the process of estimating future sales revenue within a given time, usually every week, month, quarter, and year. While it’s not an exact prediction, it’s an excellent basis for your sales team’s performance and can enable you to make more informed sales and marketing decisions.
With accurate sales forecasts, you can adjust sales strategies, allocate resources efficiently, and minimize financial risks for smoother small business operations. Dive into sales forecasting, why it matters, its top challenges, and how it can improve your team’s short-term and long-term performance.
- Key Objectives of Sales Forecasting
- Why Is Sales Forecasting Important?
- How to Accurately Forecast Sales
- Sales Forecasting Methods & Techniques
- Team Members Responsible for Sales Forecasts
- Top Challenges of Sales Forecasting
- Sales Forecasting Best Practices
- Features to Look for in Sales Forecasting Software
- Frequently Asked Questions (FAQs)
- Bottom Line
Key Objectives of Sales Forecasting
The goal of forecasting is to have an accurate estimate of your sales performance, profit, and loss. These estimates help organizations make better, more realistic decisions. Other key objectives include the following:
- Aligning hiring and staffing levels with predicted revenue
- Setting a required level of production needed to meet forecasted product demand
- Providing sales leaders with accurate insights into their prospects and industry
- Helping the financial department make quarterly and annual investment decisions
Why Is Sales Forecasting Important?
Sales forecasting is important in predicting revenue outcomes. And it can help managers gain valuable insights, come up with solid sales plans, and implement them effectively. Small business owners must know how to estimate their future sales to facilitate efficient inventory management, employee workload distribution, strategic marketing, and sales management.
Revenue forecasting goes beyond predicting figures. It’s a core business activity for capturing relevant data for strategic decision-making, simplified with the help of the best sales forecasting software. Overall, sales leaders use forecasts to plan sales quotas for reps across territories and properly budget to minimize unnecessary spending.
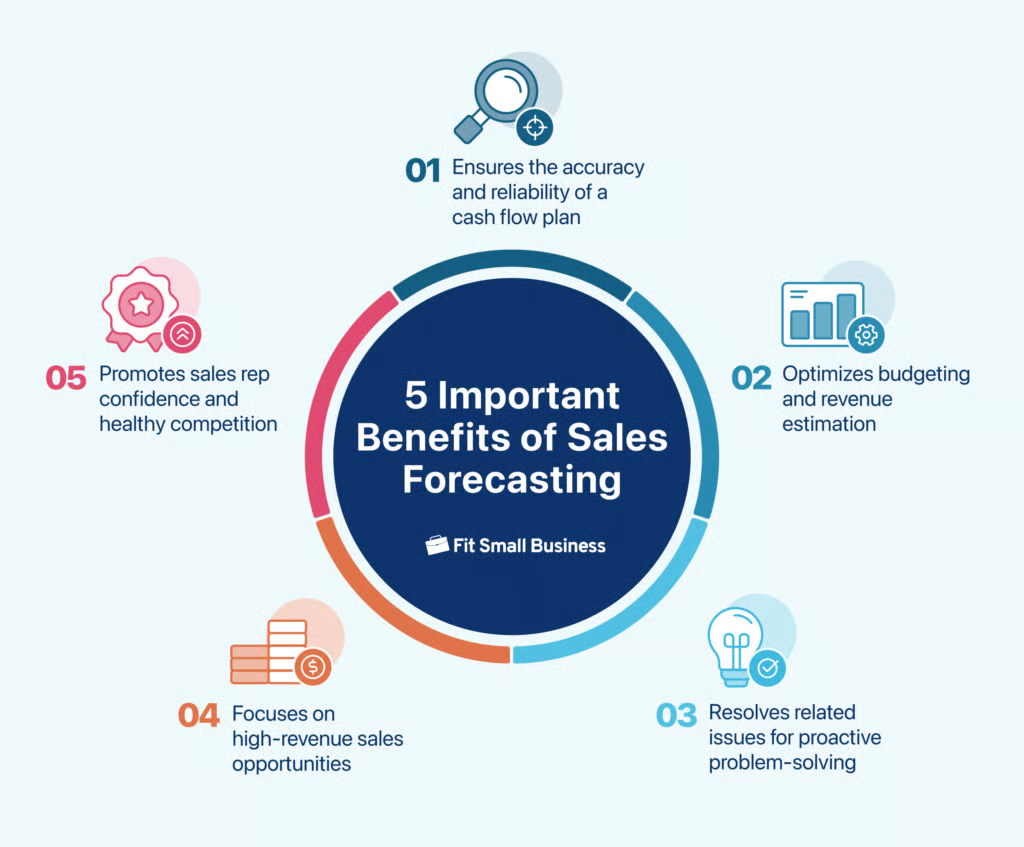
Ensures the Accuracy & Reliability of a Cash Flow Plan
Predicting sales aims to maintain a good cash flow plan, which estimates future cash inflows and outflows. Optimizing sales forecasts using a customer relationship management (CRM) system powered by artificial intelligence (AI) ensures the accuracy and reliability of your cash flow plan. For example, some CRMs come with AI sales assistants that recommend high-win probability deals that sales reps can focus their efforts on.
Optimizes Budgeting & Revenue Estimation
One of the core foundations of predicting business budget allocation is having accurate sales forecast data. With data-driven insights, startups and businesses can allocate resources efficiently. For instance, a startup can identify its most profitable product lines and focus marketing efforts and inventory on those to maximize its return on investment (ROI). This ensures your sales team receives excellent support to meet their quotas while safeguarding the business’s financial health.
Resolves Related Issues for Proactive Problem Solving
Sales leaders visualize forecast data to spot adjacent issues like a drop in pipeline velocity, signaling potential bottlenecks, or sales-marketing misalignment even before problems arise. Let’s say one of your sales reps has been below their quota for the past two weeks. You can promptly coach them to prevent their performance from affecting the whole month. The same principle applies to monthly and quarterly sales performance monitoring.
Focuses on High-revenue Sales Opportunities
The sales forecasting process can help estimate expenses and revenue based on short-term and long-term sales performance. For example, it can predict higher costs for additional staffing during a seasonal sales surge or estimate revenue from a new product launch over the next quarter. Hence, sales leaders can use sales forecasts to discover high-revenue sales opportunities by targeting repeat customers and broadening geographic reach.
Promotes Sales Rep Confidence & Healthy Competition
Sales leaders use forecast data to track salespeople’s performance, such as win rates, and identify potential challenges early. Moreover, revenue forecasting can promote healthy competition by keeping sales reps informed about their performance compared with their peers. This also motivates them to apply the best practices of top performers to improve their performance.
How to Accurately Forecast Sales
An accurate sales forecast includes an estimate of the quantity of goods and services a small business can deliver over a period of time. Take a look at the general steps on how to do a sales forecast accurately.
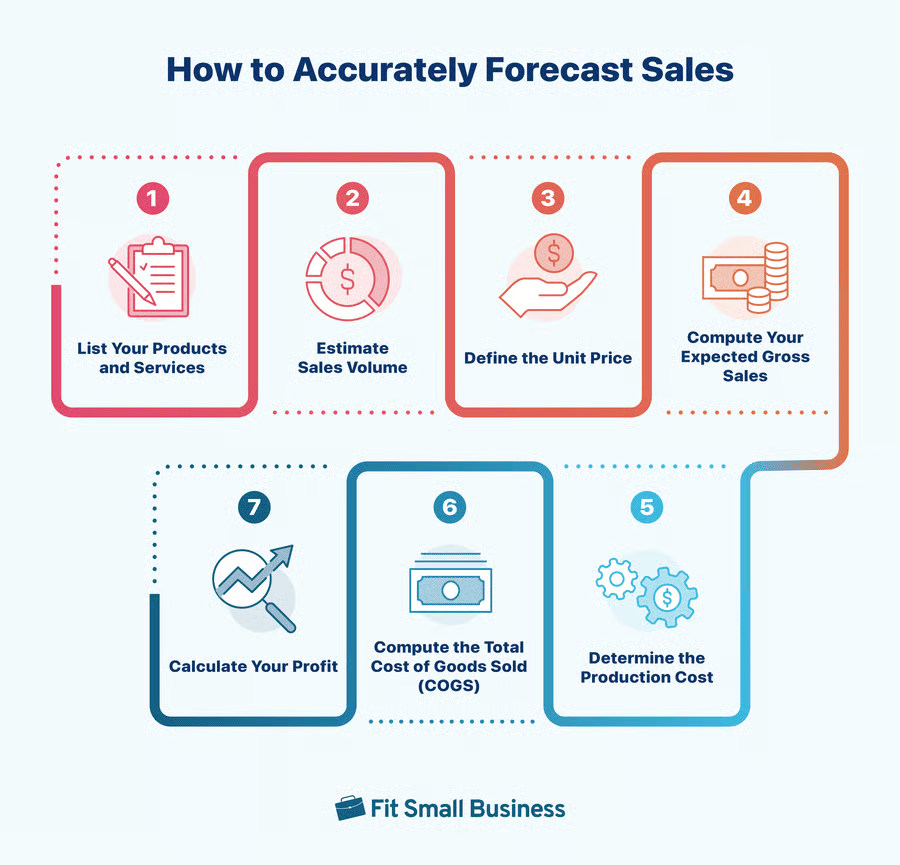
1. List Your Products and Services
Categorize your products and services into clear groups, such as core offerings, seasonal items, and upsell opportunities, to capture all revenue streams. As much as possible, be specific and include variations, like sizes or colors, to make a more detailed and accurate forecast.
Examples:
- Custom printed T-shirts
- Custom hoodie printing
- Bulk T-shirt orders for events or businesses
2. Estimate Sales Volume
Review historical data, trends, and market conditions to predict sales demand. It’s also crucial to consider seasonal fluctuations, upcoming promotions, and external events. These factors can significantly affect your sales during the forecast period.
Example:
- Custom printed T-shirts: 500 units
- Custom hoodie printing: 200 units
- Bulk T-shirt orders (for events): 100 units
3. Define the Unit Price
Set the unit price of your product or service based on your production costs, desired profit margin, and market research to ensure competitiveness while maintaining profitability. Factor in bulk discounts, customization fees, seasonal pricing, and other variations to reflect the full range of your offerings accurately.
Example:
- Custom printed T-shirts: $25 each
- Custom hoodie printing: $40 each
- Bulk T-shirt orders: $15 per T-shirt
4. Compute Your Expected Gross Sales
To calculate sales, multiply the estimated number of units sold by the price for each product or service. This will give you a clear picture of expected gross sales for each category, helping you gauge the overall income from your forecast.
Example:
- Custom printed T-shirts: 500 units x $25 = $12,500
- Custom hoodie printing: 200 units x $40 = $8,000
- Bulk T-shirt orders: 100 units x $15 = $1,500
5. Determine the Production Cost
Include all direct costs in your computation, such as materials, labor, and overhead specific to each product or service. Consider variable costs, like production and shipping, and fixed costs, such as rent or equipment depreciation, to get an accurate cost per unit.
Example:
- Custom printed T-shirts: $12 per shirt (material, printing, packaging)
- Custom hoodie printing: $25 per hoodie
- Bulk T-shirt orders: $10 per shirt (for materials with a bulk discount)
6. Compute the Total Cost of Goods Sold (COGS)
Multiply the cost to produce and sell each product by the estimated sales volume to determine the total COGS for each item. This step helps you assess the total expense required to fulfill the forecasted sales and understand the impact on your bottom line.
Example:
- Custom printed T-shirts: 500 units x $12 = $6,000
- Custom hoodie printing: 200 units x $25 = $5,000
- Bulk T-shirt orders: 100 units x $10 = $1,000
7. Calculate Your Profit
Subtract the total cost from the total sales to compute your expected profit. This is a simplified example, but it captures the core principles of forecasting sales accurately. Learn more about the different types of sales forecasting methods and techniques below.
Example:
- Custom printed T-shirts: $12,500 (sales) – $6,000 (cost) = $6,500 profit
- Custom hoodie printing: $8,000 (sales) – $5,000 (cost) = $3,000 profit
- Bulk T-shirt orders: $1,500 (sales) – $1,000 (cost) = $500 profit
Final Profit Calculation:
Total Sales:
$12,500 (custom T-shirts) + $8,000 (custom hoodies) + $1,500 (bulk orders) = $22,000
Total Cost:
$6,000 (custom T-shirts) + $5,000 (custom hoodies) + $1,000 (bulk orders) = $12,000
Total Profit:
$22,000 (total sales) – $12,000 (total cost) = $10,000
This $10,000 is your expected profit for the period based on your forecasted sales volume and costs.
Sales Forecasting Methods & Techniques
Forecasting entails inputting factors into an equation to output a sales estimate. Depending on which sales prediction method you use, internal factors such as past sales, current opportunities, and marketing campaigns influence the estimates produced. Then, consider external factors like the economic climate, market competition, and seasonality. Review the primary types of sales predicting methods.
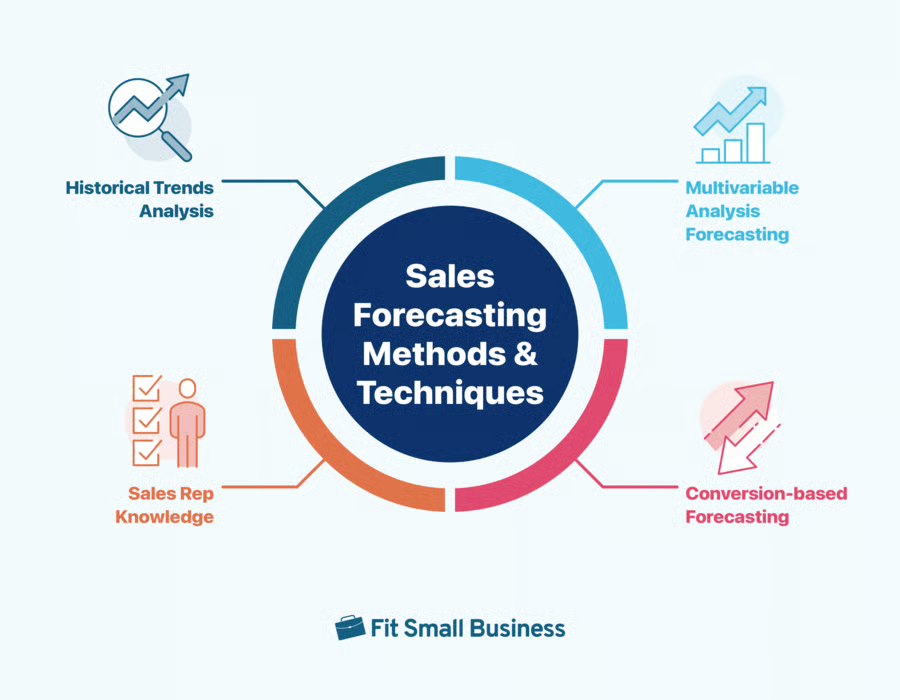
Historical Trends Analysis
This projected sales forecast method takes data from previous time periods, accounts for new factors, such as growth or increased demand, and calculates estimated sales revenue. While this method is ideal for businesses at least a few years old, new businesses can also use historical trends by evaluating information from similar businesses.
Let’s look at a sales forecast example created using historical trends.
Sample 1: Sales Forecast Estimate Based on Web Traffic Conversion Last year, the ABC Online Store made $90,000 in revenue, had 2,000 customers, and 60,000 website visits. Based on their marketing plan for the new year, they expect to increase web traffic to around 80,000 visits, which, in turn, would be converted into new customers.
Assuming each new customer spends, on average, $50 per purchase and the conversion rate of 3% remains consistent, ABC Online Store can expect a revenue of $120,000.
Sales Forecast = [(No. of website visits x Conversion rate)] x (Price per unit)
(80,000 x 0.03) x $50 = 120,000
Use our calculator for a quick sales projection based on historical trends.
Sales Forecasting Calculator Based on Historical Trends
Let’s switch it up and say the business wants to predict how well it will do in terms of revenue during the busy season. In past years, the Q4 holiday season (October to December) accounted for 40% of revenue. Through September, it had made $80,000. Based on the consistent proportion of revenue generated in Q4, the business can expect total revenue for the year to be $133,333, with $53,333 done in Q4 alone.
Total Revenue Formula:
To calculate the expected total revenue for the year, we use the proportion of revenue made outside Q4.
Total Revenue = Revenue Through September / 1 – Q4 Proportion
Substituting the values:
Total Revenue = $80,000 / 1 −0.4 = $80,000 / 0.6 = $133,333
Q4 Revenue Formula:
To calculate the expected Q4 revenue, multiply the total revenue by the Q4 proportion.Q4 Revenue = Total Revenue × Q4 Proportion
Substituting the values:
Q4 Revenue = $133,333 × 0.4 = $53,333
Now let’s switch the factors of the known historical information. Imagine, after five years in business, ABC Online Store consistently makes 15% more than the previous year. There’s also a demand increase in the total market of 10%.
If ABC generated $150,000 last year, they could expect an increase of $22,500 (150,000 x 15%) due to standard growth and an additional increase of $17,250 due to new demand, for a total of $189,750.
Step 1: Calculate Standard Growth
To calculate the increase due to standard growth (15% increase from the previous year):
Standard Growth Increase = Last Year’s Revenue × Standard Growth Rate
Substituting the values:
Standard Growth Increase = $150,000 × 0.15 = $22,500
Add this to last year’s revenue to find the total after standard growth.
Revenue After Standard Growth = Last Year’s Revenue + Standard Growth Increase
Revenue After Standard Growth = $150,000 + $22,500 = $172,500
Step 2: Calculate Market Demand Increase
To calculate the increase due to market demand growth (10% increase from the adjusted revenue):
Market Demand Increase = Revenue After Standard Growth × Market Demand Growth Rate
Substituting the values:
Market Demand Increase = $172,500 × 0.10 = $17,250
Step 3: Calculate Total Revenue
Add the market demand increase to the revenue after standard growth to find the total expected revenue.
Total Expected Revenue = Revenue After Standard Growth + Market Demand Increase
Total Expected Revenue = $172,500 + $17,250 = $189,750
Multivariable Analysis Forecasting
Unlike simpler methods like historical trends, which focus on a single data point (like past sales or traffic), multivariable analysis allows businesses to account for several interdependent variables, like market conditions, seasonality, customer behavior, advertising spend, economic factors, and social media engagement.
This method uses advanced statistical models, often in the form of regression analysis or machine learning algorithms, to understand how different variables impact sales performance.
In general, the formula for a multivariable analysis-based sales forecast might look like this:
Sales Forecast = Base Revenue × (1 + ∑ Variable Impacts)
Where:
- Base Revenue is last year’s sales or current sales.
- Variable Impacts are the expected growth rates (calculated as percentages) for each factor, such as web traffic, conversion rate, advertising, and market growth.
For example:
Sales Forecast = 200,000 × (1 + 0.10 + 0.03 + 0.10 + 0.07) = 200,000 × 1.30 = 260,000
Multivariable analysis forecasting is ideal for businesses that experience dynamic market conditions or have multiple factors influencing their sales performance. Evaluating relationships between different variables can help business owners make more precise and dynamic forecasts. However, it requires access to detailed data and analytical expertise to implement effectively.
Sample 2: Sales Forecast Estimate Using Multivariable AnalysisLet’s consider a scenario where the ABC Online Store wants to predict its revenue for the upcoming year. They recognize that sales are influenced by multiple factors:
- Web traffic (which is expected to grow by 20%)
- Conversion rates (which typically fluctuate by 2% based on seasonal trends and marketing efforts)
- Advertising spend (which will increase by 15% compared with last year)
- Economic conditions (with a projected market growth of 5%)
Step 1: Identify Variables and Their Impact
Using historical data, ABC Online Store has identified the following relationships:
- A 10% increase in website visits typically correlates with a 5% increase in sales.
- A 2% increase in conversion rate translates to a 3% increase in sales.
- A 15% increase in advertising spend generally results in a 10% increase in sales.
- Market growth of 5% contributes to an additional 7% growth in sales.
Step 2: Calculate Base Revenue
Let’s assume ABC Online Store made $200,000 in sales last year. We’ll start by calculating the baseline revenue for the new year before adjusting for the factors.
Step 3: Factor in Expected Growth from Each Variable
Web Traffic Increase
Last year, they had 80,000 visits; with a 20% increase, they expect 96,000 visits. Given that a 10% increase in visits results in a 5% sales increase, a 20% increase should result in a 10% increase in sales.
Sales impact from web traffic: $200,000 x 0.10 = $20,000 (additional sales from traffic increase)
Conversion Rate Increase
Assuming the conversion rate increases by 2%, leading to a 3% sales increase, the expected revenue from this factor would be:
$200,000 x 0.03 = $6,000 (additional sales from conversion increase)
Advertising Spend Increase
With a 15% increase in advertising spend resulting in a 10% sales increase, the projected additional revenue would be:
$200,000 x 0.10 = $20,000 (additional sales from advertising increase)
Market Growth
Market conditions are expected to grow by 5%, and this is expected to contribute to a 7% increase in sales for ABC Online Store:
$200,000 x 0.07 = $14,000 (additional sales from market growth)
Step 4: Combine All Factors
Now, let’s add up the expected increases from all the variables.
- Base revenue: $200,000
- Sales increase from web traffic: $20,000
- Sales increase from conversion rate: $6,000
- Sales increase from advertising: $20,000
- Sales increase from market growth: $14,000
Total forecasted sales for the year = 260,000
Conversion-based Forecasting
A sales process that follows conversion rates of a sales pipeline or funnel can use conversion-based forecasting to estimate anticipated revenue. This is the best way to forecast sales in business-to-business (B2B) companies, usually finalized as deals.
Business-to-consumer (B2C) organizations can also use this method if they follow a typical sales cycle for closing deals. Ecommerce businesses can use it if they track website traffic, browsing, and purchasing rates. To calculate a sales forecast estimate based on the sales pipeline conversion rates, you can use the following formula:
Sales Forecast Estimate = Number of Leads x Deal Value x Conversion Rates at Each Stage
Here’s how it works step-by-step:
- Start with the total number of leads, including both the leads already in the funnel and any new ones expected to be added.
- Apply the conversion rates starting from the first stage (e.g., “Aware of the brand to interested in more information”) through to the final stage (e.g., “Considered to offer accepted/deal closed”).
- Estimate the expected revenue by multiplying the remaining leads at each stage by the deal value to forecast revenue.
Check the example scenario below to determine how conversion-based forecasting works:
Sample 3: Sales Forecast Estimate Based on Sales Pipeline Conversion Let’s take the example of ABC Management Consulting. The leadership team wants to estimate revenue based on deals, deal values, and its sales funnel conversion rates.
Going into the new year, it currently has 200 leads in the funnel and expects to generate 50 new leads throughout next year’s campaigns. There’s a total potential deal value of $6 million and the following conversion rates:
- Aware of the brand to interested in more information → 16%
- Interested in information to interested in receiving an offer → 50%
- Received an offer to considering/negotiating that offer → 60%
- Considered to offer accepted/deal closed → 75%
Based on the data above, ABC estimates that of the 250 total leads, 40 of them (16%) will be interested in more information. Of those interested, 20 (50%) will want to receive an offer through a proposal, and 12 of them (60%) will strongly consider the offer by negotiating some of the terms.
In the end, nine of the leads are expected to become ABC clients, which translates into a total deal value and sales prediction of $216,000. Here’s the step-by-step process, along with the formula:
- Total Leads = 250
- Leads Interested in More Information = 16% of 250 or 250 × 0.16 = 40
- Leads Interested in Proposals = 50% of the 40 interested leads or 40 × 0.50 = 20
- Leads Strongly Considering Offers = 60% of the 20 leads interested in proposals or 20 × 0.60 = 12
- Leads Who Become Clients = 75% of the 12 leads strongly considering offers or 12 × 0.75 = 9
Now, the Total Deal Value is given as $216,000. To get the Average Deal Value per Client, we divide the total deal value by the number of clients:
Average Deal Value per Client = $216,000 / 9 = $24,000
So, the formula used to determine the sales prediction involves multiplying the initial number of leads by each conversion rate (16%, 50%, 60%, and 75%) and then multiplying by the average deal value per client. Here’s a simplified version of the calculation:
Total Sales Prediction = 250 × 0.16 × 0.50 × 0.60 × 9 × $24,000
This gives the total deal value of $216,000.
Next, let’s look at conversion-based forecasting for a B2C ecommerce company. Using industry averages and their internal marketing knowledge, ABC Online Store believes its digital campaigns will reach 2 million views (awareness) over the next 12 months.
It also anticipates 10% clicking and viewing the online store (interested). From the website, 30% will likely browse for a solid amount of time (consideration), and 5% of those will actually make a purchase (decision).
Let’s assume each purchase is for one unit of what’s being sold for $100 each. Based on this, 3,000 purchases will be made for a total projected revenue of $300,000.
Sales Rep Knowledge
This is the least accurate of the sales predicting methods because it doesn’t rely on actual historical data or conversion rates. Instead, you depend on your sales team’s performance expectations, market intelligence, and confidence to project the number of deals they expect to close or leads they anticipate generating.
When companies must rely primarily on sales rep knowledge for revenue predictions, mitigating the associated risks involves establishing structured frameworks and enhancing data-informed decision-making. For instance, sales managers can standardize how sales reps report their projections. This ensures consistency in key sales metrics such as deal size, probability of closing, and expected timeline.
That said, a sales forecast estimate based on rep knowledge is instrumental in interpreting or reviewing sales projections generated from historical data or forecasted conversions. This is to see if it’s aligned with your typical business performance.
The formulas to calculate the Expected Deal Value for each opportunity and the Total Sales Forecast are as follows:
Expected Deal Value (EDV) = Forecasted Conversion Rate x Deal ValueTotal Sales Forecast = ∑ (Expected Deal Value for each deal)
For each deal, multiply the Forecasted Conversion (as a decimal, e.g., 30% = 0.30) by the Deal Value to get the Expected Deal Value.
Add up all the Expected Deal Values from each deal to find the Total Sales Forecast. Below is an example of sales prediction based on sales rep knowledge.
Sample 4: Sales Forecast Estimate Based on Sales Rep Knowledge A simple example of how this method would be used is if XYZ Company is having a meeting with its sales reps. The manager goes through a list of new business opportunities and asks a rep responsible for a lead to provide a confidence level of closing the deal and how much they expect the deal to be worth. They give the following responses:
| Opportunities | Forecasted Conversion | Expected Deal Value |
|---|---|---|
| Deal 1 | 30% chance for $50,000 | $15,000 |
| Deal 2 | 50% chance for $20,000 | $10,000 |
| Deal 3 | 90% chance for $5,000 | $4,500 |
| Deal 4 | 40% chance for $60,000 | $24,000 |
| Deal 5 | 30% chance for $40,000 | $12,000 |
| Deal 6 | 20% chance for $70,000 | $14,000 |
| Total Expected Deal Value | $79,500 | |
Formula:
Total Sales Forecast = ∑ (Expected Deal Value for each deal)
Substituting values:
Total Sales Forecast: $15,000 + $10,000 + $4,500 + $24,000 + $12,000 + $14,000 = $79,500
Moreover, this sales prediction method could be less probability-based and go exclusively on a “close” or “will not close” basis. For example, rather than asking for confidence levels, a manager could just ask for the estimated value and whether or not the rep thinks it will be closed within the time frame. Nevertheless, this method can motivate reps to prioritize closing deals, especially those who expressed high confidence that it would close.
Team Members Responsible for Sales Forecasts
While sales projections generally affect the whole company, taking the lead in generating them is part of the key aspects of sales management. However, each member involved in the sales and revenue chain must submit individual forecasts. Typically, sales reps, frontline sales managers, and sales leaders are responsible for predicting sales.
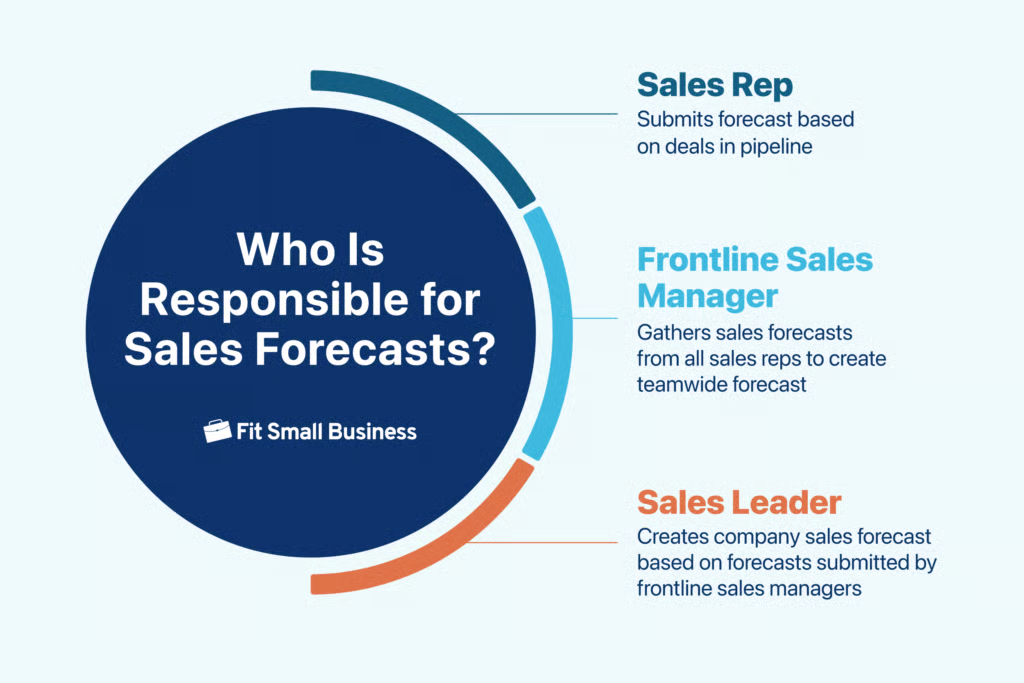
Sales representatives close deals, manage client relationships, and expand business opportunities. Additionally, they do the following:
- Submit forecasts based on the deals in their sales pipelines.
- Ensure the deal values they enter into their pipeline are accurate. This data serves as the foundation for the company’s sales predictions.
- Review their existing deals and opportunities with their managers to explore solutions to obstacles that could hinder their efforts to close a deal. Obstacles include the lack of budget or urgency from the prospect.
- Monitor the progress of opportunities and take action, such as sending templated follow-up emails or making phone calls.
Frontline sales managers could be account executives directly managing sales reps. Depending on the organization’s size and hierarchy, they typically report to a sales director, vice president of sales, or other leader. Frontline sales managers coach reps to help them estimate a realistic forecast and hit their quota for a given sales period.
Frontline sales managers gather sales projections from all their reps to create a teamwide forecast value. Then, they submit the forecast amount to the sales manager directly above them.
Sales leaders—typically directors of sales or chief revenue officers (CROs)—are quota-bearing, above frontline sales managers, and directly or indirectly manage the sales hierarchy. They are ultimately responsible for the company forecast based on the reports and numbers they receive from sales managers and reps. They also hold regular sales meetings and business reviews to ensure the team can hit its forecasts.
Top Challenges of Sales Forecasting
Salespeople commonly encounter hurdles or challenges that affect the accuracy of their sales prediction process. These can range from a subjective factor like seller bias to a broader category like economic issues. We have outlined the most common sales predicting challenges below so you can anticipate them and deal with them proactively.
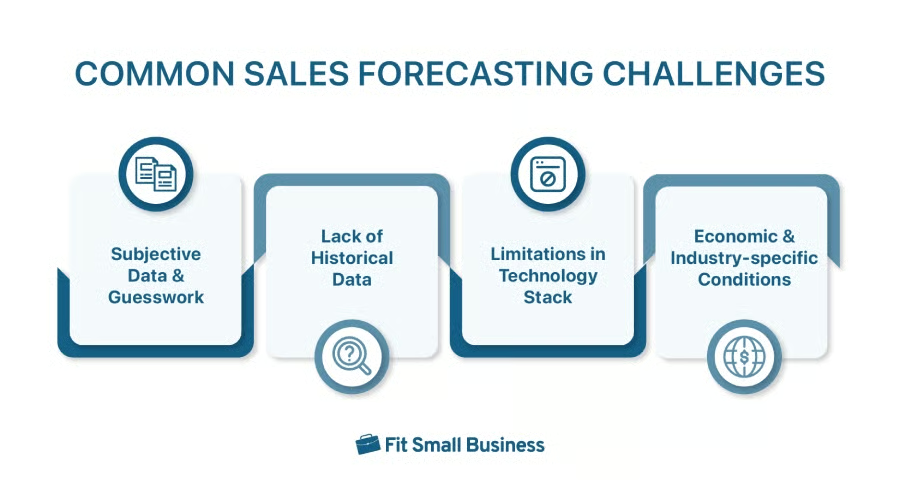
Subjective Data & Guesswork
Sales forecasts based on gut feelings can be unreliable, as they often overlook objective data that provide a clearer picture of deal probabilities. Relying on predictive analytics—tools that use historical data, customer behavior, and market trends—helps sales teams make more accurate, data-driven forecasts.
The global market for predictive analytics is expected to reach $61.9 billion by 2032, showing the increasing importance of data in decision-making. With predictive analytics, sales teams can improve forecasting accuracy and make smarter decisions that drive better results.
Lack of Historical Data
Lack of access to historical CRM or performance data is a major roadblock to accurate forecasting, says 66% of revenue teams surveyed in an Xactly benchmarking report. Newly established businesses often lack sufficient historical data to base their forecasts. In this situation, you can rely on market and competitive research when creating estimates. Moreover, you can generate two revenue projections based on optimistic and pessimistic numbers and then update them with actual data as time progresses.
Limitations in Technology Stack
Creating an accurate sales forecast is time-consuming, especially when done manually. So mobile apps and user-friendly websites are essential tools for sales teams to update forecasts on the go.
If you have several tools for sales management, the main challenge here lies in the seamless integration between the apps your team is using. Ensuring that your tech stack is integrated and user-friendly is key to turning these systems into valuable assets.
Economic & Industry-specific Conditions
Any industry can be affected by general changes in the economy, such as those involving inflation, supply chains, and labor supply. Sometimes, forecasts could be affected by seasonality and the buyer behavior trends during specific time periods. It’s important to consider these factors and understand how they impact your profitability when you make your revenue estimates.
Sales Forecasting Best Practices
Forecasting sales offers many advantages, especially in providing businesses with accurate visibility of their upcoming performance. However, it must be done correctly to reap the benefits. Below, we share some of the best practices that sales teams should follow when making sales forecasts.

Have a Proper & Consistent Forecasting System
Over 50% of revenue leaders in the Xactly report have missed a forecast at least twice in the past year, with many reporting significant discrepancies, highlighting the need for more consistent forecasting. An established system ensures you process the correct data while using the same system consistently for more accurate forecasts.
Use Current & Updated Sales Data
As the volume of data grows rapidly, with global data creation expected to exceed 394 zettabytes by 2028, the need for real-time data sync becomes even more critical for effective decision-making. Therefore, ensuring you use only the most updated data is crucial.
For example, regularly updating your pipeline and opportunities lessens overestimating your incoming revenue. Investing in a robust CRM system can help you ensure you always have current sales data.
Put Proper Team Collaboration in Place
Collaboration is crucial for successful revenue forecasting. 97% of leaders in the Xactly report agree that sales teams must work more effectively. Team collaboration helps ensure that different perspectives are considered, allowing members to spot areas others might miss.
Moreover, having the sales team manager review forecasts increases the chances of accuracy and correctness, making teamwork an essential part of the forecasting process.
Complement Software Usage With Human Knowledge
While forecasting sales lowers instances of inaccuracy, having an actual sales agent review and interpret the data gives businesses a more holistic and realistic view of their sales forecasts. Plus, you can leave the high-level tasks to your sales teams and let your CRM and other tech tools handle the mundane, repetitive tasks.
However, most sales reps forget sales training knowledge in about three months. Organizations with highly effective training often combat this with mentorship and coaching. In fact, 35% of organizations strongly encourage mentorship and coaching as a vital part of effective sales training to help reinforce key concepts and ensure that reps continue to build on their knowledge.
We highly recommend sales reps undergo continuous sales training in revenue forecasting. Aside from regular coaching sessions, sales leaders must dedicate themselves to finding training opportunities for reps, either through virtual or in-person training.
For example, virtual training platforms like Coursera or LinkedIn Learning offer courses on data analysis, sales forecasting, and CRM optimization. We recommend in-person training workshops led by industry experts, such as seminars on sales pipeline management or advanced forecasting techniques.
Features to Look for in Sales Forecasting Software
Sales forecasting is critical for businesses to optimize resources, streamline operations, and drive revenue growth. You can choose from a standalone revenue forecasting tool or a CRM-integrated solution. Below are key features to consider when choosing a sales predicting system for your small business.
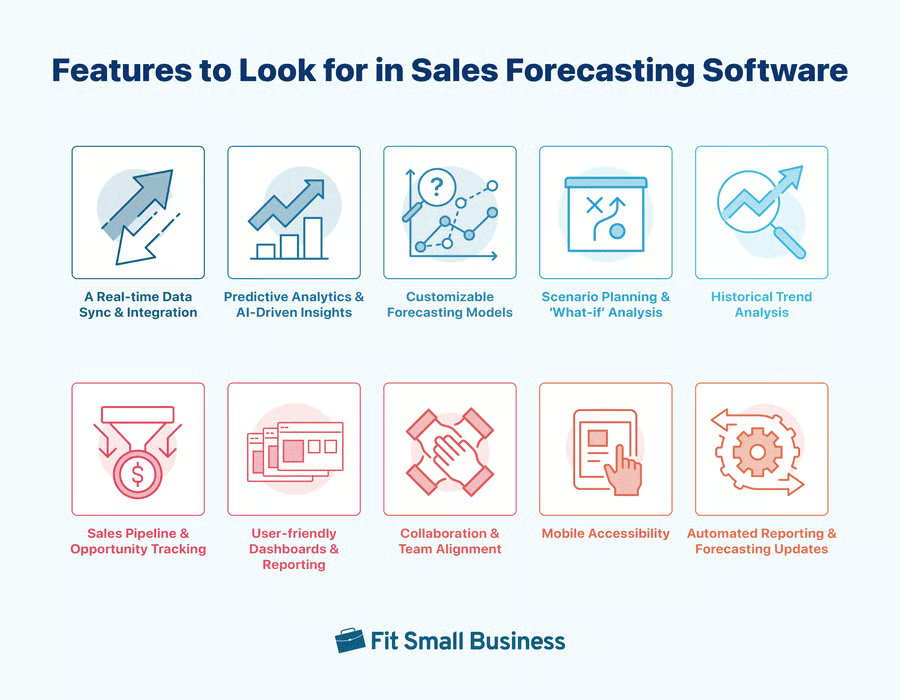
A Real-time Data Sync & Integration
Many standalone forecasting tools provide real-time sales updates. As data grows rapidly, integrated tools like CRMs with forecasting features can help you predict trends more accurately for effective sales planning.
Predictive Analytics & AI-Driven Insights
Predictive analytics and AI-driven insights are important in sales predicting software because they enable more accurate, data-driven predictions. This helps businesses optimize decision-making, resources, and growth strategies. Standalone tools with predictive models provide valuable insights for accurate sales predicting, while CRM tools enhance these predictions by leveraging customer and pipeline data already stored in your CRM.
Customizable Forecasting Models
Businesses have different sales cycles and processes. If you want a sales forecasting system that best works for your business, choose one with customization options. Standalone revenue forecasting software should allow you to adjust time frames, set custom metrics, or tailor methodologies according to your business needs. CRM-integrated solutions offer customization that mirrors your pipeline stages, ensuring forecasts match your unique sales process.
Scenario Planning & ‘What-if’ Analysis
Scenario planning and “what-if” analysis help businesses see how changes in pricing or market conditions can affect sales. While standalone forecasting tools offer this, CRM-integrated tools use data like lead quality and rep performance to create even more accurate forecasts, reducing errors.
Historical Trend Analysis
Many standalone sales predicting tools allow you to examine historical sales data, identifying trends, seasonality, and patterns that can inform future predictions. CRM-integrated forecasting tools enhance this feature, giving you access to detailed insights based on past customer interactions, deal progress, and conversion rates.
Sales Pipeline & Opportunity Tracking
An effective sales forecasting tool should provide clear visibility into your sales pipeline and track opportunities at various stages. While standalone tools allow easy deal tracking by importing data from your CRM or other systems, CRM-integrated forecasting software offers deeper insights. A revenue forecasting CRM reveals the exact stage of each deal and its likelihood of closing, thereby enhancing forecast accuracy.
User-friendly Dashboards & Reporting
Visualization tools such as dashboards and reports are key to interpreting sales data quickly and effectively. Sales forecasting software should provide customizable, user-friendly dashboards to view and analyze key metrics quickly. CRM-integrated forecasting software is equipped with detailed and comprehensive reports to help sales teams make data-driven decisions at a glance.
Collaboration & Team Alignment
Sales forecasting often involves multiple stakeholders, from sales reps to management, making collaboration features essential. With shared views, notes, and comments, sales team members stay aligned on the forecasting process. Many CRM systems enhance collaboration by offering shared pipelines, task assignments, and communication features. It ensures your entire sales process is transparent and collaborative.
Mobile Accessibility
Mobile accessibility is a must-have feature in any modern forecasting tool. Using a CRM system with revenue forecasting on mobile ensures timely, accurate tracking of sales predictions wherever team members are. Sales reps and managers can access real-time data, update forecasts, and make informed decisions on the go, enhancing flexibility and responsiveness.
Automated Reporting & Forecasting Updates
Automation plays a key role in reducing manual work and ensuring timely updates. Sales forecasting software offers automated reporting capabilities that generate reports on a regular schedule or based on specific triggers, such as changes in sales data. If you want to take automation a step further, you can automatically update forecasts based on sales pipeline data using CRM software.
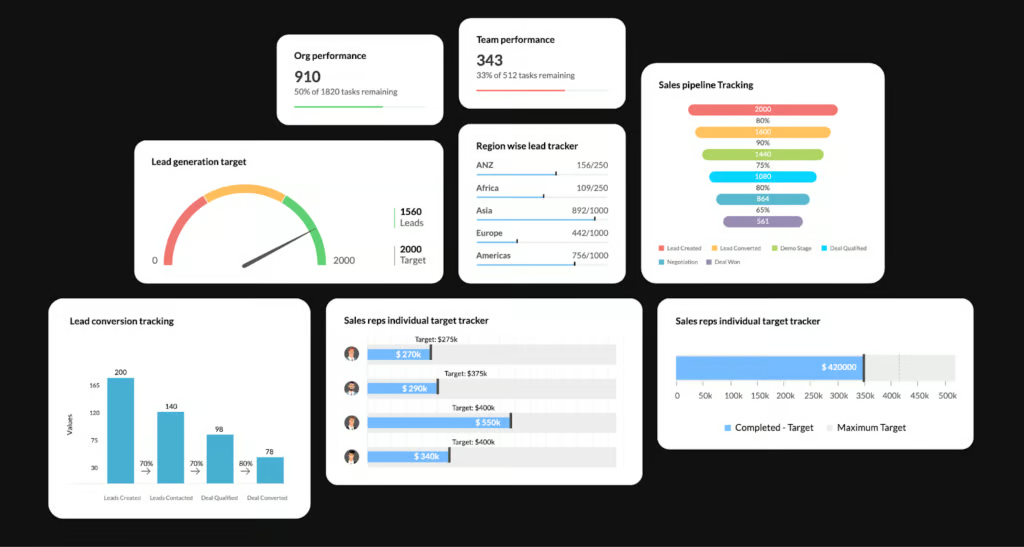
Use your CRM software to track sales pipeline or funnel stage conversion rates. Zoho CRM, for instance, takes data stored in your customer relationship management (CRM) system, including the number of leads and stages of each lead, and shows you the conversion rates. The information is presented on Zoho’s dashboard and can be broken down further by the location of a lead, sales stage, and lead source.
Frequently Asked Questions (FAQs)
What is an example of sales forecasting?
Sales forecasting involves predicting future sales based on historical data and market trends. For example, a company might analyze sales data from the past three years and use it to predict the number of units it will sell in the next quarter. This helps sales teams plan inventory, set realistic goals, and allocate resources effectively.
What is the best method to forecast sales?
The best method to forecast sales depends on the business and data available, but a common approach is the time series analysis. It uses historical sales data to identify patterns, trends, and seasonality, allowing for more accurate predictions. If you have complex variables, regression, or multivariate analyses, refine forecasts.
How do you calculate a sales forecast?
Calculate a sales forecast by analyzing historical sales data to identify trends and seasonal patterns. Combine this data with market research, considering factors like industry growth, competitor performance, and economic conditions. Finally, adjust the forecast based on internal factors such as upcoming product launches, marketing plans, or changes in pricing.
What are the 4 steps to preparing a sales forecast?
The four steps to preparing a sales forecast are as follows:
- Review past sales figures to identify trends, patterns, and seasonality.
- Research current industry trends, competitor performance, and economic factors.
- Consider company-specific factors like product launches, promotions, and capacity changes.
- Apply an appropriate method, such as trend analysis, market potential, or sales team input, to predict future sales.
How do you start a sales forecast?
First, review historical sales data to identify trends and seasonality. Next, gather insights on market conditions, including industry growth, competitor performance, and economic factors. Incorporate internal elements like planned promotions or new product launches. Finally, choose a forecasting method to project future sales based on the data and factors you’ve gathered.
Bottom Line
Sales forecasting estimates future sales to provide valuable insights for more informed decision-making based on supply chains and other core business operations. This foundational sales activity is important in resource allocation, lead assignment, and sales territory management. Understanding the different methods, best practices, and tools for revenue prediction streamlines the sales process and strengthens sales management for attaining revenue goals.