

Amazon is the leading online retailer worldwide, and selling on Amazon is a lucrative venture for many independent sellers—either as a standalone business or a supplement to your own online store.
We’ve gathered more than 40 Amazon statistics that can help you start your Amazon business or take your existing Amazon store to the next level.
Amazon Statistics Overview

1. Amazon is forecast to reach $491.65 billion in sales in 2024
According to eMarketer, Amazon will continue to dominate the online retail space, generating $491.65 billion in global retail ecommerce sales this year. It remains larger than all 14 of its closest competitors, accounting for 37.6% of the US ecommerce retail market.
2. Amazon earned $575 billion in 2023
Amazon hit a net sales of $575 billion in 2023, up from $514 billion in 2022—a 10.6% increase. About $131 billion of that was from international sales.
3. Amazon is the most visited online marketplace in the US
Amazon gets 2.6 billion monthly visits, more than triple the monthly visits of eBay, which trails behind at second place with close to 595 million monthly visits. Of the traffic to Amazon, 84.3% comes from the US.
4. At 46%, nearly half of US-based Amazon sellers also sell internationally
Nearly half (46%) of Amazon merchants that operate in the US also have business operations in at least one additional international marketplace. Top international marketplaces include:
- Canada
- United Kingdom
- France
- Germany
- Mexico
- Italy
- Australia
- Spain
- India
Amazon Sellers
5. More than 100,000 new brands started in 2023
If you want to know how many sellers on Amazon, the answer is tons. In fact, Amazon saw the debut of more than 100,000 new independent sellers on its marketplace in 2023 alone.
6. Profits increased in 2023 for 27% of SMB sellers
According to JungleScout’s 2024 State of the Amazon Seller report, 27% of SMB sellers that sell on Amazon experienced an increase in profits in 2023 compared to 2022, and 62% of enterprise brands had the same experience. Meanwhile, profits decreased for just 12% of SMB sellers and 35% of enterprise sellers.
7. Most merchants spend between $1,000 and $5,000 to get started
When it comes to launching on Amazon, startup costs vary. According to JungleScout, this ranges from $1,000 to $5,000 for 64% of merchants. About 25% of merchants spend less than $1,000.
8. Eight out 10 Amazon sellers are self-funded
From the same report, most Amazon sellers (81%) fund their own business ventures. In fact, 81% are self-funded or “bootstrapped.” Other top funding sources for launching on Amazon include:
- Credit card (23%)
- Personal loan (10%)
- Business loan (7%)
- Family loan (6%)
- Amazon lending (4%)
- Employer funds (4%)
- SBA or government loan (3%)
- Crowdfunding (3%)
- Fintech lending (1%)
9. A majority of sellers (74%) are up and running in less than 6 months
While it costs varying amounts of money to start an Amazon business, 74% of merchants are typically up and running in under 6 months, per JungleScout. About 26% take three to six months to launch, 25% 6 weeks to 3 months, 23% less than 6 weeks, and 19% between 6 months and a year. Only about 6% of merchants take longer than a year to launch.

10. About 31% of sellers spend 4 to 10 hours a week on their Amazon business
Post-launch, Amazon merchants also spend varying amounts of time managing their business. JungleScout estimates around 31% spend 4 to 10 hours per week, 21% spend 11 to 20 hours per week, and 19% spend less than 4 hours per week. Another 12% spend 21 to 30 hours per week managing their Amazon business. Only about 11% spend more than 40 hours per week on it.
11. Most merchants earn a profit in less than a year
The JungleScout report found that 58% of merchants earn a profit in under a year while about 22% do in as little as three months. However, another 22% of merchants report that they have never been profitable.
12. Nearly 50% of SMBs have lifetime profits of less than $25,000
According to the same report, about 47% of SMB sellers have lifetime profits of less than $25,000. Only about 6% of SMB sellers have exceeded $1 million in lifetime profits.
Comparatively, enterprise and retail brands that sell on Amazon have had a lot of success on the marketplace, earning an average lifetime profit of more than $1 million.
13. Nearly half of Amazon sellers earn a profit margin of more than 15%
JungleScout found that 2023 was more profitable than 2022 for about a quarter of Amazon merchants. About 44% of SMB sellers have profit margins exceeding 15%, while around 62% of enterprise and retail brands have the same.
14. A notable 45% of Amazon sellers are motivated to be their own boss
The main motivation for selling on Amazon is the goal to be their own boss for 45% of merchants, according to JungleScout. Another 41% are motivated by extra income, 40% by flexibility to work and travel, 31% because it’s already part of their job, and 31% to feel successful and accomplished.
Regardless of the motivation, about 70% say they wish they had started sooner.
15. Financial management was the main focus for 70% of SMB sellers in 2023
Per the same report, 2023 was a year for getting on top of the books for SMB sellers. About 70% say financial management was their main focus for 2023. Other focuses include:
- Product research (69%)
- Inventory management (66%)
- Listing optimization (65%)
- PPC management (61%)
16. Brand owners grew sales more than 22% year-over-year
Amazon reports that brand owners grew sales more than 22%, with US-based sellers exporting over 330 million products globally.
17. About 48% of Amazon sellers have used AI to help manage their business
According to the JungleScout report, nearly half of Amazon sellers have tapped into AI or AI-powered tools to manage their ecommerce operations.
The most common ways include:
- Writing and optimizing listings (34%)
- Creating marketing and social media content (14%)
- Keyword and SEO research (7%)
- Product research (6%)
- Customer service (6%)
- Product images (6%)
18. The majority of sellers use Amazon FBA
JungleScout found that most (82%) merchants use Amazon FBA. Another 34% use FBM, or fulfillment by merchant. 64% use FBA exclusively and 14% use FBM exclusively, while 22% use a combination of both.
19. Seller inventory increased by more than 55 million cubic feet
In Amazon’s warehouses, a lot of space is dedicated to seller inventory. This amount of space grew by more than 55 million cubic feet in 2023.
20. eBay is the top alternative to Amazon for sellers
Per JungleScout, among sellers seeking alternatives, eBay takes the number one spot. Other top contenders include Shopify, Walmart, Etsy, Facebook Marketplace, Instagram, and Alibaba.
21. One in five Amazon sellers (20%) plan to explore TikTok
An emerging competitor for Amazon is TikTok—of interest to about one-fifth of Amazon merchants. Learn more about selling on TikTok.
Amazon Independent Seller (3P) Statistics
22. A substantial 68% of merchants are 3P sellers
Of Amazon merchants, about 68% are 3P sellers and 40% are 1P sellers. As many as 9% sell as both a 3P seller and a 1P seller.
23. More than 60% of Amazon sales are from independent sellers
The 2023 Small Business Empowerment Report says that US independent sellers account for more than 60% of Amazon store sales—which are mostly small and midsize companies. Among small businesses, many sellers are women, Hispanic, Black, and military family-owned.
24. More than 10,000 independent sellers made more than $1 million in sales
For the first time ever, more than 10,000 independent sellers exceeded $1 million in sales in Amazon’s store in 2023.
25. US independent sellers sold 4.5 billion products in 2023
According to the Small Business Empowerment Report, US independent sellers sold more than 4.5 billion products in 2023. That’s about 8,600 items every minute. As an Amazon seller, you need to know about Amazon fees. Learn the cost of selling on Amazon.
26. Health and personal care products are the top-selling products for independent sellers
Per the Small Business Empowerment Report, the top best-selling categories for US independent sellers on Amazon are the following: health and personal care, beauty, home, grocery, and apparel.
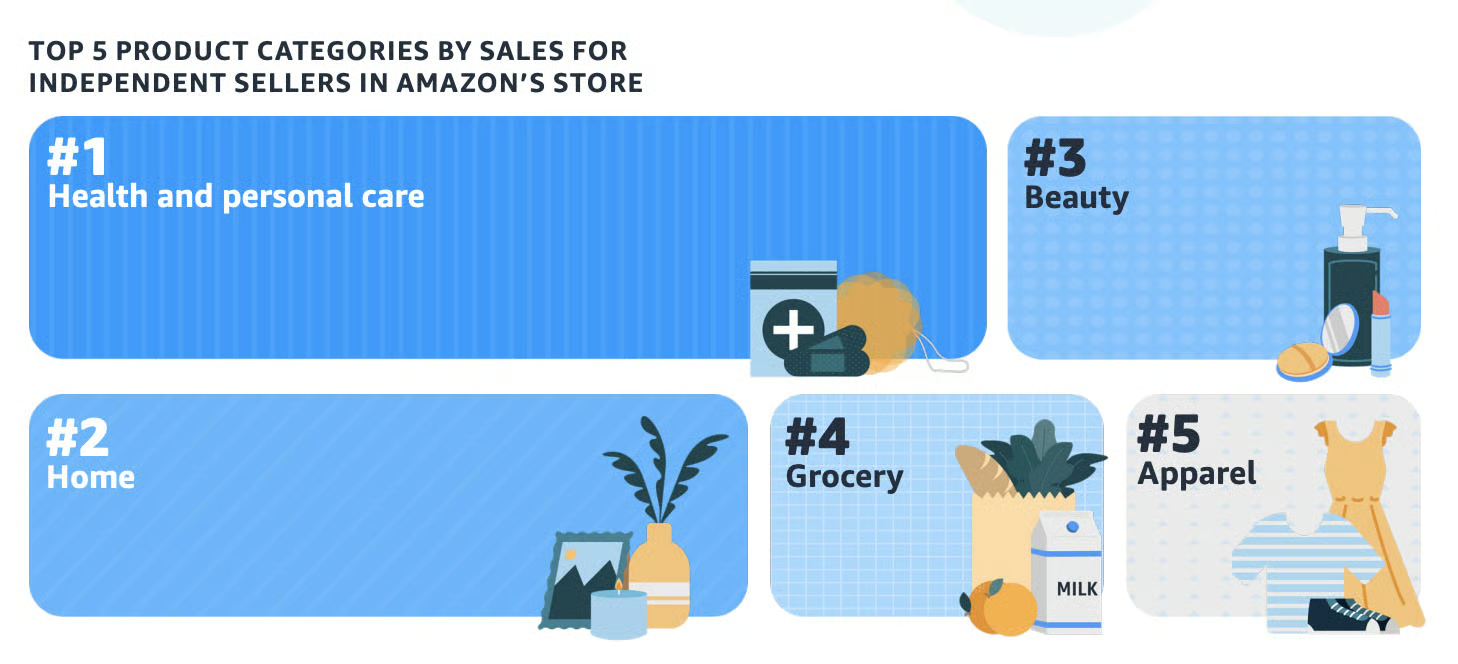
(Source: Amazon’s Small Business Empowerment Report)
Amazon Customer Demographics
27. A third of visitors to the Amazon website are 25 to 34 years old
Amazon visitors are all ages, with 25 to 35-year-olds making up the biggest group. Here’s how it breaks down:
- 25 to 34 years old: 29.33%
- 35 to 44 years old: 19.83%
- 18 to 24 years old: 16.12%
- 45 to 54 years old: 15.52%
- 55 to 64 years old: 11.82%
- 65+ years old: 7.38%
28. There’s a nearly 50/50 split between male and female visitors to Amazon
Amazon’s website traffic is 53% male and 47% female—nearly split down the middle.
How People Shop on Amazon
29. More than half of US consumers start their product searches on Amazon
When searching the internet for products, most consumers start on Amazon. It’s the first search destination for 59% of consumers.
30. Amazon sales hit $9.6 billion during Black Friday 2023
Amazon is a top choice for Black Friday and Cyber Monday shopping, according to JungleScout. In 2023 alone, Black Friday sales amounted to $9.6 billion and Cyber Monday sales totaled $12 billion. More than 500 million items were sold during this period.
31. The majority of consumers (74%) use Amazon for holiday shopping
For the 2023 holiday season, just under three-quarters of consumers said they primarily used Amazon to do their holiday shopping as the top channel. Other channels included:
- Walmart: 12%
- Search engine: 7%
- Target: 3%
- Direct from a brand’s website: 3%
- eBay: 2%
- Social media: 1%
Popular Amazon Products & Categories
32. Over half (61%) of Amazon products are priced between $16 and $50
In terms of pricing, most products for sale on Amazon are priced somewhere between $16 and $50. Here’s how it breaks down:
- $16 to $20: 18%
- $11 to $15: 16%
- $21 to $25: 16%
- $26 to $30: 15%
- $31 to $50: 13%
- $6 to $10: 9%
- $51 to $100: 5%
- Less than $5: 4%
- More than $100: 1%
33. The majority (89%) of businesses carry fewer than 50 products on Amazon
Small businesses don’t tend to have a large product catalog on Amazon. Per JungleScout, the number of SMB sellers with just one product in 2024 increased by 300% compared to 2023. About 26% of merchants have just one product. Another 14% have 6 to 10 products, 13% have just two products, and 11% have just three products. Just 6% have more than 100 products. It seems like “more” isn’t necessarily “better.”
34. Approximately 17% fewer sellers source products from the US
Many Amazon sellers are diversifying their suppliers. According to JungleScout, about 17% fewer merchants are using US-based suppliers. Many are turning to places like India, Vietnam, and Belgium to source products.
35. The most popular categories for SMB sellers are home & kitchen, beauty & personal care, and apparel
Per JungleScout, here are the most popular categories on Amazon, with the percentage of independent and SMB sellers who have listings for them, broken down below.
| Amazon Product Categories | Percentage of Amazon Sellers That List Items per Category |
|---|---|
| Home and Kitchen | 35% |
| Beauty and Personal Care | 26% |
| Clothing, Shoes, and Jewelry | 20% |
| Toys and Games | 18% |
| Health, Household, and Baby Care | 17% |
| Sports and Outdoors | 16% |
| Baby | 16% |
| Electronics | 16% |
| Arts, Crafts, and Sewing | 14% |
| Books | 14% |
The most popular categories for enterprise brands are appliances; beauty & personal care; clothing, shoes & jewelry; arts, crafts, & sewing; and automotive parts.
Find out what products to sell on Amazon.
36. More than half (54%) of sellers offer private label products
According to the JungleScout report, private labeling is the top business model for Amazon entrepreneurs. Here’s how it stacks up:
- Private label: 54%
- Wholesale: 25%
- Retail arbitrage: 25%
- Online arbitrage: 21%
- Dropshipping: 19%
- Handmade: 9%
- Original product: 4%
Amazon Prime Statistics
37. There will be more than 180 million Amazon Prime members
It’s forecast that there will be more than 180 million Prime Day subscribers in the US by the end of 2024. This is 11.2 million more people than in 2022, which saw 168.3 million subscribers.
38. Buy with Prime boosts conversions by 25%
Amazon’s “Buy with Prime” feature can drive a 25% increase in conversions. As many as 75% of Buy with Prime orders are from new customers.
39. Buy with Prime orders arrive 50% faster than with other retailers
Buy with Prime orders also ship fast. In fact, they have a 50% faster “click-to-door speed” than purchases made with other retailers, per the Small Business Empowerment Report.
40. Buy with Prime can boost holiday sales by 300%
During the holidays, Buy with Prime can also support sales. It drove a 300% increase in purchases during Cyber Week in 2023.
41. Sellers with Reviews from Amazon boost conversions by 38%
The Reviews from Amazon feature can also boost conversions by as much as 38%. Reviews serve as social proof for other potential buyers. These reviews also drive a 34% increase in revenue per visitor.
Related: Amazon Prime Day Statistics
Amazon Advertising
42. Increasing ad costs are the top challenge for Amazon merchants
About 38% of merchants say increasing ad costs are their top challenge. Amazon merchants say they have many other challenges too, including (in order):
- Increasing ad costs (38%)
- Increasing shipping costs (37%)
- Increasing cost of goods (35%)
- Increasing competition driving down prices
- Rising storage fees (32%)
- Amazon changing search results to favor paid vs. organic
- Inflation (29%)
- Amazon’s changes to its policies and Terms of Services
- Constant need for more capital to sell inventory
- Keeping up with relevant knowledge to sell online
- Recession (23%)
43. Most Amazon merchants advertise on or off Amazon
Per the same JungleScout report, 84% of Amazon merchants advertise somewhere, be it on Amazon, off Amazon, or a combination of both. Paid search and pay-per-click (PPC) are the top advertising channels of choice.
Here’s how it breaks down for SMB sellers:
- Ecommerce platforms (58%)
- Social media (42%)
- Search engines and paid search (34%)
- Traditional media (7%)
44. Nearly half of Amazon SMB sellers have a budget of less than $500 per month for advertising
According to JungleScout, when it comes to SMB sellers, about 47% spend less than $500 per month, while 25% of enterprise brands and retailers spend $100,000 to $250,000 each month. There’s a stark difference in Amazon advertising budgets for SMBs and enterprises.
45. Facebook ads are the top social advertising channel of choice
Amazon merchants also advertise on social media channels. And, per the same JungleScout report, about 18% have worked with influencers. The social ad channel breakdown for SMB merchants is as follows:
- Facebook ads (71%)
- Instagram ads (62%)
- TikTok ads (32%)
- YouTube ads (30%)
- Pinterest ads (17%)
- LinkedIn ads (11%)
- Branded YouTube channel (11%)
- Snapchat ads (6%)
46. Prime Day increases ad spend
Many merchants boost Amazon ad spend leading up to and during Prime Day. In 2024, Sponsored Products was the most popular format, growing 29% from 2023 to make up more than 80% of ad spend. Clicks increased by 15% and cost-per-click (CPC) by 12%.
Sponsored Brands ad spend increased 10% compared to 2023’s Prime Day, and clicks decreased by 4% with an increase in CPC of 15%.
Sponsored Display ads saw a 26% decrease in ad spend compared to 2023.
Bottom Line
We continue to be impressed with Amazon’s staggering statistics. What makes it more impressive is that even with the abundance of sellers on the platform, a majority continue to operate and remain profitable, even expanding their businesses to other platforms. On top of that, there is still room for budding retailers to start selling.
Orient yourselves with these Amazon sales statistics we have provided to help plan for the launching of your Amazon store.