Call abandonment rate is the percentage of incoming calls terminated before a customer speaks to a live customer service representative. A high abandonment rate indicates that callers may be waiting too long in the call queue, experiencing connection problems, or not getting the information they need from the interactive voice response (IVR) system. In this article, we’ll take you through the steps on how to calculate the call abandonment rate.
Call Abandonment Rate Calculation Steps
Step 1: Check the Total Number of Inbound Calls
The first step in call abandonment rate calculation is taking the number of calls received at a given period, say, weekly, quarterly, or annually. Exclude short abandoned calls or calls disconnected within the first five to 10 seconds. It’s safe to assume that these aren’t relevant customer queries, as the party on the line likely dialed the wrong number and realized the mistake only when the call got connected.
Step 2: Subtract the Number of Handled Calls From the Number of Inbound Calls
The second step in calculating call abandonment rate is deducting the number of handled calls from the number of inbound calls. Remember that a transferred call is equivalent to one handled call only.
Some make the mistake of double-counting calls when a representative picks up an inquiry and then directs it to another department or agent. Set aside the difference between the number of handled calls and the number of incoming calls, as this will be the dividend in the percentage equation later.
Step 3: Subtract the Number of Short Abandoned Calls From the Number of Inbound Calls
Next, deduct the number of calls abandoned in five to 10 seconds from the total number of inbound calls. The difference will be the divisor in the call abandonment rate calculation.
Step 4: Divide the Differences
Take the difference you got from the second step and divide it by the difference from the third step. After getting the quotient, convert that decimal figure to percentage by multiplying it by 100. The result is the call abandonment score.
Call Abandonment Rate Formula, Example & Calculator
The essential steps in calculating the call abandonment rate can be summarized and simplified into an equation. Use the abandon rate formula below:
Call abandonment rate | = | CR - CA - CH | ✕ | 100 |
CR - CA |
- CR = Total number of calls received
- CA = Number of calls abandoned in five seconds or less
- CH = Number of calls handled
Let’s apply the formula to a sample call center scenario. In a week, you received 10,000 calls, 1,000 were abandoned within five seconds, and 8,000 were handled successfully. Here’s what the equation would look like:
Call abandonment rate | = | 10,000 - 1,000 - 8,000 | ✕ | 100 |
10,000 - 1,000 | ||||
= | 1,000 / 9,000 = 0.11 | ✕ | 100 | |
= | 11% |
In this example, the call center abandonment rate is 11%. If you want to avoid manual computations and ensure accurate results, use the abandon rate calculator below.
Call Abandonment Rate Benchmarks
The 11% rate above is higher than the average figure. The general call center abandonment rate benchmark recorded in 2020 is 5.91%, as mentioned in the 2021 Talkdesk Global Center KPI Benchmarking Report. However, it’s also worth noting that the ideal number for this call center metric depends on your industry. Below is a list of the average abandonment rates for different industries in 2020:
Industry | Average Abandonment Rate |
|---|---|
Agriculture | 6.42% |
Consumer & Professional Services | 6.59% |
Financial Services & Insurance | 6.85% |
Government & Public Sector | 7.44% |
Healthcare | 6.91% |
Hospitality | 5.81% |
Manufacturing | 5.41% |
Media & Communications | 5.36% |
Mining, Oil & Gas | 3% |
Retail, Ecommerce & Consumer Goods | 6.17% |
Telecommunications | 6.28% |
Transportation & Logistics | 7.40% |
Effective Ways to Improve Abandonment Rate
A high abandonment rate often points to long waiting times in queues. Customers hang up and leave the call unsatisfied, still needing support. Remember, the acceptable abandon rate in a call center is 5% to 8%. If your rate is above 8%, here are some action steps to take to create a better customer experience:
1. Revisit Your Staffing Availability & Schedule
The simplest reason people wait longer in queues is that there’s not enough staff available to attend to them. Thus, the most straightforward solution to a high call abandonment rate is to add more agents. While this could mean hiring more people, other times, it’s as simple as adjusting schedules and making sure you have the most agents onboard during peak seasons.
For example, when you have a major company event, a product launch, or an announcement of a price increase, expect to see a spike in calls as more customers inquire about it. Reduce instances of call abandonment by having additional agents working during these scenarios.
Most call center platforms feature workforce management (WFM) tools, which help you strategically allocate human resources for specific events. Nextiva Contact Center’s WFM, for instance, offers multi-skill, multi-channel staffing forecasts and allows you to create more effective employee schedules. Learn more about the contact center provider in our Nextiva Contact Center review.
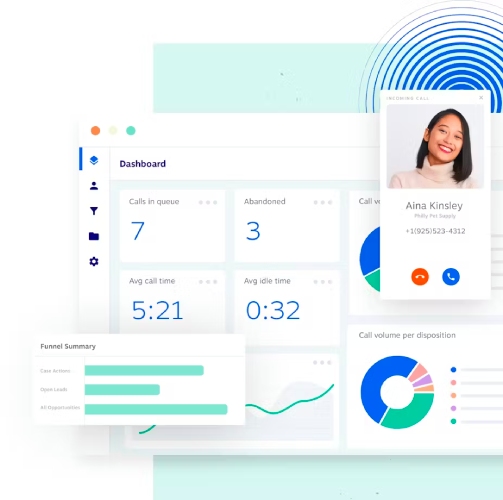
View the number of abandoned calls and other metrics on Nextiva’s real-time dashboard. (Source: Nextiva)
2. Retrain & Support Agents to Reduce Handling Time
The average handling time (AHT) affects call abandonment scores because when agents take a long time to talk to a customer and resolve issues, they have less time to handle other incoming calls. That said, revisit your call handling practices. Review call recordings, identify areas of improvement, and then craft a coaching plan.
Aside from retraining agents, equip them with the necessary resources. Integrate the customer relationship management (CRM) system with the call center phone system so agents will better understand the context of customer issues and speed up resolution.
RingCentral Contact Center features CRM adapters, which make connectivity between platforms easier and faster. Some supported apps are Salesforce, Microsoft Dynamics, ServiceNow, and Zendesk. Our RingCentral Contact Center review should help you decide if it’s the right solution for you.
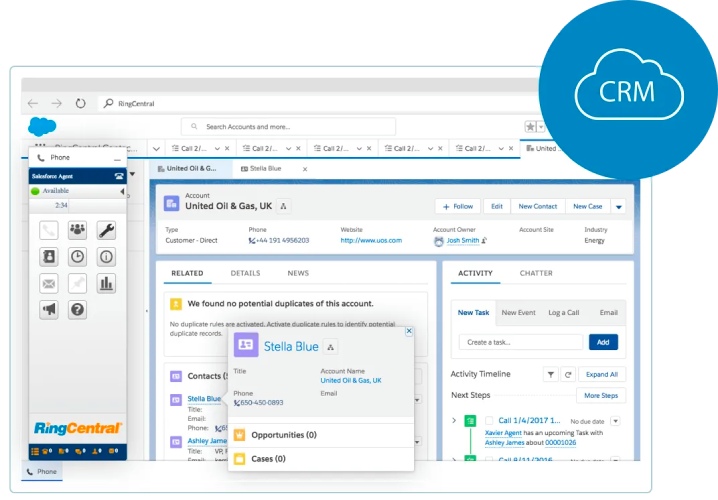
See customer profiles on RingCentral for faster resolution of concerns. (Source: RingCentral)
3. Inform & Entertain Callers While Waiting
While customers don’t like being put on hold, they don’t mind waiting if it’s a pleasant experience. Thus, make every effort to create a better customer experience even during wait times. Update them on what number they are in the queue to manage expectations. Change the hold music, choosing beats that uplift the mood.
Customer service platform Zendesk allows easy incorporation of music on hold into their system. It also commissioned professional musicians to create great hold music for customers’ listening pleasure. Know more about the features of this platform in our in-depth Zendesk review.
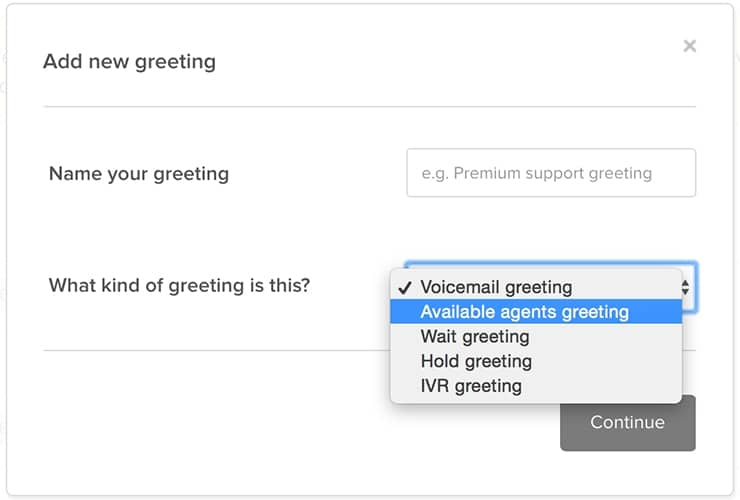
Customize greetings by configuring Zendesk settings. (Source: Zendesk)
4. Implement Automatic Callbacks
This strategy is most effective during high call volume periods. By offering callbacks, customers can do away with waiting on hold and dropping calls. An offer message goes like this, “Instead of waiting on hold, press 1 to get a callback.” Be mindful of when to present this message. Playing it after the average hold time will be useless since most customers won’t hear the option.
Review the number of abandoned calls and other call center metrics, like average time in queue, to determine how long customers are willing to wait. From there, determine the best time to present the callback offer message. Vonage Contact Center is equipped with queued callbacks, allowing customers to hang up their phones after waiting for a certain period in the queue and get a callback at the same time their initial call would have been answered.
You have the option to configure the settings in a way that your customers can give an alternative number they prefer to be called on. This benefits clients who are on the go and want to be contacted on their mobile phones. To learn more about the platform’s valuable features, refer to our comprehensive Vonage Contact Center review.
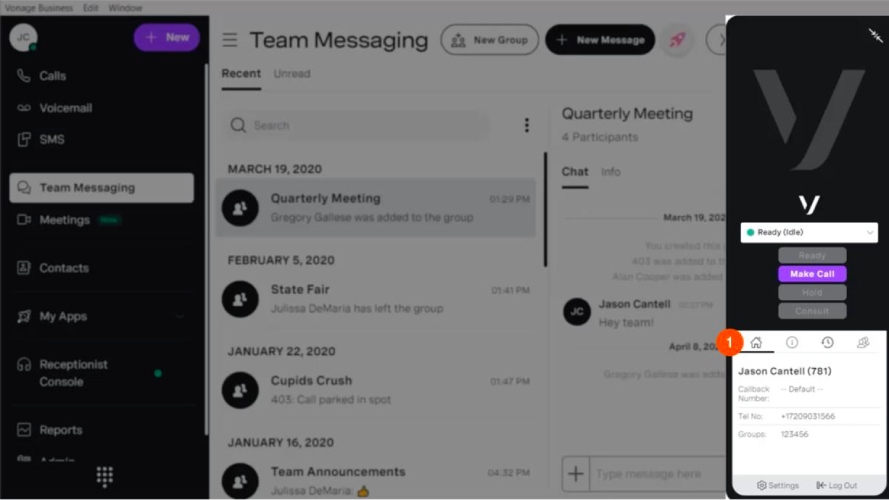
View customers’ callback numbers on Vonage’s home tab. (Source: Vonage)
5. Reassess Your IVR System
Interactive voice response (IVR), a tool built into most voice-over-internet-protocol (VoIP) phone systems, directs callers to the right departments by responding to menu-directed key presses. However, callers tend to hang up if there are too many choices in the menu or if it takes too long for the system to connect to a human service representative.
That said, as you learn how to calculate abandonment rates, evaluate how helpful the IVR system is to callers. Make sure its menu options are simple and relevant, and that there’s always an option to speak to a live agent.
Freshdesk features a multi-level IVR system that allows unlimited multi-level phone trees for different call campaigns.
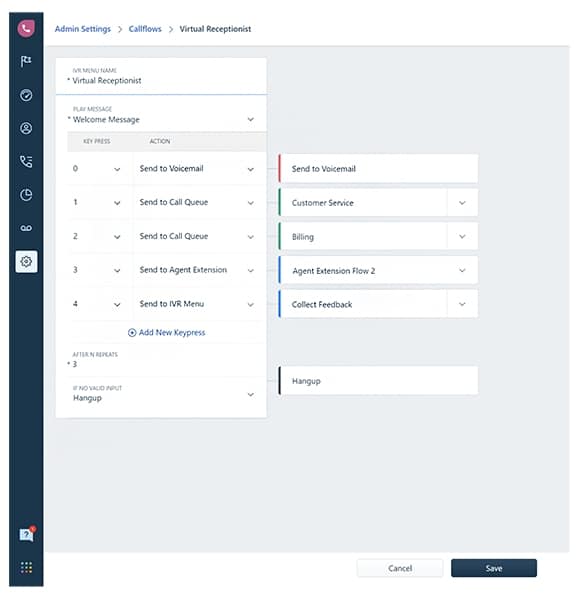
Create multi-level phone trees with Freshdesk’s multi-level IVR system. (Source: Freshdesk)
Frequently Asked Questions (FAQs)
Customers hang up on calls for various reasons, including being put on hold for a long time, finding a solution to their concerns elsewhere, and getting distracted by other tasks. In any case, abandoned calls are a symptom of bigger customer service problems, such as inadequate agents or poorly designed IVR systems, which must be addressed quickly to avoid customer frustration.
A dropped call is a call that was unintentionally disconnected, such as in the case of poor connection or technical error. An abandoned call is a call the caller intentionally disconnected, commonly because of a long waiting time in the queue.
A missed call is a call that has rung at least one agent and was rejected, while an abandoned call didn’t reach a customer service representative as the customer hung up while in the waiting queue.
Bottom Line
Learning how to calculate call abandonment rate in a call center is essential to providing better customer service, as it offers valuable insights into the efficiency of your IVR systems, call queues, and the overall team of agents. Refer to historical reports in your call center software to get a detailed overview of your inbound calls, and use the formula above to review abandoned calls. Make the necessary adjustments to your call distribution systems and improve agent training.