
TikTok is reshaping the future of ecommerce even if its future in the U.S. hangs in the balance. As lawmakers debate whether to ban the app or force a sale to an American company, TikTok remains a powerhouse in the world of social commerce. The all-in-one platform blends entertainment, education, community, and shopping, making it…
Statistics
Average PTO in the US: What Small Businesses Need to Know

Paid time off, or PTO, has evolved beyond simple vacation time to become a key element of an employee’s benefits package. In today’s job market, offering attractive PTO options is almost as essential as providing comprehensive health insurance. Understanding what is the average PTO in the US is crucial for businesses to attract and retain…
36 Essential Google Search Statistics for 2025
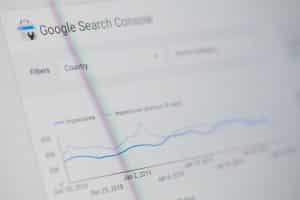
We all know Google—and being in digital marketing, Google’s constant algorithm and feature changes are things I always keep watch of because they carry significant changes for any website looking to get discovered. It’s no secret that Google is the top search engine in the world, and that’s unlikely to change anytime soon. To help…
23 Supply Chain Statistics for 2025: Industry Trends & Turbulence
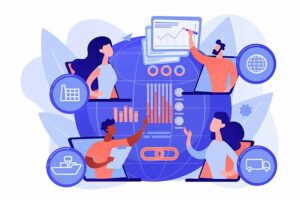
A supply chain is a network of people, companies, and processes working together to create and deliver products or services to customers. The supply chain landscape is evolving rapidly, driven by market growth, sustainability demands, disruptive forces, and technological advancements. In this article, we cover 23 supply chain statistics, current supply chain and retail trends,…
51 Key Business Insurance Statistics: Industry Premiums, Claims & More

Insurance is a global industry that significantly impacts country economies, businesses, and individual lives. According to the Small Business Administration, there are 33.1 million small businesses in the US. With nearly half a million new small businesses starting every month, insurance is essential for their success. Inflation and natural disasters significantly impact insurance industry losses,…
15 Impulse Buying Statistics Retailers Should Know

Impulse buyers—customers who make unplanned or spontaneous purchases—are among the types of shoppers you’ll encounter as a small business owner. Impulse buyers’ needs and motivations might seem tricky to predict, but they are a profitable demographic to tap into. A commonly cited statistic estimates impulse buying comprises 40% to 80% of all purchases. Familiarizing yourself…
14 Microfinance Statistics You Need to Know for 2025

Microfinancing allows borrowers who may have difficulty qualifying for a traditional loan the opportunity to access smaller financing options, usually up to $50,000. These loans are typically designed to help underserved communities or businesses with limited resources be able to financially support their business. While the loans used in microfinance may be smaller than those…
21 Black Friday Statistics to Know: 2024 Sales Data
I’ve compiled and analyzed the latest data from the National Retail Federation, Adobe, Salesforce, Square, and Shopify to bring you the most noteworthy Black Friday 2024 insights.

Black Friday 2024 sales data is officially in and shows consumers were serious about shopping this year. Black Friday, the day after Thanksgiving, was the most popular shopping day of 2024 (so far) for both online and in-store sales. In fact, Black Friday 2024 was the busiest in-store shopping day since the pandemic. In addition…