

Customer relationship management (CRM) dashboards present a snapshot of sales activity, performance, goal progress, tasks, and pipeline health in a simple, centralized format. Sales managers use CRM dashboards to evaluate key performance indicators (KPIs) and other top priority data metrics in a sales operation—enabling them to optimize strategies based on these reports. This article explores CRM dashboards, how they work, and how they teach you how to customize your own.
Types of Dashboard Reports
A dashboard can consist of various components like charts, reports, and widgets pulled from your CRM system data. However, which of these components are included in a dashboard will depend on the type of dashboard used and whether your system allows for customization. The most common types of components you can add to your dashboards, along with examples of how they’re used, include:
- Sales pipeline dashboard: Contains information on your current sales pipelines, such as the number of opportunities, average deal size, conversion rates, and total closed deals. It’s used to help maintain the pipeline health, identify top opportunities, and find trends to help your sales team sell more efficiently.
- Activity reports: Data on input by your sales individuals or team, such as the number of calls placed, emails sent, leads generated, appointments set, or proposals created. They’re used to ensure sales quotas are met and that personnel put in the proper effort.
- Revenue forecasts: Estimates on how much revenue you can expect to generate over a set period based on current pipeline health and recent trends. They’re used to predict sales numbers and determine future spending capabilities.
- Goal tracking reports: Evaluations of the organizational, team, or individual sales goals concerning actual progress. They keep teams on pace to fulfill objectives and hold staff accountable for performance.
Some systems allow you to mix and match unique reporting widgets into one dashboard, others allow you to set up multiple different dashboards that you can navigate between depending on what you want to know. Pipedrive is one of the best CRM dashboard examples in this regard, where a user can create and navigate between multiple dashboards from the insights module.
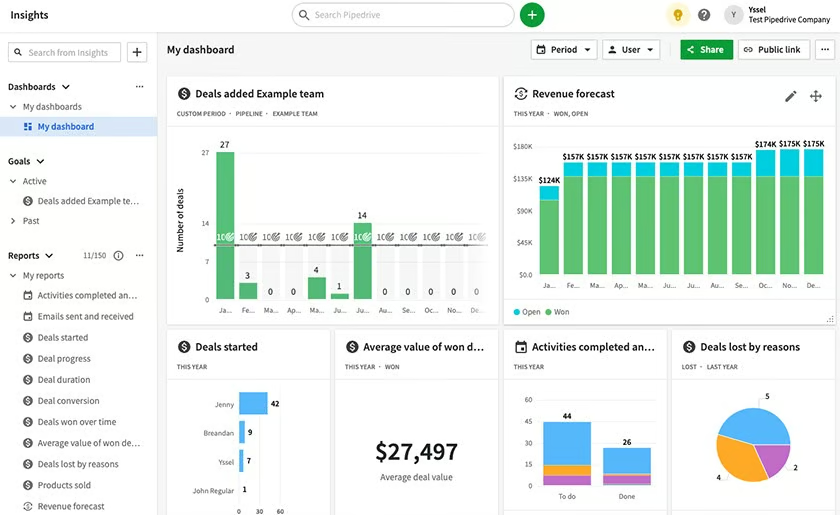
Pipedrive dashboards drop-down (Source: Pipedrive)
If a sales manager wanted to separate pipeline data for three different sales regions, they could have multiple dashboards—rather than one dashboard for the entire business. A tool like Pipedrive allows you to create three dashboards, presenting pipeline data for each region and one that aggregates all pipeline data into a single dashboard. Now, with just one click, they can switch between each dashboard for valuable insights.
Why CRM Dashboard Customization Matters
Customization is essential to managing a CRM dashboard and making it work. The entire purpose is to create a snapshot visualization that meets your needs, which you can quickly glance at to grasp how your business is performing. In addition to selecting the types of reports and data you want, there are reasons to add customizable elements to your dashboard. These reasons include:
- More timely analysis options: For goal tracking, activity reporting, forecasting, and pipeline monitoring, you might only want to see data corresponding with a certain time. For example, if you were evaluating your pipeline for deals closed last month, set your dashboard to only show deal closing data for the previous month or the last 30 days.
- Allows you to better filter data: You may add or remove bits of information to create more value from your dashboard. For instance, with goal progress, you can have revenue charts on your dashboard that show the total revenue produced compared to the desired goal. Alternatively, you might filter your data to only show a specific team or individual.
- Creates an improved visual design: The data can be shown in different visual designs, including pie charts, line graphs, bar graphs, funnels, or simple, bold numbers. You might select specific designs depending on the insights you’re looking for. For example, a month-to-month revenue comparison would be best shown as a bar graph, while total revenue over the period can be an enlarged number.
- Makes priority information easier to see: In addition to adding designs, you should tailor the layout by arranging and sizing the widgets accordingly. For instance, when evaluating pipeline efficiency, something important like a deal conversion rate funnel should be a larger widget than something less associated with efficiency, like an average deal value number or line graph of revenue over time.
Every major CRM product offers a high degree of dashboard customization for each element. The Zoho CRM dashboard samples below are solid examples of dashboard customization from a user’s point of view.
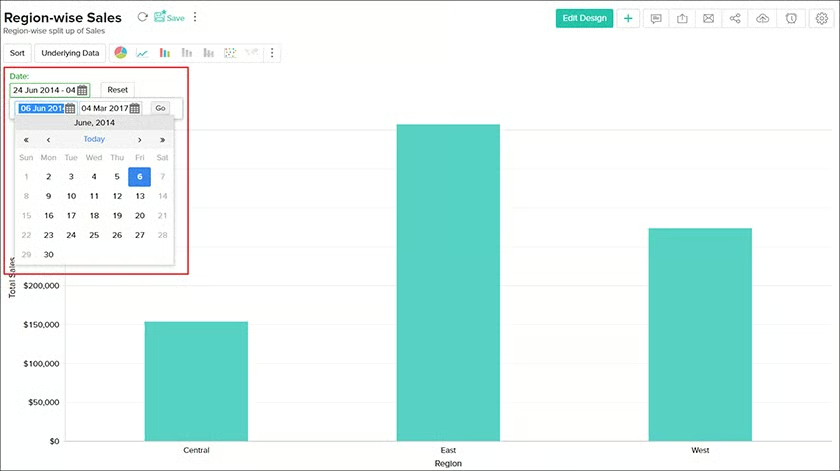
Zoho report widget data filtering by date (Source: Zoho) 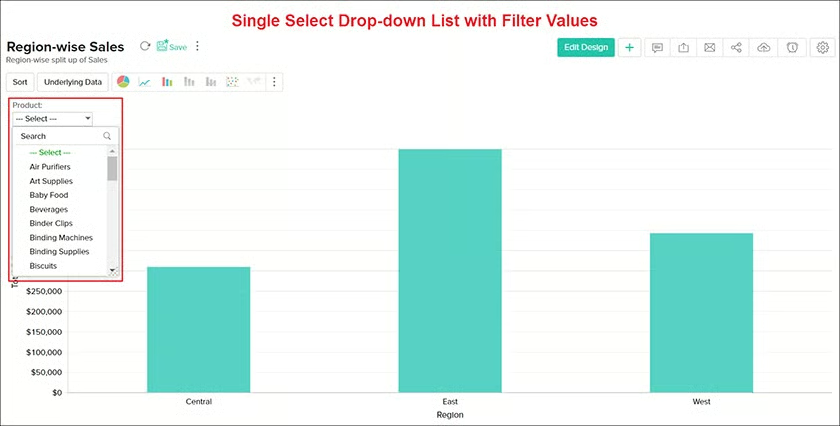
Zoho report widget data filtering by product (Source: Zoho) 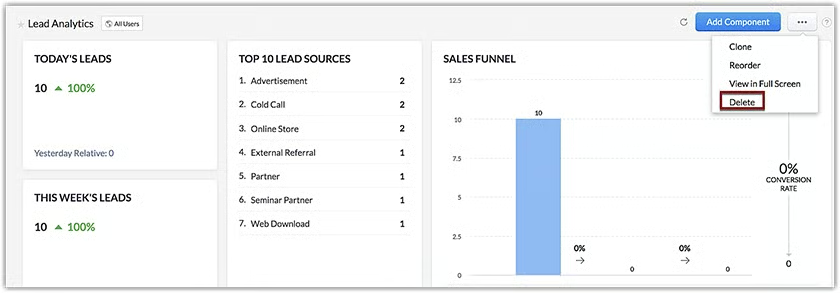
Zoho adding and deleting dashboard components (Source: Zoho) 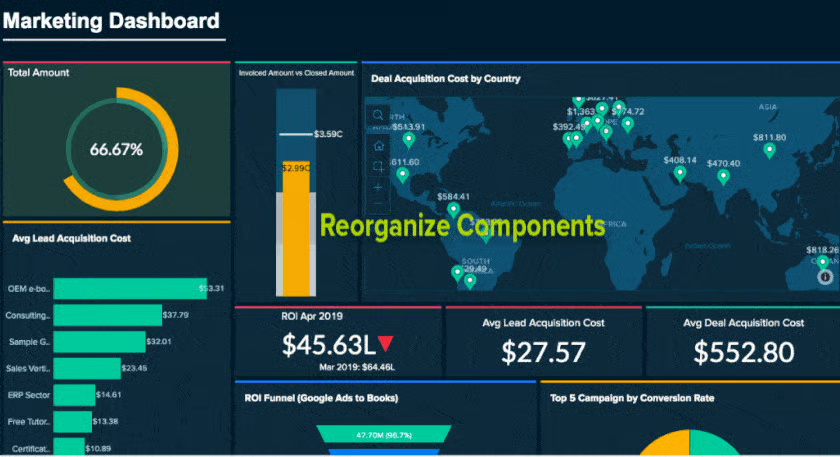
Zoho CRM rearranging dashboard components (Source: Zoho)


With all the features a CRM system offers and its technical complexities, it can seem overwhelming to fully understand CRM software and find the best product for your business. We’ve created a comprehensive CRM e-book that breaks down everything you need to know about a CRM, including its benefits and standard features as well as how to select and implement the best-suited one into your operations.
The Expert’s Guide to Customer Relationship Management
Small Business Use Cases + Pro Tips
How to Customize a CRM Dashboard in 3 Steps
Once you understand the types of reports and customization that go into a CRM dashboard, you’re ready to design your own. Here’s how to customize a CRM dashboard in three steps using sales dashboard examples from HubSpot, a highly acclaimed product for its CRM reporting features.
1. Select ‘Create a New Dashboard’
From the CRM system, there will be a button to create a dashboard. Some products may even have a default one made or offer CRM dashboard templates that help get you started. With HubSpot, you can build one from scratch or use one of their prebuilt templates.
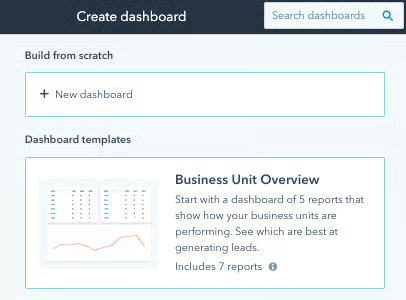
HubSpot create a dashboard page (Source: HubSpot)
After starting the process, you’ll be prompted to name your specific dashboard, which will be useful if you navigate multiple dashboards. Additionally, you can set different user permissions and organize, favorite, clone, or delete dashboard pages.
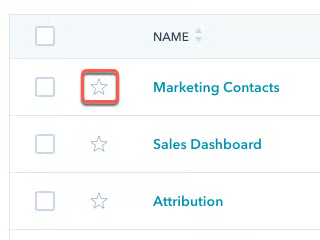
Marking your favorite HubSpot dashboard (Source: HubSpot)
2. Create Filtered Reports & Widgets
Once the page is created, generate and add the visual items. This process starts with selecting the dashboard you want to work in and then creating a report. While each CRM differs in how you can exactly create a report, they all start with choosing data sources and then adding selected information to a visual chart.
In HubSpot, users can choose which modules they want to use as their primary data source. Once chosen, decide on the data fields and properties to add to each report as a visual chart. These could be a bar or pie graph, or an enlarged number. Filter the information based on date ranges or attributes such as team, pipeline, or individual sales rep.
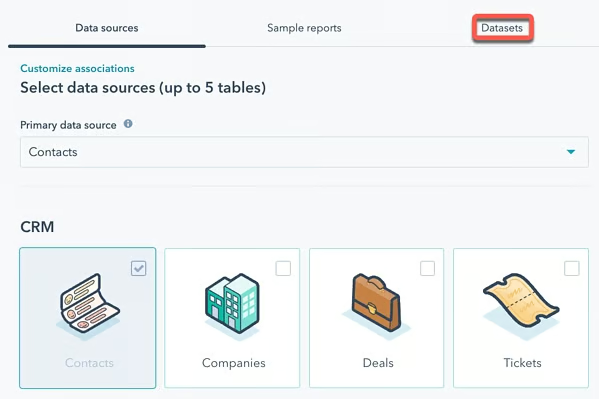
Selecting data source on HubSpot (Source: HubSpot) 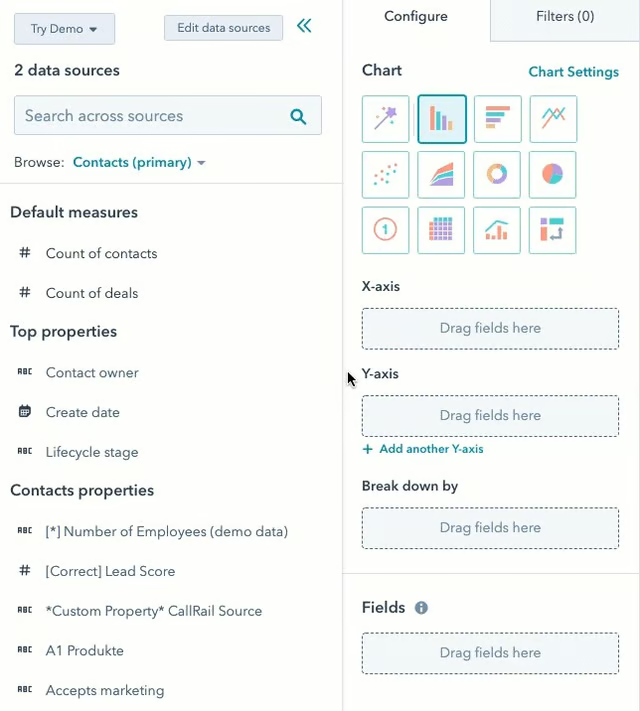
HubSpot data fields and chart selection (Source: HubSpot) 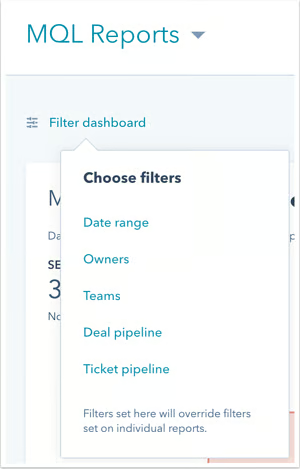
HubSpot data filtering (Source: HubSpot)


As each report is completed, users can add them to the dashboard. Even after they’re added, you can customize the charts, delete them, filter the data further, or add and edit new data from the dashboard. Most CRMs, including HubSpot, have editing or filtering options in the corner of each widget to make those adjustments.
HubSpot report with filter option (Source: HubSpot) 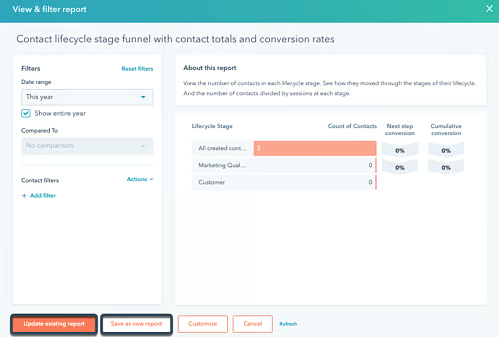
Editing reports on HubSpot (Source: HubSpot)


3. Arrange Your Visuals
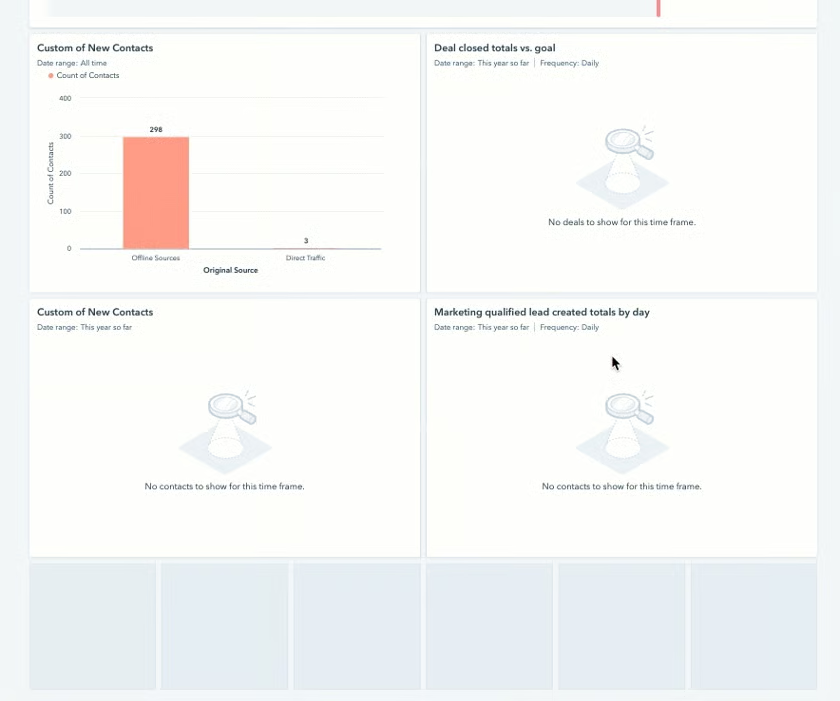
The last step involves arranging your widgets and charts to your liking. Like many other CRMs, HubSpot uses a drag-and-drop and drag-to-size system, making it easy to design. For each item, you can drag from each square to move it around, then click corners to adjust the size until it’s exactly how you want it to look.
Dragging widgets to squares (Source: HubSpot)
Who Uses CRM Dashboards?
Anyone involved in a sales, marketing, or customer service operation using a CRM system can take advantage of a CRM dashboard. Depending on each individual’s role in the organization, however, it may serve different purposes. Here are some of the most common user types of dashboards:
- Sales managers, vice presidents, and directors: Those overseeing sales operations or responsible for managing territories use dashboards to view activity and performance for their specific team or organization.
- Business owners and executives: C-suite executives, business managers, and owners utilize CRM dashboards to get a quick overview of how well their sales or revenue teams perform, make sales forecasts, and track goal progress.
- Account executives: Individuals responsible for building and maintaining relationships with clients use dashboards to discover trends, prioritize leads and opportunities, and see what tasks need to be completed next by filtering sales data.
- Sales development reps (SDRs): SDRs primarily handle prospecting and lead generation by cold calling, emailing, or attending networking events. They use dashboards to track their individual activity and performance to optimize workflows and meet their activity quotas.
- Customer experience and account managers: These team members are responsible for keeping key metrics like customer churn rates low and satisfaction high. They use customer service dashboards to evaluate relevant KPIs, such as customer retention rates or average customer lifetime value (CLV).
- Data analysts: Analysts take data and business intelligence (BI) information to find trends or opportunities that help the business make better decisions. CRM dashboards are an excellent way to quickly obtain specific sales information for sales enablement purposes or other improvement initiatives.
- Marketing managers: Managers and other personnel in a marketing department use dashboards to gauge the effectiveness of their email, digital ad, or social media campaigns. Furthermore, they can take the snapshot data to see which channels and content resonate best with their audiences.
Bottom Line
CRM dashboards give managers and sales employees a glance into performance, activity, goal progress, and estimated revenue. Nearly all CRM systems have at least some level of dashboarding capabilities, either built in or through a native software tool. Creating your own dashboards requires choosing and filtering the data you’d like to see reported while visualizing and arranging it in a way that’s easy to understand.