

Customer relationship management (CRM) software reports take sales activity data stored in the system and condenses it into visual, actionable information. CRM reports help businesses evaluate their operation and gain insights, such as progress toward sales goals, bottlenecks in the sales process, and how well an individual or team of reps performs. In this article, we explore the types of CRM reports for your small business and the best tools to use.

1. CRM Pipeline Analysis Report
A sales pipeline report shows an organization’s ability to get deals into and through its sales process. It often looks at things like lead or funnel conversion rates, sales process bottlenecks, pending opportunities, current revenue in the pipeline, and the number of deals in each pipeline stage.
CRMs generally provide these metrics in reports or on system dashboards. For example, HubSpot lets you pull data for deal funnel analytics—converting the information into visual bar charts with stage-by-stage and cumulative conversion rates. To take another route, Salesforce lets you customize CRM dashboards to pull pipeline health information such as revenue in each stage and line it up with other reports like forecasts or lead source data.
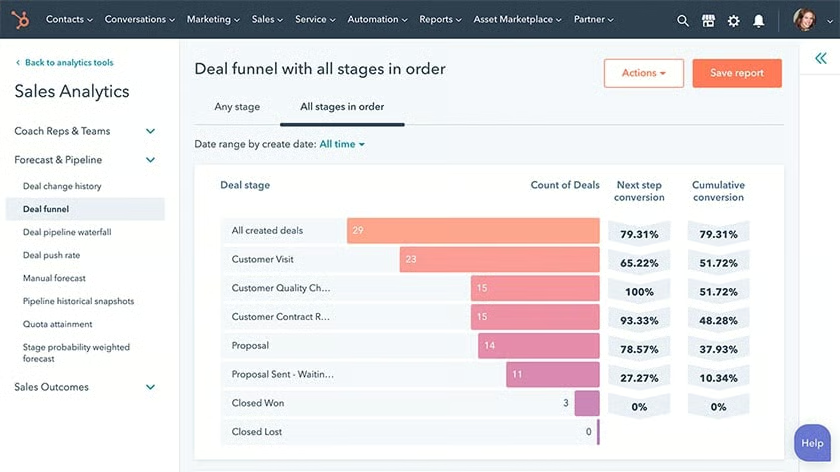
HubSpot sales funnel conversion report (Source: HubSpot) 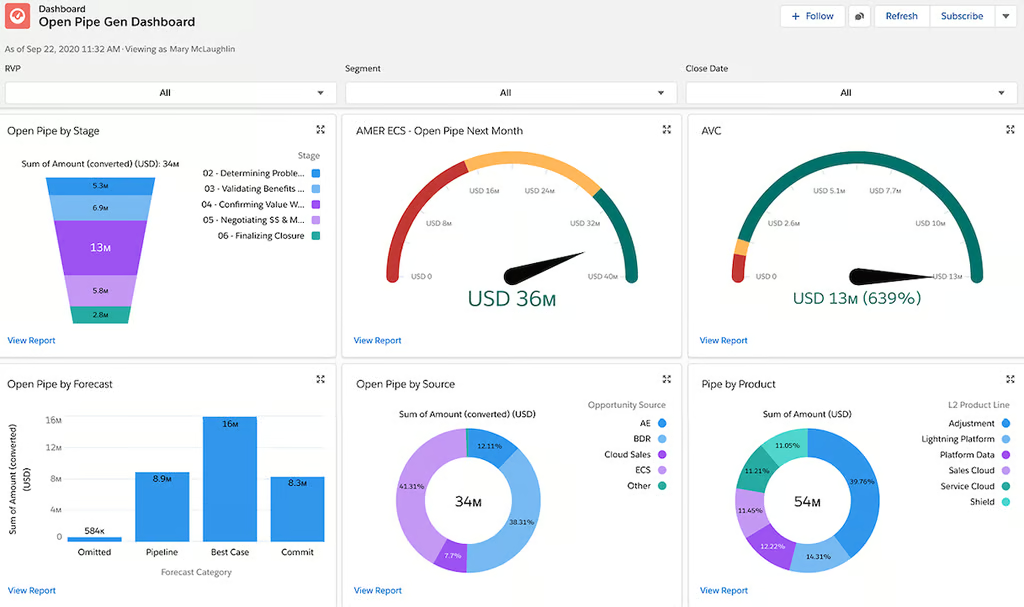
Salesforce pipeline analytics dashboard (Source: Salesforce)


2. Sales Performance Report
Sales performance refers specifically to production in the form of deals closed or revenue generated. While these are basic metrics, they are the simplest key performance indicators (KPIs) to evaluate a sales rep or entire business since all activity put into the pipeline is meant to yield an output—deals, customers, or future revenue.
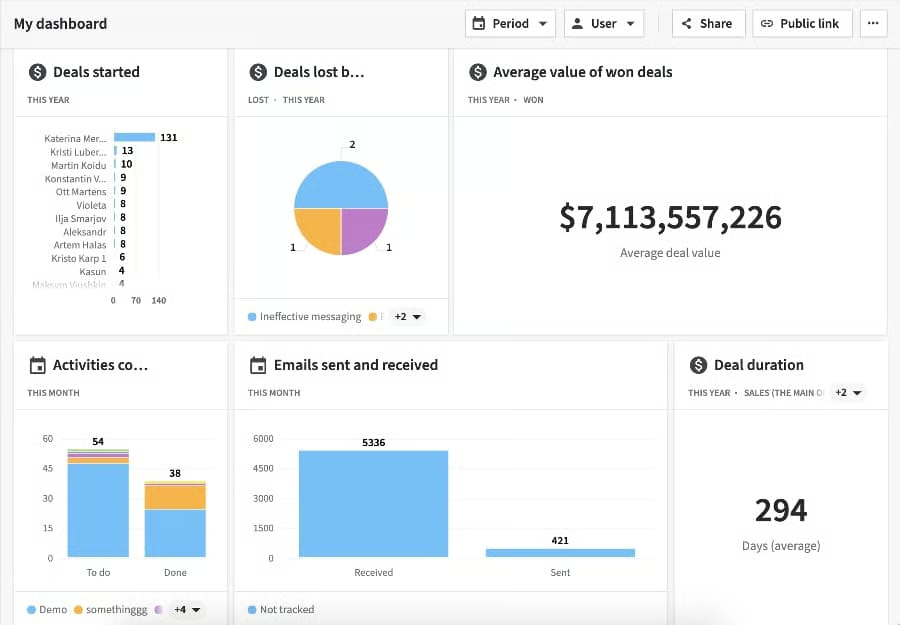
CRM features vary by provider, but all are designed to help streamline business operations. CRMs like Pipedrive not only provide simple insights into how teams perform, but they can also break down deal performance into detailed analysis. For example, its dashboard can present supplemental deal information such as the average value and duration of won deals.
3. Revenue Forecast Report
A sales forecast report shows revenue estimates involving what a business or team can expect to generate over a specific time period. They are often looked at along with sales goals to see if an organization is on pace to hit its objectives. Additionally, these reports help evaluate spending capabilities for future expenditures.
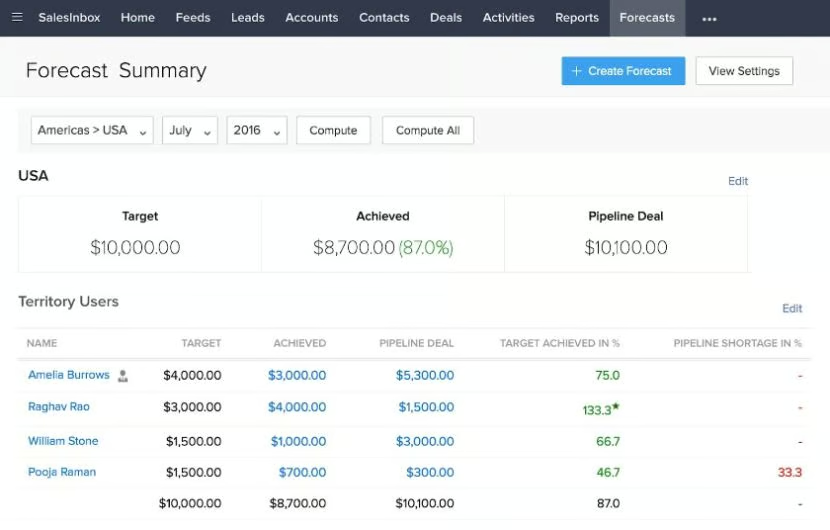
While most CRMs offer sales forecasting features, they tend to vary in terms of which subscription plans are required to give users access. Zoho CRM, for instance, has sales forecasting available on its Standard plan for just $14 per user, per month. It includes customizable revenue forecasts as well as performance management tools like goal setting and tracking features.
4. Sales Activity Report
Activity reports track sales input such as total phone calls made, emails sent, appointments created, business proposals generated, or any other sales task that contributes to your sales process. These reports hold reps accountable for their effort and ensure they are meeting their weekly, monthly, or quarterly sales quotas.
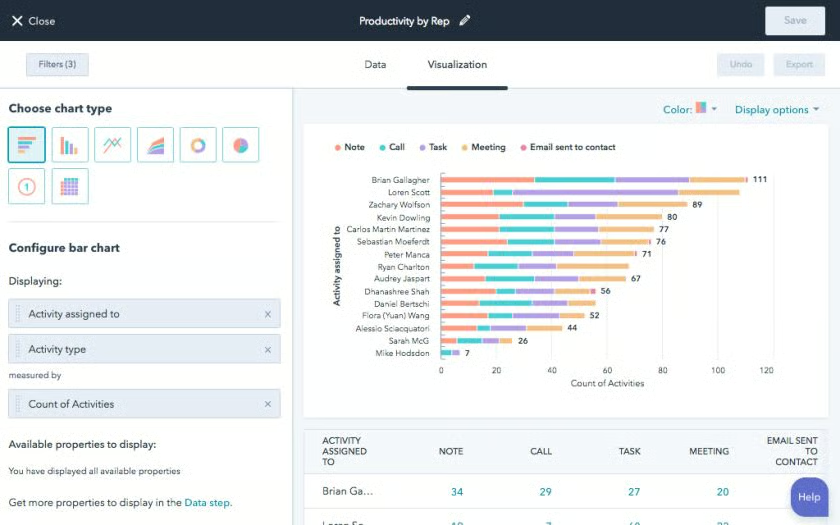
Activity data can be provided on a CRM system’s dashboard or by creating a customizable report. Furthermore, managers can evaluate total activity on an organizational, team, or individual basis to gauge operational productivity. HubSpot, for instance, lets you create custom activity reports using an array of chart options to break down different types of sales tasks by rep.
5. Lead Source Analysis Report
Businesses use these types of CRM reports to evaluate channels for lead generation. In other words, it’s a breakdown of where their customers are coming from, such as trade shows, online on webform submissions, social media ads, referrals, or a particular networking group. A lead source analysis gives insight into which channels offer the best opportunity for new customers as well as the ones that you should consider removing.
CRMs like Bitrix24 offer simple lead reporting that outlines total leads generated and where they are coming from. More advanced insights, as seen with Salesforce reporting features, let users see total percentages of deals won broken down by lead source. This goes beyond where leads come from by telling the story of specifically where the top-quality opportunities are sourced.
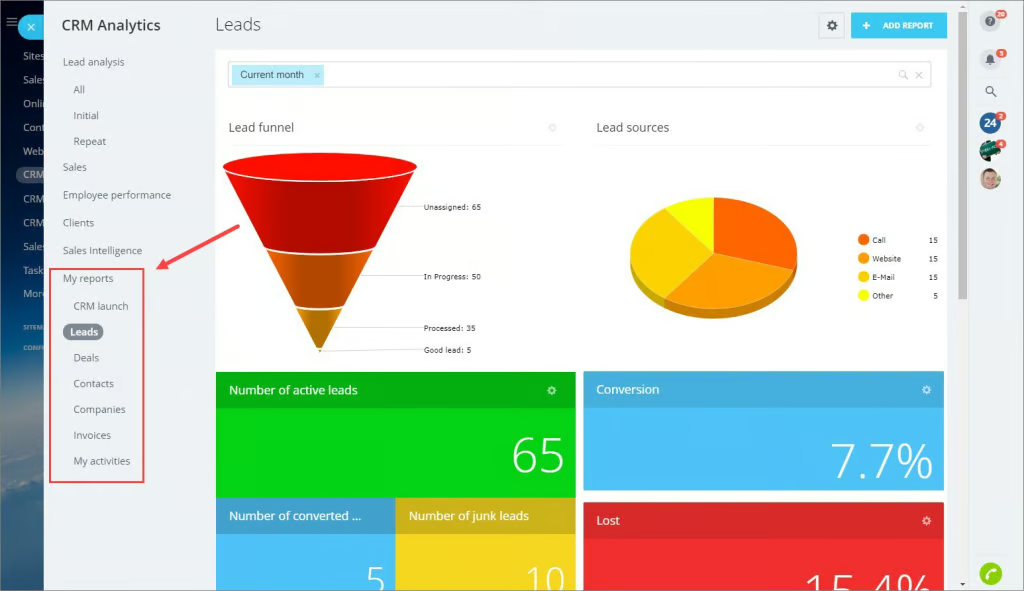
Bitrix24 lead analytics with lead source breakdown (Source: Bitrix24) 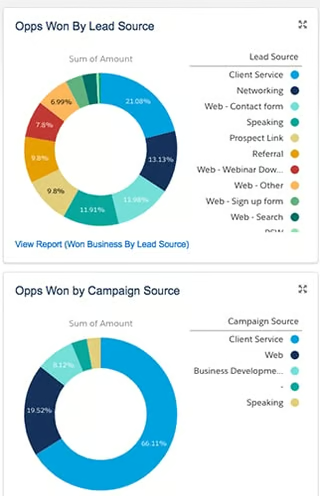
Salesforce deals breakdown by source (Source: Rattleback)


6. Marketing Campaign Analysis Report
CRM reports predominantly display sales information, making them a great tool for sales management, but some are also an excellent resource for analyzing marketing campaigns. They do this by helping you optimize the content and channels you’re using to nurture leads or connect with new audiences. For the most part, only CRMs with mass emailing and content management capabilities offer these types of reports.
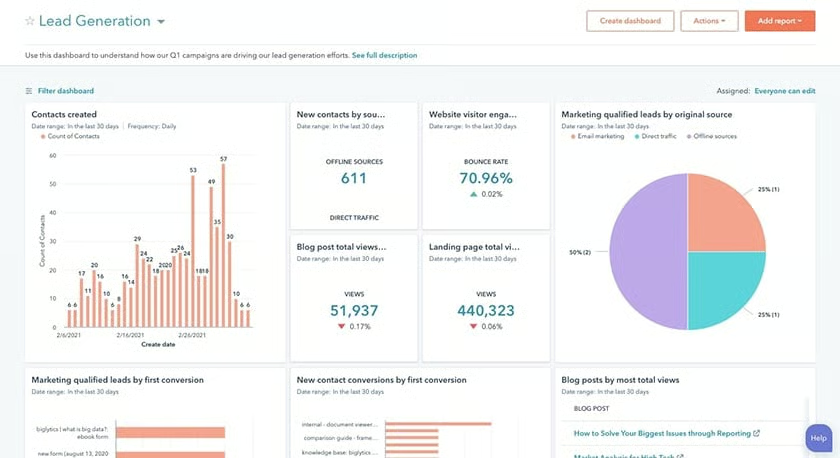
For example, HubSpot is a marketing-focused CRM system that lets you design and deploy email marketing campaigns and advertisements on Google or Facebook. With that, you can evaluate metrics like clicks, impressions, leads generated, and open rates. More advanced dashboards on HubSpot can even show your return on investment (ROI) performance.
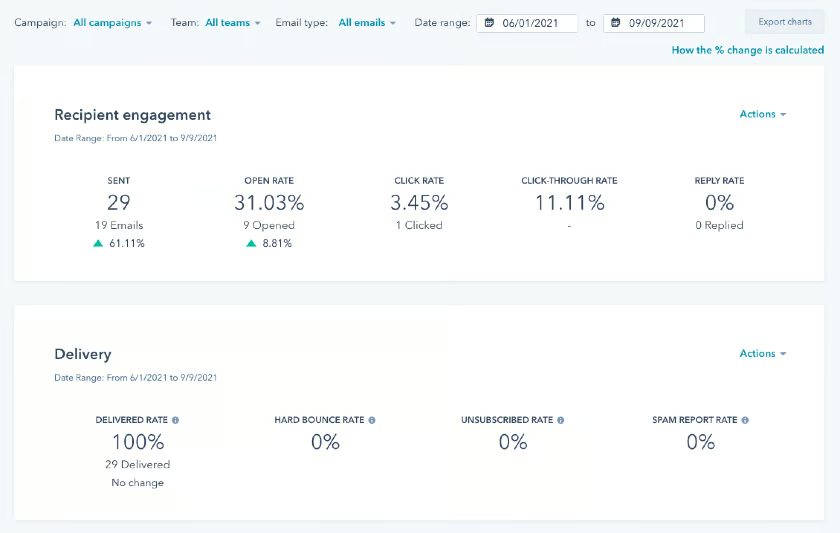
HubSpot email campaign report (Source: HubSpot) 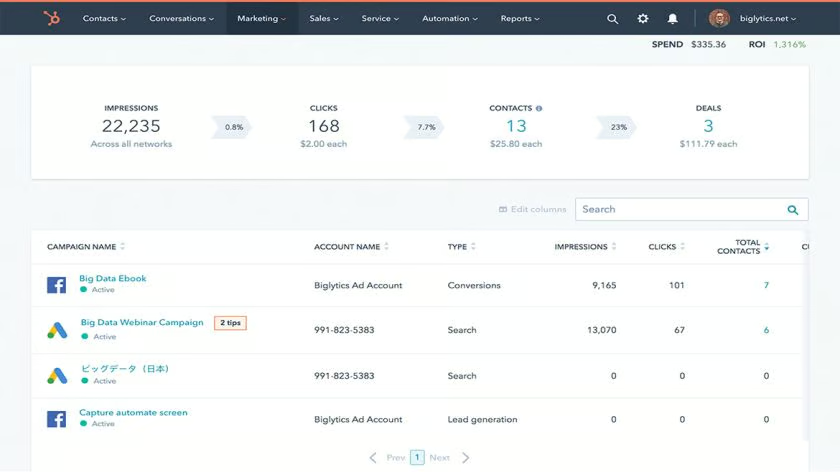
HubSpot ad campaign reporting (Source: HubSpot) 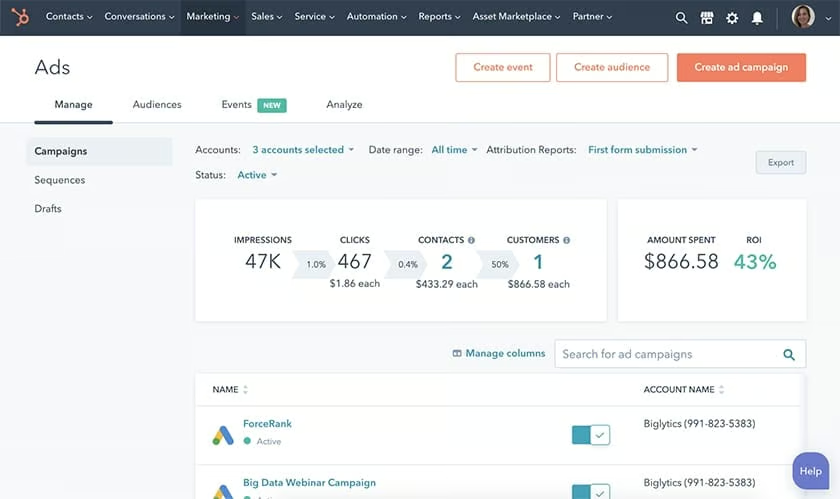
HubSpot ad dashboard with ROI (Source: HubSpot)


7. Customer Service Reports
Customer service reports show progress and efficiency in customer support, customer experience management, and account management activities. They allow you to see how well agents and service reps perform in terms of resolving cases, retaining clients, and creating satisfied customers.
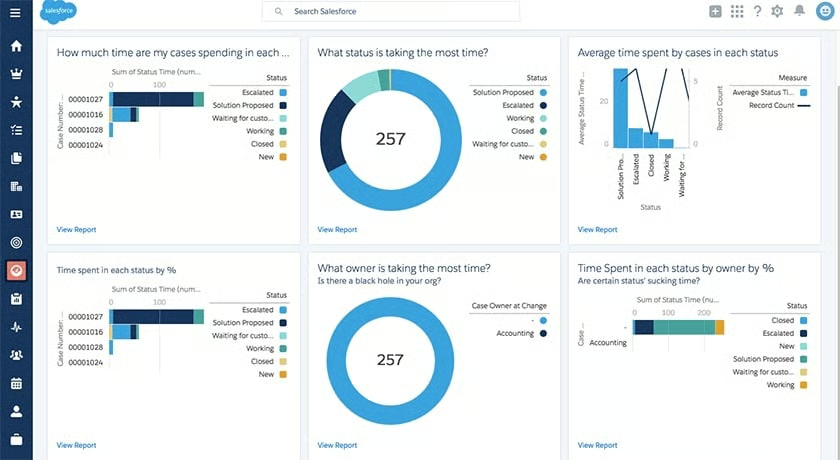
Salesforce has elaborate customer service reporting features that let users compile robust case data such as current statuses, case number by channel, or average time-to-resolution, all on a centralized dashboard. There’s also Zoho Analytics, a native software to the CRM product, that has advanced customer behavior analysis with dashboard metrics such as customer lifetime duration, churn rates, and active subscription numbers.
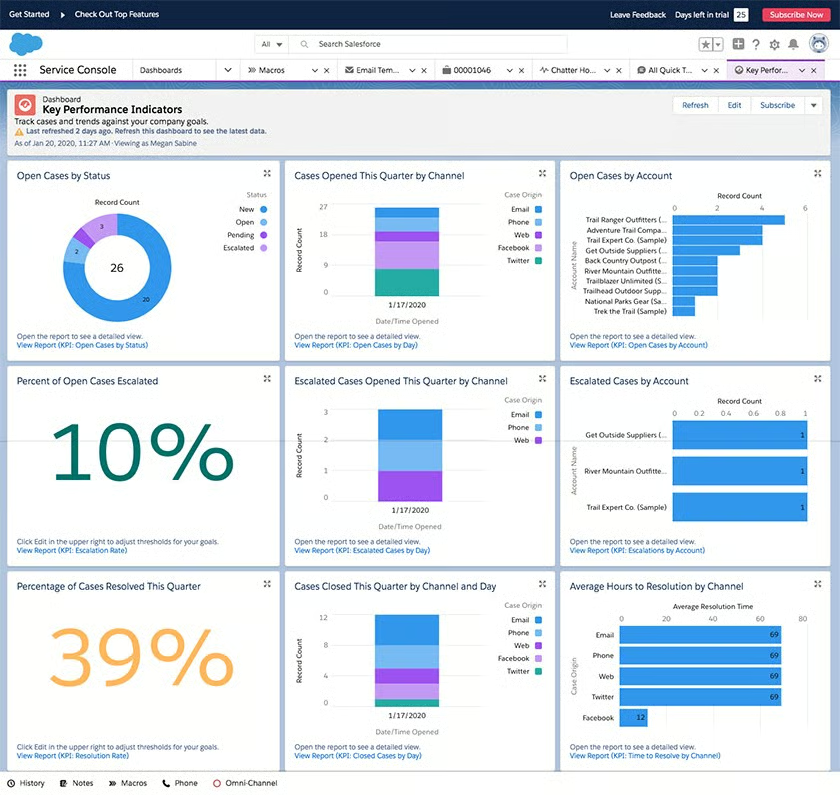
Salesforce service KPI dashboard (Source: Salesforce) 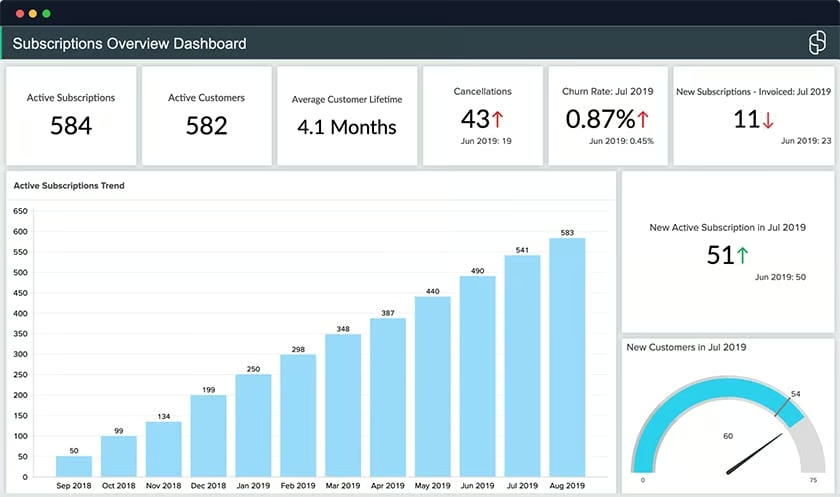
Zoho customer subscription dashboard (Source: Zoho)


How Businesses Use CRM Reports
CRM reports congregate, filter, and analyze data to provide usable information to a manager or executive so they can make decisions. For example, they may want to make adjustments to their operation to boost productivity by investing in a new sales automation tool to streamline a certain stage in the pipeline. They might also make larger-scale strategic decisions like exclusively penetrating a certain lead source to expand based on a lead report.
CRM reports offer different types of information depending on who’s using the CRM system. For example, sales teams often use the information to see where leads come from, how efficiently they convert leads to customers, and estimate how much revenue they plan to generate compared to their goal.
Alternatively, marketing teams can also use CRM analytics and reporting tools to evaluate their campaigns and overall strategy. For instance, they can look at views, clicks, and conversions for various email and online advertising campaigns to see if certain content or channels resonate well with their target audiences.
Customer service teams also stand to benefit from CRM reporting features. They can view data on current accounts and how effective they are at responding to and addressing support inquiries. Customer success reps and other members of the revenue operations team may also want to see client retention rates as well as their effectiveness at upselling or cross-selling customers.
Best CRMs for Reporting Features
Nearly every general-use and industry-specific CRM has some level of data reporting and dashboarding capabilities. These three products, however, stand out for their robust and easy-to-use CRM reporting features:
 |  |  | |
|---|---|---|---|
| Best For | Best CRM for report and dashboard customization | Excellent for larger customer service and support teams | Suitable for revenue teams looking to evaluate sales and marketing operations |
| Starting Price* | Free to $14 per user | $25 to $75 per user | Free to $45 (up to 2 users) |
| Key Reporting Features | Highly custom reporting options for KPIs, charts, funnels, and targets | Advanced forecasting and analytics plus customer support insights | Easy-to-use sales and marketing performance reports |
| Visit Zoho CRM | Visit Salesforce | Visit HubSpot |
*Pricing is per month based on annual billing. Monthly billing is also available at slightly higher rates.
Zoho CRM
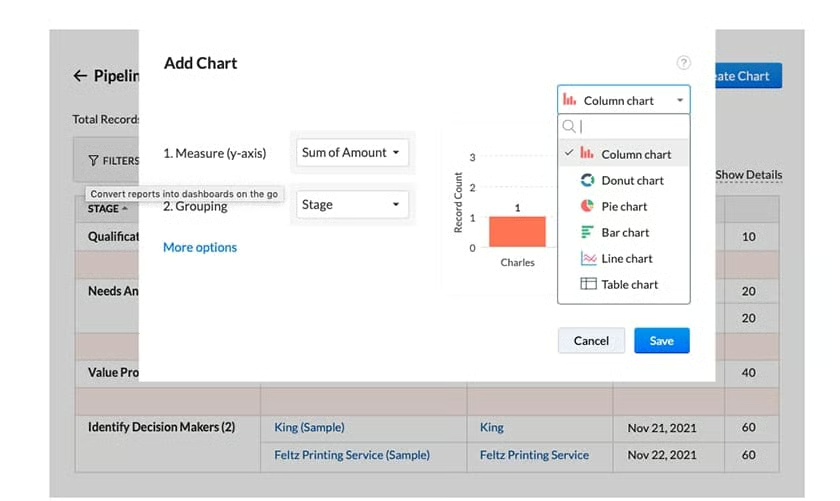
Zoho CRM is a popular CRM reporting solution that stands out for its low-priced and scalable options—including a free plan for up to three users and a $14 monthly per user paid plan. It is also great for system customization, encompassing highly tailorable reports and dashboards. Users can pull just about any type of data from the system, run analytics or direct comparisons, and visualize it on numerous charts, including pie, bar, table, line, or donut.
Salesforce
Salesforce is an advanced CRM that lets businesses evaluate performance, track activity, and forecast sales through reports across multiple territories. In addition to sales reporting, Salesforce provides customizable dashboards and report options for customer support operations. Teams can get an in-depth look at case-resolution efficiency and which service reps are outperforming the rest.
HubSpot
HubSpot allows businesses to utilize CRM reporting for both sales and marketing operations. The sales modules let users construct highly tailored reports on activity and deal performance. For marketing teams, they can pull data regarding their campaigns and website traffic—letting them see how well their mass email, advertising, and content management strategies are working.
Bottom Line
CRM reporting is a feature that lets managers evaluate performance and activity information by visually presenting sales, marketing, and customer service data stored within the CRM system. Reports like sales forecasts and analysis of leads and pipelines offer insights into what’s working and what needs improvement. Teams should use this information to track goal progress, adjust their strategy, or allocate resources to struggling aspects of the operation.