

Financial reporting is the final product of your bookkeeping; it turns your business transactions into a clear snapshot of performance and financial health. Without reports, you’re running your business blind. QuickBooks simplifies financial reporting by automatically generating dozens of built-in reports. But with so many options available, it can feel overwhelming trying to figure out where to start.
That’s why I’ve narrowed the list down to the 10 most important QuickBooks reports every small business should know about. Plus, I’ve included five bonus reports that can give you even deeper insights.
- 1. Profit & loss (P&L) statement
- 2. Balance sheet
- 3. Cash flow statement
- 4. Accounts receivable (A/R) aging summary
- 5. Collections
- 6. Open invoices
- 7. Sales by customer detail
- 8. Accounts payable (A/P) aging summary
- 9. Vendor balance detail
- 10. Business snapshot
- Bonus reports to check out
- Custom reports and spreadsheet sync
- Frequently asked questions (FAQs)
1. Profit & loss (P&L) statement
The P&L statement is the foundational report every small business should review at least once a month. Reviewing it regularly helps you catch rising costs early, measure the impact of marketing efforts, and ensure your bottom line stays healthy.
Think of it like your business’s scoreboard. It shows how your operations performed, highlights what’s eating into your profits, and tracks your revenue figures in one clear view. It summarizes total income, subtracts expenses, and calculates the net profit or loss for a set period.
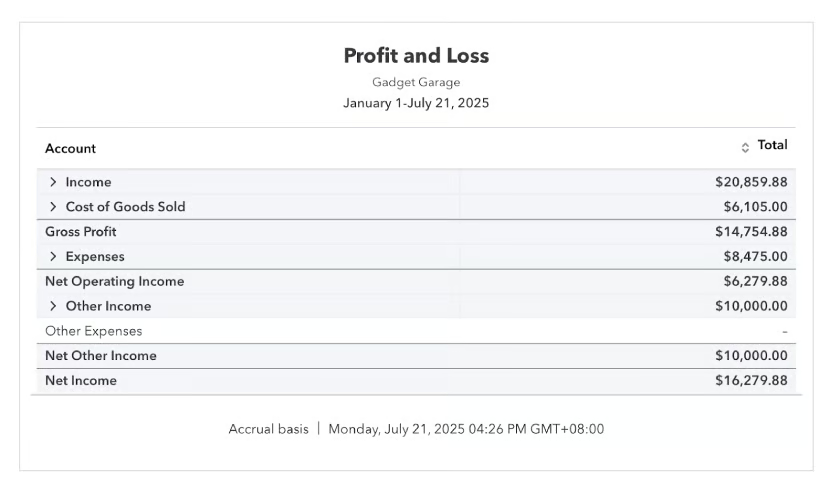
P&L Statement in QuickBooks Online
Our tutorial: How to run a P&L report on QuickBooks Online
2. Balance sheet
The balance sheet shows your company’s financial position. It’s a snapshot of your company’s financial resources and obligations at a single point in time: what you have, what you owe, and how much is left for you as the owner. This report helps you understand how much value your business holds, how much debt it carries, and how stable its finances are overall.
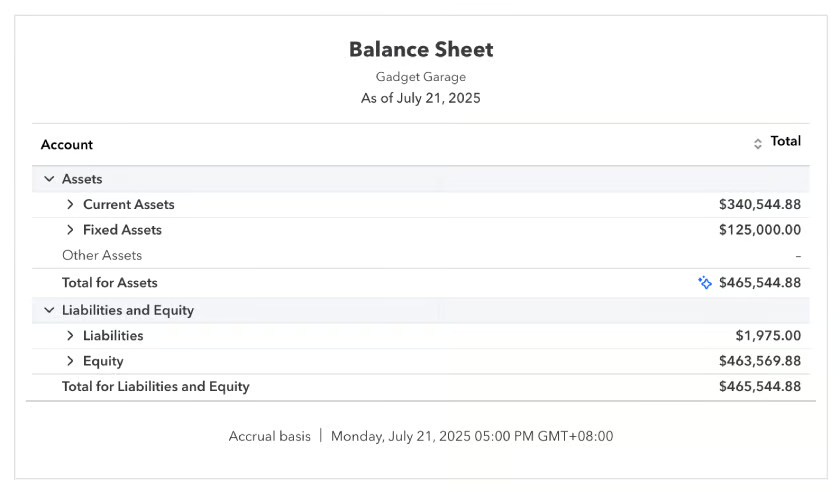
Balance Sheet in QuickBooks Online
Our tutorial: How to create a balance sheet in QuickBooks Online
3. Cash flow statement
The cash flow statement shows you how money actually moves in and out of your business. It breaks down your cash inflows (like sales, loans, and investments) and outflows (such as expenses, payroll, and debt payments).
Pay close attention to this report regularly, especially during periods of growth or increased spending. It helps you identify which transactions are burning through your cash and ensures you’re not caught off guard by cash shortfalls.
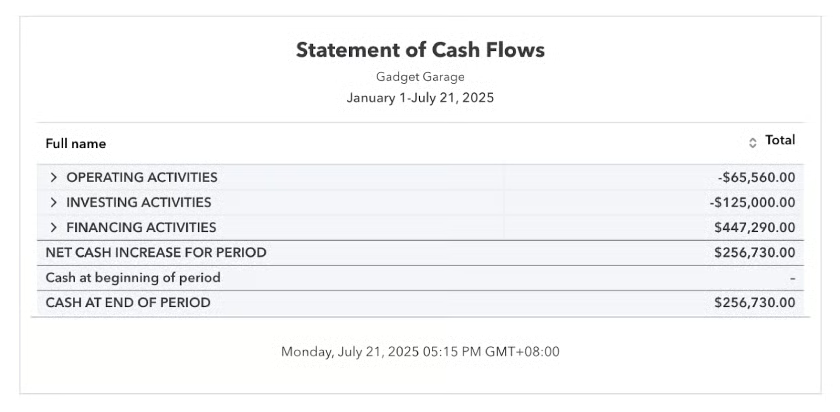
Statement of Cash Flows in QuickBooks Online
For a quick explainer, here’s what the cash flow statement shows:
- Operating activities: Cash from day-to-day business operations, such as sales revenue and payments to suppliers. This shows if your core business is generating enough cash to sustain itself.
- Investing activities: Cash spent on or received from long-term investments, like purchasing equipment and selling assets. This reflects how your business is investing in its future.
- Financing activities: Cash movements related to funding your business, including loan proceeds, repayments, and owner withdrawals or contributions. This helps you see how external financing affects your cash position.
Our tutorial: How to run a statement of cash flows in QuickBooks Online
4. Accounts receivable (A/R) aging summary
The A/R aging report helps you stay on top of outstanding invoices by showing exactly which customers owe you money and how overdue their payments are. It groups unpaid invoices into aging brackets, such as current, 30 days, 60 days, and beyond.
Monitoring this report regularly improves your collections process, shortens payment cycles, and strengthens cash flow. It can also reveal early signs of potential cash flow issues or problematic customer accounts, so you can act before overdue invoices turn into bad debts.
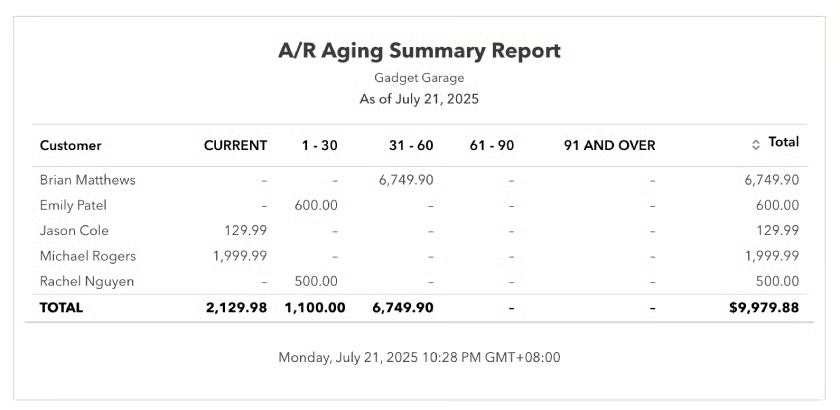
A/R Aging Summary Report in QuickBooks Online
Our tutorial: How to run an A/R aging report in QuickBooks Online
5. Collections
The collections report highlights past due amounts and identifies which invoices need immediate follow-up. It allows you to quickly see outstanding balances that should be prioritized for collection, helping you stay proactive about reducing overdue accounts.
By using this report, you can also estimate how much cash can still be collected from customers, which is useful for short-term cash planning. When reviewed alongside the A/R aging summary, it provides a clearer picture of cash inflows and helps you take timely action to improve collections and cash flow stability.
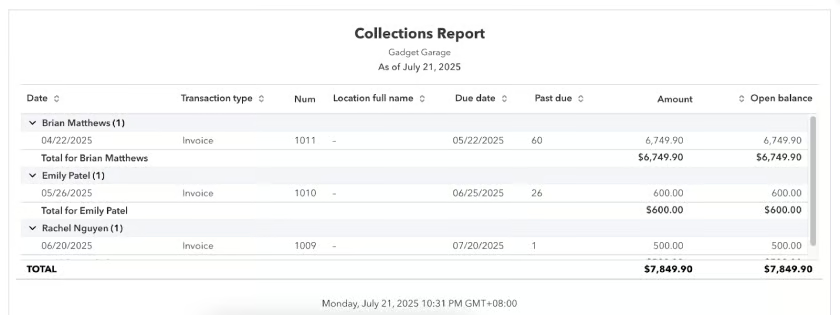
Collections Report in QuickBooks Online
6. Open invoices
The open invoices report gives you a snapshot of all unpaid invoices, showing which customers have outstanding balances and how much is still due. It is essential for tracking how much money is currently owed to your business.
It helps you manage your collections by identifying when to send payment reminders and follow-ups. When used together with the A/R aging summary, it strengthens your A/R oversight by giving both a detailed and age-based view of outstanding invoices.
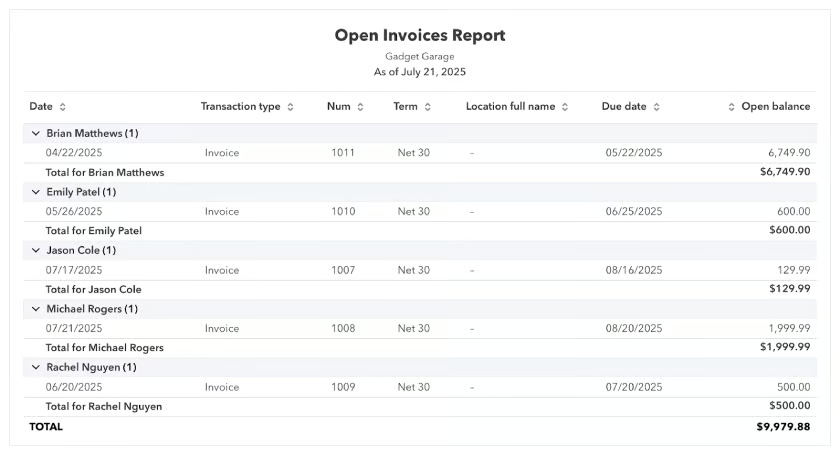
Open Invoices Report in QuickBooks Online
7. Sales by customer detail
The report for sales by customer detail provides a complete breakdown of all your sales transactions by individual customer. It helps you pinpoint which ones contribute the most to your revenue, making it easier to identify and reward your top customers.
It can also reveal trends in customer purchasing behavior, such as seasonal spikes or declines. You can use it to plan loyalty programs, work out upselling strategies, or adjust marketing efforts toward your most profitable customers. Additionally, it serves as a useful tool for detecting inactive customers who might need follow-up or engagement to bring them back.
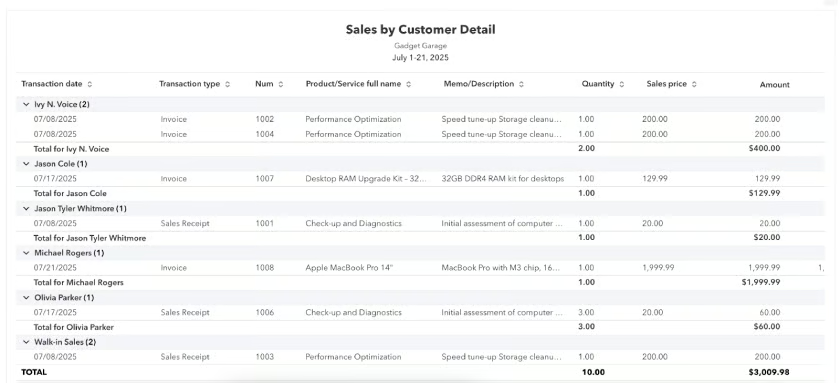
Sales by Customer Detail in QuickBooks Online
8. Accounts payable (A/P) aging summary
The A/P aging report is like the A/R aging summary but for your vendors. It shows you all the bills you owe, grouped by how long they’ve been outstanding. This makes it easier to keep track of your payables and avoid missing payment deadlines.
By reviewing this report monthly, you can quickly identify which bills are approaching due dates or have already slipped past them. Having all accounts current in this report is a good sign of financial discipline because overdue bills can harm vendor relationships and potentially damage your reputation in the industry.
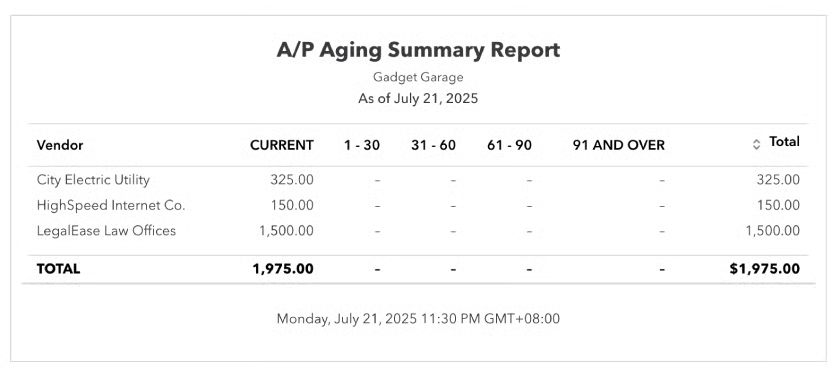
A/P Aging Summary Report in QuickBooks Online
Our tutorial: How to run an A/P aging report in QuickBooks
9. Vendor balance detail
The report for vendor balance detail shows you a complete list of all your bills, including which ones remain unpaid and the specific amounts you owe. It’s particularly helpful when you need to prioritize payments and decide which vendors should be paid first.
It also helps you reconcile your A/P by cross-checking your recorded bills against vendor statements. By regularly reviewing it, you can catch errors, avoid duplicate payments, and maintain a clear understanding of your short-term obligations.
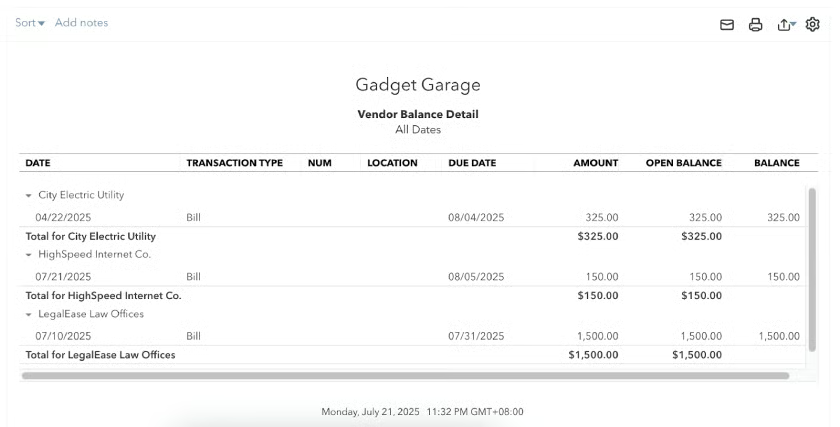
Vendor Balance Detail in QuickBooks Online
10. Business snapshot
I’ve noticed that most articles on the internet skip this report entirely. If you are in a hurry or just need a bird’s-eye view of your income and expenses, this is the one report I recommend you check.
It isn’t your typical financial report. It’s a unique feature in QuickBooks Online that functions more like an interactive dashboard (think Tableau style) rather than a downloadable report (you won’t be able to export as a PDF file). It displays your income and expenses in pie charts, provides year-over-year comparisons of income and expenses using bar charts, and includes summary lists of your top customers and vendors.
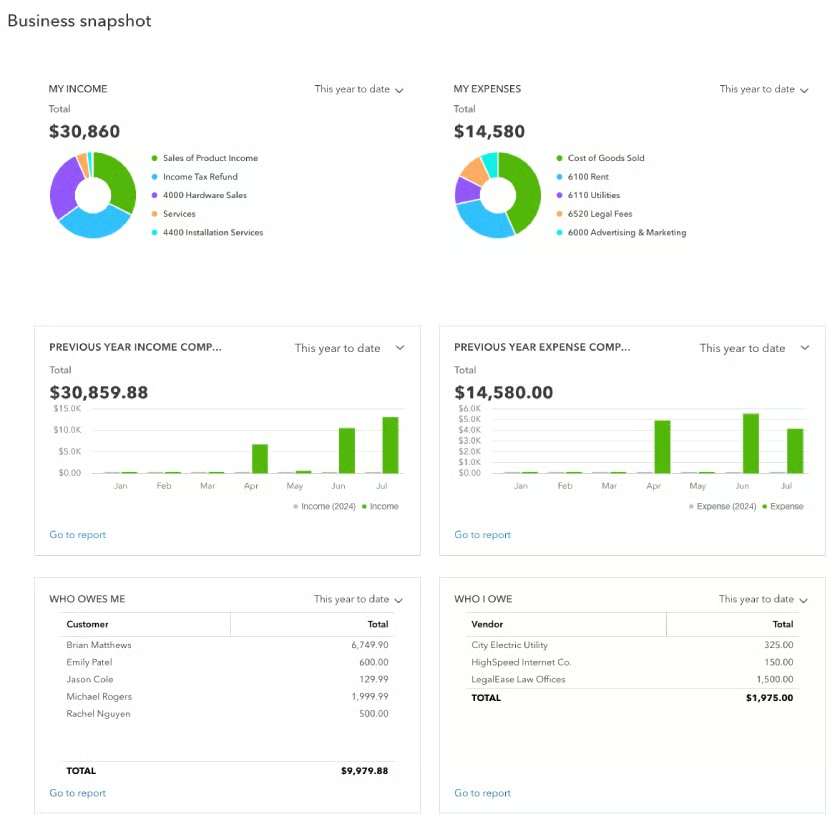
Business snapshot in QuickBooks Online
Bonus reports to check out
The reports in this section are more specific to certain industries or business types. Some businesses may use them frequently, while others might not need them at all. Still, they’re worth checking out because they can uncover valuable insights that are especially useful in certain situations.
- Budget vs actual is useful if you do your budgeting directly in QuickBooks. It allows you to track your actual financial figures against your budgeted amounts. You can quickly see if you’re going over or under budget, if your expenses are creeping up, and if you’re meeting your sales goals or falling short.
- Sales tax liability report is essential for businesses required to collect and remit sales taxes. It helps you track how much sales tax you’ve collected and how much you owe to tax authorities, making it easier to stay compliant with IRS and state tax regulations.
- Inventory valuation summary is ideal for product-based businesses that manage physical inventory. It helps you monitor the total value of your stock, track inventory levels, and see how much capital is tied up in goods.
- Open purchase order summary shows all open or outstanding purchase orders. It’s useful for tracking incoming inventory or supplies, managing cash flow expectations, and planning for upcoming stock replenishments or project expenses.
- 1099 contractor balance summary is valuable for businesses that work with freelancers or independent contractors. It provides a summary of payments made to each contractor, making it easier to track what you owe and ensuring you meet year-end 1099 reporting requirements without last-minute scrambling.
Custom reports and spreadsheet sync
Most QuickBooks users skip this feature, but it’s one of the most powerful tools available, especially if you need more tailored insights than what standard reports offer. With Custom Reports, particularly in QuickBooks Online Advanced, you can build reports that match your unique business needs.
Using the built-in Report Builder, you can
- filter by accounts, customers, vendors, products, or time periods
- create pivot-style reports
- add custom fields
You can also save and share these reports, helping your teams focus on the exact data that matters most.
Meanwhile, Spreadsheet Sync takes reporting a step further by integrating QuickBooks Online Advanced with Microsoft Excel or Google Sheets. You can
- pull live data into spreadsheets
- create custom dashboards
- edit records in bulk
- sync changes back into QuickBooks
It’s especially useful if your business wants advanced analysis and multi-company reporting or needs to build custom financial models while staying connected to real-time accounting data.
Frequently asked questions (FAQs)
As a CPA, here are the reports that you should run weekly:
- P&L statement
- Open invoices
- A/R aging summary
- A/P aging summary
- Expense and sales reports
These reports are essential to every industry.
During tax season, you’ll need the following:
- P&L statement
- Balance sheet
- General ledger
- Expenses by vendor summary
- 1099 transactions detail
- Tax liability report
Yes, QuickBooks Online offers extensive customization options. You can add custom fields tailored to your business needs, organize data through grouping and sorting, and edit layouts by rearranging columns and adjusting presentation formats. Additionally, you can save custom reports for repeated use and securely share them within your team.
For more advanced features like the Custom Report Builder and Spreadsheet Sync, QuickBooks Online Advanced provides expanded capabilities.
The main difference between the A/R Aging and the Open Invoices reports in QuickBooks lies in how the outstanding customer balances are presented. The A/R Aging Summary shows unpaid customer balances grouped by how long they’ve been overdue, helping you understand overall receivables. Meanwhile, the Open Invoices report lists all unpaid invoices, regardless of due date, making it useful for tracking specific outstanding invoices and following up with individual customers.
First, determine what kind of information you need to know. From there, decide if that information is something you need to know monthly.
To choose which reports to review monthly, identify the specific information that’s most important for managing your business. Then, determine whether this information needs to be monitored every month to help you make informed decisions and stay on top of key performance areas.
Yes, but you have to create those manually via the Custom Report Builder because QuickBooks Online doesn’t come with built-in industry reports.