

The best Gantt chart software lets teams easily view project tasks and timelines. Features like task dependencies, custom roles, and project milestones help managers monitor and distribute tasks fairly across teams. Gantt chart software prices vary widely, but most providers offer free plans. When choosing Gantt chart software for small companies, consider ease of use, affordability, and versatility.
We compared different Gantt chart software solutions to help you find the best one for your business.
- ClickUp: Best overall solution for client and project tracking
- monday.com: Best for visualization and easy-to-use charts
- Wrike: Best for scheduling and resource management
- Zoho Projects: Best for affordability
- Microsoft Project: Best for advanced Gantt charts
- GanttPRO: Best for budget management
- ProofHub: Best for scalability
- Best Gantt Chart Software Compared
- ClickUp: Best Overall Solution for Client & Project Tracking
- monday.com: Best for Visualization & Easy-to-use Charts
- Wrike: Best for Scheduling and Resource Management
- Zoho Projects: Best for Affordability
- Microsoft Project: Best for Advanced Gantt Charts
- GanttPRO: Best for Budget Management
- ProofHub: Best for Scalability
- Frequently Asked Questions (FAQs)
- Bottom Line
Best Gantt Chart Software Compared
| Best Gantt Chart Software | Monthly Starting Price Per User | Key Features | FSB Rating |
|---|---|---|---|
| $10 |
| 4.7 out of 5 | |
| Visit ClickUp | |||
| $12(for three seats) |
| 4.67 out of 5 | |
| Visit monday.com | |||
| $9.80 |
| 4.48 out of 5 | |
| Visit Wrike | |||
| $5 |
| 4.39 out of 5 | |
| Visit Zoho Projects | |||
 | $10 (for annual subscription) |
| 4.36 out of 5 |
| Visit Microsoft Project | |||
| $9.99 |
| 4.19 out of 5 | |
| Visit GanttPRO | |||
| $50(flat-rate pricing) |
| 3.9 out of 5 | |
| Visit ProofHub | |||
ClickUp: Best Overall Solution for Client & Project Tracking
ClickUp Monthly Pricing*
- Free Forever: Unlimited members, 100MB of storage, real-time chat, up to 60 uses of Gantt view, and in-app video recording
- Unlimited: $10 per user for unlimited Gantt charts, native time tracking, resource management, and AI-compatibility
- Business: $19 per user for unlimited teams and time tracking, workload management, and goal folders
- Enterprise: Custom pricing for white labeling, unlimited custom roles, default personal views, and extensive data security and privacy compliance
*ClickUp offers a 100% money-back guarantee. Save up to 30% with annual billing.
ClickUp ranks as our best Gantt chart software for small businesses when it comes to updating clients on project progress, thanks to its generous free plan and collaboration tools (e.g., file storage and task management). Teams can create Gantt charts for every project, highlighting key progress and milestones. This makes it easy to share updates with clients, building trust and providing project transparency.
Improve project planning efficiency with its chart templates for different uses, such as web development, product launches, and construction. The versatile and customizable platform allows users to create custom views and workflows.
Before choosing the task management software ClickUp, note that while paid plans get unlimited storage, its free forever plan only comes with 100MB. Zoho Projects’ free plan has a larger 5GB storage space if you need more storage. More storage is advantageous for teams handling large, complex files and those storing historical project data.
ClickUp Features
- Progress percentage: The actual progress percentage figures show your accomplishments in individual tasks. This information lets you adjust resources to avoid project delivery delays.
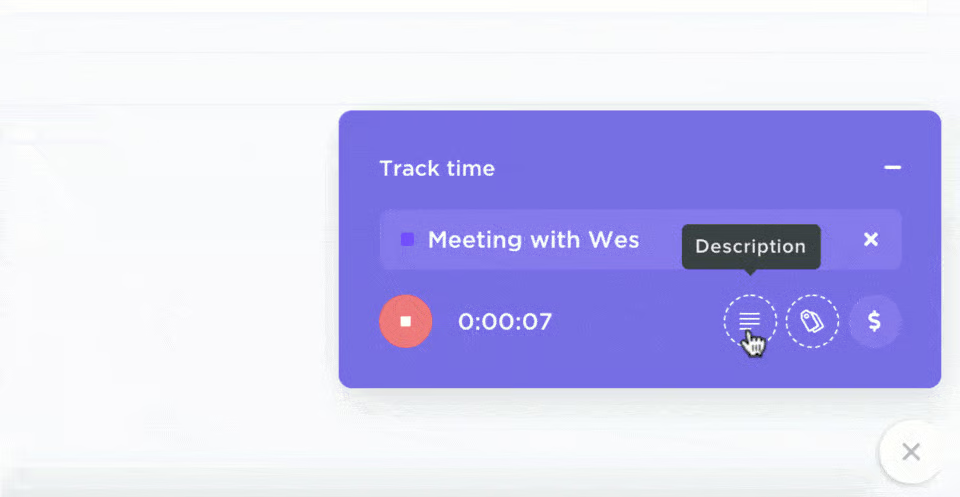
- Time tracking: Determine how much time you spend on each task to measure productivity. ClickUp has a built-in timer that allows users to include details on how many hours were used.
- Due date remapping: Edit the task deadlines, and the system automatically adjusts the subtasks’ due dates. This is especially useful if you have a long list of sub-assignments that must be altered when the parent task gets a new deadline.
monday.com: Best for Visualization & Easy-to-use Charts
monday.com Monthly Pricing*
- Free: Up to two seats, three boards, unlimited documents, over 200 templates, and eight column types
- Basic: $12 per user for unlimited free viewers, boards, and documents, a one-week activity log, 5GB file storage, Gantt views, custom fields, and 24/7 customer support
- Standard: $14 per user for private boards, time tracking, custom dashboards with up to 10 boards, 20GB storage, and 250 automation and integration actions, six six-month activity log
- Pro: $24 per user for 25,000 integration and automation actions, timeline and Gantt views, time tracking, dependency column, workload view, and 100GB of file storage
- Enterprise: Custom pricing for 250,000 integration and automation actions, 99.9% uptime guarantee, single sign-on, and 1,000GB of file storage
- Free trial: 14 days
*All paid plans have a three-seat minimum. Save 18% with annual billing.
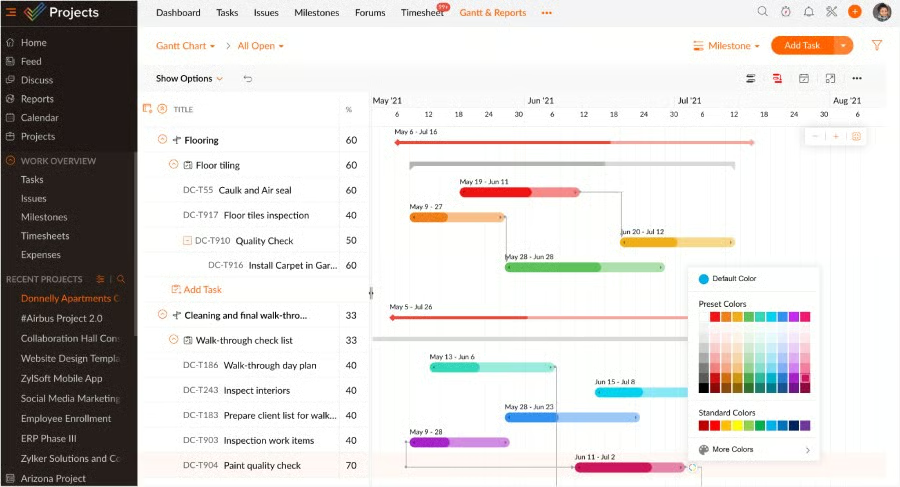
monday.com is the best Gantt chart software for aesthetic data displays, thanks to its custom and interactive view options, such as Gantt, Kanban, and calendar. Customize your charts and views with different colors and labels to help with readability and overall aesthetics.
The chart features a simple interface. On the left, there’s a list of board items like tasks and dates. Meanwhile, the actual chart is laid out at the center with colored bars indicating specific groups of board items.
Hovering an item from the left-side list automatically highlights the corresponding chart row, making it easy to pinpoint where that group of assignments is in the timeline. Use widget elements like graphs and progress bars for visually appealing data presentation.
Unfortunately, monday.com only offers Gantt chart views starting with its second-tier plan. A more affordable option is Zoho Projects, which provides this toll in its base-level plan priced at $5 per user only.
monday.com Features
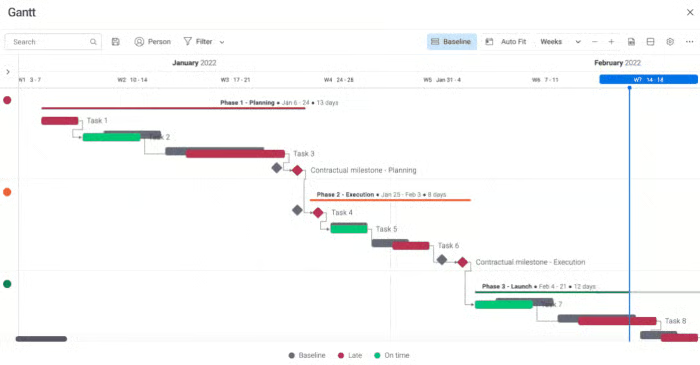
- Baseline: This feature displays how the project progresses over time. It lets you take a literal snapshot of the beginning of your project, providing an accurate reference point as tasks move through the pipeline. As you complete assignments, monday.com highlights the on-track ones in green, the late ones in red, and the baseline in gray.
- Show today indication: This blue line runs vertically through the Gantt chart to mark the present date. With this, it’s easier to see your progress from the start date and the time left to finish assignments before the end date.
- Show weekends: Toggle the “Show Weekends” option in the Gantt settings if weekends are critical to your project timeline. The weekend columns are shaded in gray for easier reference.
Wrike: Best for Scheduling and Resource Management
Wrike Monthly Pricing
- Free: Unlimited users, task management, table and Kanban views, and 2GB of file storage
- Team: $9.80 per user for two to 25 users, calendars, Gantt chart, reporting dashboard, analytics view, 50 automation settings per seat, and custom fields, workflow, and statuses
- Business: $25 per user for five to 200 users, branded workspace, project portfolio management, real-time reports, 200 automation settings per seat, and 5GB of file storage per user
- Enterprise: Custom pricing for five to unlimited users, business intelligence API, single sign-on, 1,000 automation settings per seat, and 10GB of file storage per user
- Pinnacle: Custom pricing for five to unlimited users, advanced analytics and data visualizations, locked spaces, and 15GB of file storage per user
- Free trial: 14 days
Wrike is the best Gantt software for resource management because it allows users to reschedule tasks in bulk and provides features like job roles and workload charts. It distributes tasks based on real-time bandwidth, and its automatic updates feature quickly reflects schedule changes across all related tasks.
Wrike’s integration with other systems like Zoom and Salesforce further enhances overall project efficiency and communication. In addition, Wrike automatically adjusts tasks’ due dates when they overlap with nonworking days. While it’s excellent for project scheduling, its Gantt chart viewing and reporting tools are unavailable on the free plan.
If you’re looking for a provider offering this feature for free, give ClickUp a try. Its free plan comes with 100 Gantt chart uses.
Wrike Features
- Backlogged tasks: These are assignments without specified start and end dates. By default, new tasks are marked as backlogged unless a user adds a start and end date. Note that these assignments don’t appear in the chart’s timeline format since they don’t have assigned dates.
- Lead and lag time: Lead time refers to the required time to complete a task from start to finish, while lag time is the interval between tasks. On Wrike, you can add these variables to lay out the project timeline accurately.
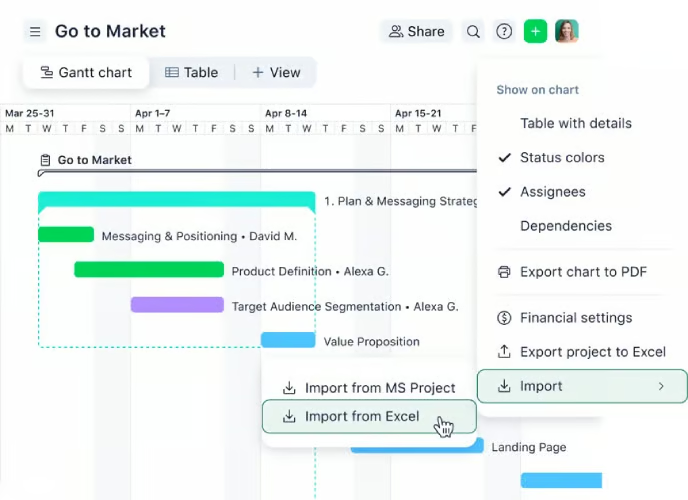
- Data import: You can import data from external sources to your Gantt chart without manually copying items. Wrike supports data import from Microsoft Projects and Excel.
Zoho Projects: Best for Affordability
Zoho Projects Monthly Pricing*
- Free for two projects, 5GB of storage space, basic tasks and reports, prebuilt templates, and task management
- Premium: $5 per user for unlimited projects, 100GB of storage, 20 project templates, project-specific Gantt charts, task duration, and time tracking
- Enterprise: $10 per user for 120GB of storage, 30 project templates, 10 read-only users, Gantt charts across projects, and flexible work hours
- Free trial: 10 days
*Save $12 per user per year with annual billing.
Zoho Projects is the best software for Gantt charts for price-conscious businesses. Monthly paid plans start at just $5 per user. Its free plan supports up to three users and two projects, making it an ideal, cost-effective solution for small teams. Its paid subscriptions include comprehensive features, from charts to time tracking and resource management.
Another benefit of Zoho Projects is its seamless connectivity with other Zoho apps. Use the provider’s CRM, video conferencing, and analytics tools to beef up project planning. However, while Zoho Projects offers a straightforward design, its workflow automation features can take some time. If you’ll use this tool frequently, we recommend monday.com. It provides a beginner-friendly and intuitive automation interface.
Zoho Projects Features
- Taskbar colors: Customize the hues used to represent assignments so they’re easy to distinguish from one another. Assign a specific color to tasks requiring regular follow-ups to increase their visibility.
- Resource utilization: Understand more clearly how resources are used in your project to make strategic adjustments to plans, budgets, or schedules. Zoho Projects displays resource allocation in a heatmap.
- Task reminders: To avoid missing tasks, set task reminders daily, on the due date, or days before the deadline. You can also specify which parties need to be notified about task assignments.
Microsoft Project: Best for Advanced Gantt Charts
Microsoft Project Monthly Pricing*
- Microsoft Planner: Included in Microsoft 365 and comes with Planner app for real-time collaboration, organized tasks, basic plan templates, and task dependency viewing
- Planner Plan 1: $10 per user for project goals, backlogs and sprints, timeline (Gantt) view, task dependencies, and people view
- Project Plan 3: $30 per user for task history, roadmaps, program management, financials and budgeting, and advanced dependencies
- Project Plan 5: $55 per user for portfolio management and enterprise resource management
- Free trial: One month
*You can opt for a one-time purchase, which varies per location.
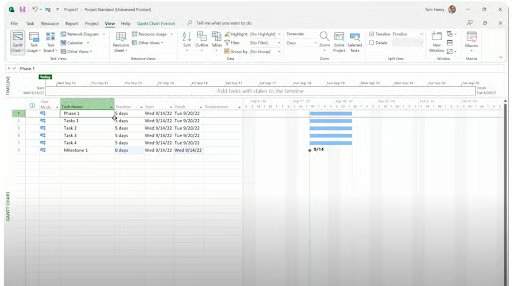
Microsoft Project’s Gantt charts visually represent timelines, showing task duration, dependencies, and critical paths. Use Microsoft Project’s task list to input and schedule tasks. Then, link and organize them into a hierarchy of tasks and sub-tasks, showing task dependencies. See an illustrated version of your task via the Gantt chart view, and change colors and shapes as needed.
In addition to detailed project views, you can connect Microsoft Project with Power Apps to pull data from other sources. Unfortunately, the only way to get an MS Project is to purchase Microsoft 365 or subscribe to the solution. If you’re looking for a free plan, try Zoho Projects. It’s our choice for low-cost Gantt chart software because, aside from a free plan, its paid packages start at only $5 per user monthly.
Microsoft Project Features
- People view: This feature displays the tasks assigned to different team members so you can compare their workloads. You can adjust bandwidth and tasks by dragging them from one column to another to redistribute assignments.
- Portfolio management and optimization: Manage multiple project proposals by better understanding each project’s requirements. Consolidate portfolio data to create specific scenarios, reflecting a portfolio analysis.
- Dependencies: Know how different tasks are related to each other. This solution supports different dependency types, including the default Finish-to-Start, Start-to-Start, Finish-to-Finish, and Start-to-Finish.
GanttPRO: Best for Budget Management
GanttPRO Monthly Pricing*
- Basic: $9.99 per user for Gantt chart grid, board, and list views, milestones, dependencies, and project calendar
- Pro: $15.99 per user for task management custom fields, overdue tasks, and saving project templates
- Business: $24.99 per user for portfolio view, project planning reports, time tracking, resource calendar, and MS Teams and Jira integration
- Enterprise: Custom pricing for custom roles and rights, customer success manager, and onboarding assistance
- Free trial: 14 days
*Save up to 20% with annual billing starting at $7.99 per user monthly.
Teams wanting to monitor costs closely will find GanttPRO the best project management software with Gantt charts because of its robust budget tracking system.
The budget tracker automatically calculates the cost of the whole project based on the resources required for each task. There are three resource categories: labor (calculated per hour), material (per item), and fixed cost. Its user-friendly interface allows managers to create timelines and tasks with ease.
As you add tasks in GanttPRO, assign values for each resource, such as $5 per hour for labor and $10 per item for materials. GanttPRO automatically calculates task costs by multiplying labor costs by the estimated completion time and material costs by the quantity needed.
It then sums up these individual costs to determine the total project cost. Unfortunately, GanttPRO has limited third-party platforms. Check out monday.com as it integrates with over 200 apps.
GanttPRO Features
- Collaboration: Include notes on tasks and attach files to them to guide team members on how to work on the assignments. GanttPRO allows users to send files from Google Drive.
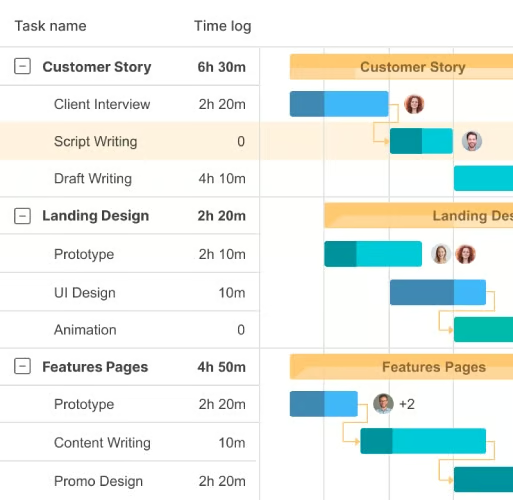
- Time log report: This report displays when and how much time team members spend on specific tasks to measure individual productivity and team efficiency. Users must log their time on the built-in timer to generate this report.
- Project calendar: Stay within the proposed project schedule by defining your start and end dates, working days, and working hours. The system automatically prompts you to create the project calendar when you begin a new project.
ProofHub: Best for Scalability
ProofHub Monthly Pricing*
- Essential: $50 for unlimited users, 40 projects, Gantt chart, time tracking, discussions, custom roles, and 15GB of file storage
- Ultra Control: $99 for unlimited projects, workflows, priority support, detailed activity logs, and 100GB of file storage
- Free trial: 14 days
*The subscription rates drop to $45 and $89 when you pay annually.
ProofHub is the top Gantt chart tool for businesses scaling up their project management teams because it offers flat-rate pricing for unlimited users. This enables growing businesses to add as many team members as needed without worrying about escalating costs.
Its entry-level subscription includes essential task management capabilities, like boards, time tracking, custom fields, proofing, and file approval.
The Gantt chart feature lets you determine task dependencies, identify critical paths, and set constraints to ensure you don’t miss important deadlines. While its flat-rate subscription fees are excellent for large teams, ProofHub doesn’t have budgeting tools, which is crucial for businesses looking to monitor and manage expenses. Consider GanttPRO, our choice of Gantt chart software for budget management.
ProofHub Features
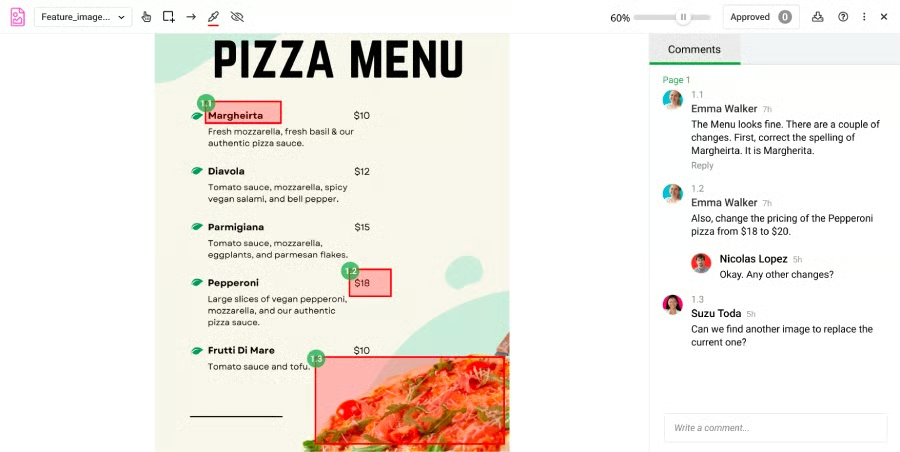
- Proofing and review: Use the markup tools to comment or approve documents and other collaterals. Interact and exchange ideas on the annotation tool.
- All time: View all the time entries across all projects from all users in one place to get an overview of how team members use their time to work on tasks. If you’re looking for specific entries, use the filters and narrow down results by the project’s name, people, status, or date range.
- Labels: Categorize tasks according to priority level or task status. Assign colors to each label to help team members distinguish one another easily.
How We Evaluated the Best Gantt Chart Software
Frequently Asked Questions (FAQs)
What is the best free Gantt chart software?
Based on our review, ClickUp is the best Gantt chart solution with a free plan. Its zero-payment option has limited Gantt chart usage, task management, and unlimited projects. ClickUp is easy to use and customizable. And it allows teams to collaborate directly within the Gantt chart view for real-time updates
Does Office 365 have Gantt charts?
Yes, Microsoft Office 365 allows users to create Gantt charts in Excel. It features Gantt chart templates with essential project management elements, like task assignees, progress percentages, and start and end dates. These templates help users avoid the hassle of building charts from scratch.
Is there a free Gantt chart template in Excel?
No, there is no free Gantt chart template in Excel. However, you can follow our guide to create Gantt charts manually in Excel. Or skip the tedious work and download our free Gantt chart templates for Excel and Google Sheets.
Bottom Line
Choosing the best Gantt chart software for your business is crucial to efficiently streamlining your team’s project management process. Gantt charts simplify visualization and make it easier for project managers to identify tasks and their subsequent steps.
Selecting the right tool depends on your specific needs and budget. According to our review, Gantt chart software for small businesses is ClickUp. Give its free plan a try today to discover its capabilities.