


Customer engagement determines how your customers interact with your business. The best customer engagement strategy involves streamlining your engagement process by using the right tools, like customer relationship management (CRM) software, to better track customer interactions. In this article, you’ll discover the 10 best customer engagement strategies and relevant metrics to help you engage with your customers more effectively and improve overall sales.

- 1. Identify Your Ideal Customers
- 2. Build a Brand Voice
- 3. Create Valuable Content
- 4. Use Data to Personalize Customer Interactions
- 5. Streamline Your Engagement Process
- 6. Provide Benefits to Loyal Customers
- 7. Gather & Address Customer Feedback
- 8. Leverage Social Media Gamification
- 9. Set Up a Customer Success Center
- 10. Support Your Service Team
- Importance of Customer Engagement Strategies
- How to Measure Customer Engagement
- Frequently Asked Questions
- Bottom Line
1. Identify Your Ideal Customers
Your ideal customers must be your priority when creating a customer engagement strategy. Map your customer journey and create a customer persona to guide your lead generation and marketing efforts. After that, you can explore customer engagement ideas that appeal to each persona to engage with your ideal customers better.
For example, you can create an actual name for a buyer persona like Rudy the “Mobile Tech-Savvy Baby Boomer.” This persona name helps your team distinguish profiles easily. In this case, Rudy is a 60- to 78-year-old customer who is highly skilled and knowledgeable in using mobile apps for various interactions, like site browsing, order processing, or submitting a ticket. Ultimately, Rudy’s qualities reflect his purchasing behaviors.
2. Build a Brand Voice
A crucial aspect of brand identity or how consumers perceive your business is your brand voice. Beyond visual elements, like your brand logo, that make up your brand identity, your brand voice or language must also stand out, which covers language, tone, and personality.
Brand voice covers your core brand pillars (mission, vision, values, and brand positioning) and digital content, like blog posts, email marketing copies, and social media captions. For example, Samsung has a human-centric brand voice with a beautiful blend of reality, optimism, and honesty.

3. Create Valuable Content
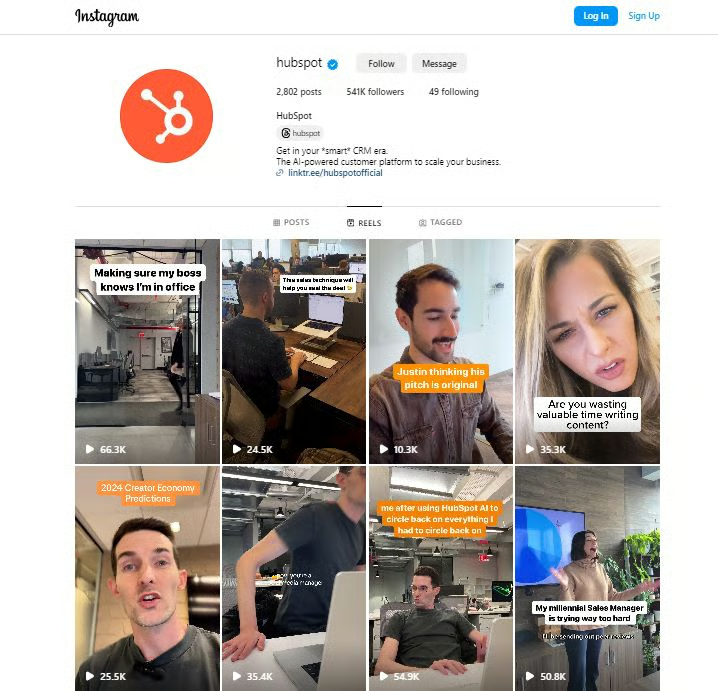
Creating valuable content enhances customer engagement because of the great value they provide. People come back to consume similar content because they consider your brand as a trustworthy and expert source. Therefore, it’s crucial to provide your customers with helpful and relevant content that addresses their pain points. You can publish videos, blogs, and social posts that contain practical tips and product updates your customers will find useful.
For instance, software companies could regularly publish new features added to their products. Creating valuable content like this can help ensure that your existing customers seek you out when they are looking for answers.
4. Use Data to Personalize Customer Interactions
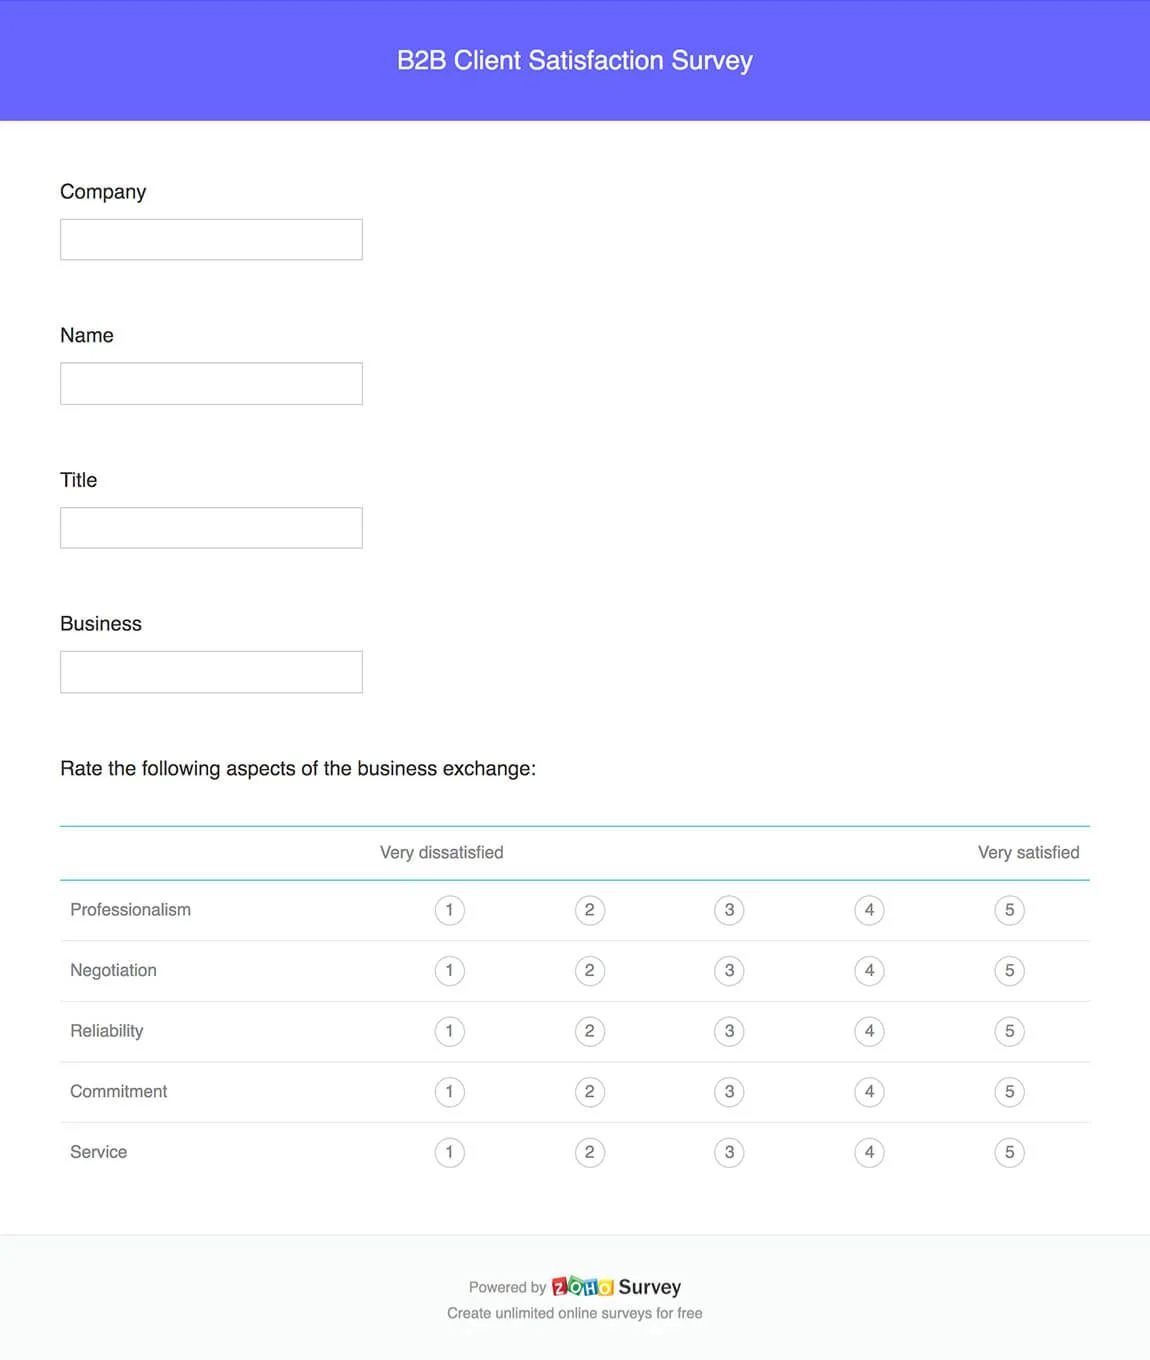
Use customer data and customer satisfaction surveys to gain insights into how you can personalize customer interactions. For example, based on a customer’s niche or use case, you can tailor your follow-up meeting or product demo to best suit their needs. CRM providers also allow users to auto-enrich lead data with helpful insights and create ready-made customer satisfaction survey forms or customizable templates.
Additionally, CRM and customer service software systems can track how many email recipients answered the survey, including the open rate. These capabilities help measure engagement rates and gauge marketing and sales campaign effectiveness. However, always remember to strike a balance between personalization and respecting your customers’ data privacy.
5. Streamline Your Engagement Process
One way you can create a seamless customer experience across various channels is by using a customer relationship management (CRM) system, like Salesforce, to organize and automate your customer engagement strategies in one place. Effectively monitoring customer interactions ensures a smoother engagement process, increasing the chances of converting your clients into loyal customers.
Salesforce can specifically help your sales, marketing, service, commerce, and IT departments work more efficiently through an integrated platform called Customer 360, where they can all engage with customers. You can also personalize customer experiences using artificial intelligence (AI). In addition, the sales automation and enablement tools help boost your team’s productivity.
6. Provide Benefits to Loyal Customers
Start a loyalty program to reward your loyal customers and help boost customer retention. Consider giving your customers discounts or freebies on their future purchases, or offer buyers points for every transaction that could be accumulated and redeemed as discounts or items. As part of your loyalty program, you could also offer other free benefits like access to exclusive webinars on topics they might be interested in.
7. Gather & Address Customer Feedback
Customer feedback is a great way to gauge how satisfied your customers are with your product or service. Encourage your customers to leave honest reviews about your company by sending them customer satisfaction surveys or an email link to a page on your website where they can give reviews.
You can also send them a Google review link that leads to your Google Business Profile, then share these reviews on your website or add them to your purchase confirmation email. Reviews serve as a form of social proof that can help establish trust with your customers.
8. Leverage Social Media Gamification
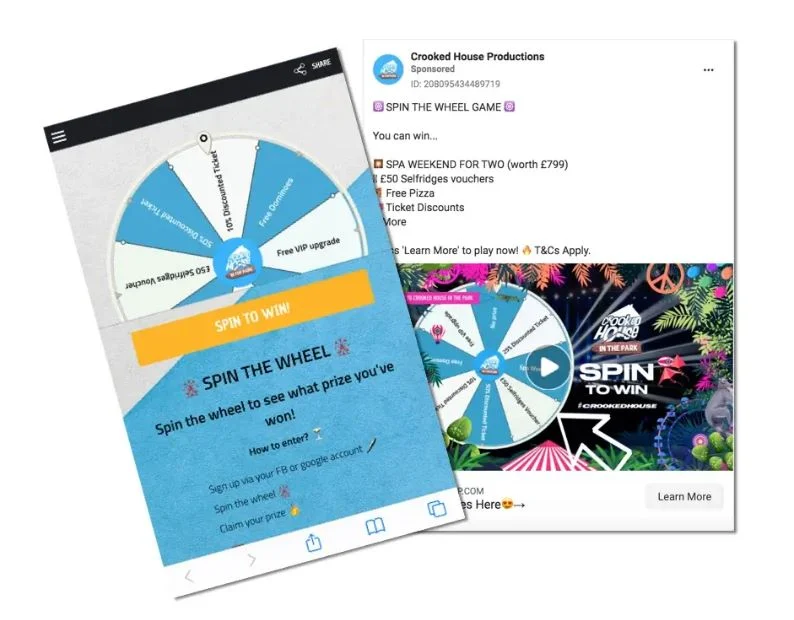
One of the best ways to engage with customers and align sales and marketing efforts is through social media. You can hold trivia contests, crossword puzzles, and challenges to encourage participation, which is a form of interaction. Furthermore, you can use social media to hold awards for contest winners and your outstanding clients to provide great value experience.
By highlighting your brand voice or personality through gamification, social media users get acquainted with your visual elements, posts, and other social signals. Eventually, your target audience becomes familiar with your brand, encouraging them to consider your products and services when the need arises.
9. Set Up a Customer Success Center
A customer success center is a centralized hub you can create to offer expert-created content and helpful resources to your customers. Setting up a customer success center allows customers to get timely access to their most pressing questions and helps them gather information about your product before making a sound buying decision, improving your customer retention rate.
For instance, if you’re selling a tech solution, you can set up a knowledge base on your website with a powerful search engine and filters for customers to browse through content and assist them in understanding more about your solution across all stages of the buyer’s journey.
10. Support Your Service Team
According to the State of the Connected Customer Report by Salesforce, 93% of consumers are more likely to make repeat purchases at companies with excellent customer service. Aside from implementing creative customer engagement ideas, it is crucial to support your customer service reps and team, as they are the ones who primarily interact with your consumers.
Some of the things that you can do to keep your team happy and motivated include providing them with the right technology and training and rewarding high performance. When team members are well taken care of and feel both appreciated and supported, they are better able to deliver excellent customer experiences.
Importance of Customer Engagement Strategies
Customer engagement is crucial in boosting sales and overall business revenue growth. The strategies we highlighted above are effective and actionable based on our expert review of small businesses’ sales performance and processes using technological solutions like CRM systems.
Here are the other benefits of implementing customer engagement strategies for startups and small businesses:
- Better understanding of your customers’ wants and needs: Nearly 100 billion hours of original and licensed Netflix titles were viewed from January to June 2023. This is because Netflix undeniably understands what its customers want by taking into account audience size, premiere dates, and run times. Sales teams can also understand customers better by analyzing audience behavior more objectively with CRM analytics and reporting tools.
- Improved sales performance: Birdeye reported that companies with a solid omnichannel customer engagement strategy keep about 89% of their customers. When your customers interact with your brand more often, your sales increase. CRM systems can help track customer interactions and manage sales pipelines with greater visibility.
- Faster resolutions to customer problems: Omnichannel support can help companies resolve customer problems faster, but Genesys reported that only 13% of organizations offer omnichannel experiences, creating gaps in the buyer’s digital journey. Teams can use a CRM with emailing, telephony, and ticketing management features to provide omnichannel support for prompt issue resolution.
- More loyal customers: Emplifi reported that 86% of customers leave a trusted brand after two counts of poor customer experiences. If you have effective customer engagement strategies, you’ll likely acquire more loyal customers because consumers perceive you as active and sensitive to their needs.
- Personalized customer experience: According to Salesforce, 73% of customers anticipate enhanced personalization with technological advancement. More and more customers want personalized engagement. Hence, utilizing tech tools, such as a CRM, remains critical in developing customer engagement strategies.
How to Measure Customer Engagement
You can monitor certain metrics to measure the relationship between your client engagement activities and customer reactions. However, the set of metrics that you use to define customer engagement may vary depending on the nature of your business. The ones enumerated below are relevant across various industries.
The Net Promoter Score (NPS) measures your customers’ trust in your products and services and their willingness to recommend your business to others. A score of 50 or higher is classified as excellent. Managers can use NPS to measure customer mindset and predict sales growth. Reps can use NPS surveys, like SurveyMonkey, in customer relationship managers (CRMs) to automate feedback gathering throughout the buyer lifecycle and track overall engagement.

The Customer Satisfaction (CSAT) score measures a customer’s level of satisfaction after their interaction with your brand. Respondents are usually asked to rate a product or service on a rating scale via a web form, follow-up email, or phone call using CRM after a customer experience. The higher your CSAT score is, the better. This metric helps you pinpoint which areas in your client engagement strategies need more training or improvement.
Bounce rate is the percentage of website visitors who leave your site without initiating any action or visiting another page. This metric is shown in web analytics tools or CRMs. A bounce rate within the range of 26% to 40% is considered excellent and 56% to 70% is high. Those dissatisfied with your content and the user experience you provide will most likely bounce off to another website. So, it’s important to incorporate quality content in a client engagement strategy.
This metric refers to how happy your customers are with your brand based on how frequently they are returning. Stickiness is an effective way to predict how likely they are to stick with your product or service, as influenced by the desired usage and the stage of the product life cycle. Across all industries, a 20% stickiness rate is already considered good. Teams can visualize stickiness data on a CRM’s sales analytics dashboard.
Social media engagement rates indicate how engaged your customers or followers are with your social content. A good score falls within the range of 1% to 5%, showing that you have good interactions with your audience. CRM systems have built-in or integrated social media analytics tools to measure engagement.
This metric is crucial in measuring your email marketing efforts. It is measured by dividing the change of subscribers by the previous subscriber count and then multiplying the result by 100. A good result is 2.5%. A good engagement rate attracts new subscribers and broadens your potential customers. CRM email campaign analytics provide valuable insights to sales teams as to what types of content prospects prefer to entice them to subscribe to an email list.
Customer referrals increase your brand’s credibility, hasten sales cycles, reduce acquisition costs, and promote higher customer engagement. Customer service and sales teams can use customer referral data in a CRM to create better interactions with prospects and new customers. For instance, you can leverage the experience of the referrer or the person who referred the new customer to establish a good first brand impression and encourage repeat purchases.
The Customer Effort Score measures how much effort a buyer has to put in to engage with your brand. You can set an automated workflow in your CRM software to gauge this metric. This will trigger the automatic sending of a survey form or email after a lead interacts with your website, app, customer support, products, and services. A website or app pop-up box to survey CES is also another example.
Frequently Asked Questions
What is the best customer engagement strategy?
Streamlining your engagement process is the best strategy, which involves using the right tools. Customer relationship management (CRM) systems, such as Salesforce, offer features like artificial intelligence and advanced reporting and analytics for engaging with customers and automating your strategies to view customer interactions better.
What is the difference between customer engagement, satisfaction & experience?
Customer engagement is often confused with customer satisfaction and customer experience. While they are interconnected, they are distinct terms. Customer engagement refers to how the consumer interacts with your brand across all platforms. Customer experience is how the consumer perceives your brand based on what they see, hear, or learn. Customer satisfaction is how much the consumer likes their experience or interaction with your brand.
What is the customer engagement process?
The customer engagement process starts with identifying your ideal customer and then building your brand voice by creating valuable content and personalizing your customers’ experience. Streamlining your customer engagement process using the right tools, like customer relationship management (CRM) and help desk systems, can help you gather customer feedback and implement marketing tactics to acquire more loyal customers.
Bottom Line
Implementing the right customer engagement strategy will improve customer experiences and lead to higher customer retention rates, helping you attract more new customers and close more deals in the long run. You should also measure the success of your customer engagement activities to determine areas for improvement in your strategies.