US rental statistics give renters, agents, landlords, and real estate investors insights into the constantly shifting housing rental market. Looking at US rental market trends is particularly helpful when buying an investment property, listing a unit for rent, or searching for a rental home. I analyzed the latest renters’ demographics and preferences, rent prices, and rental housing vacancy indexes to provide the most accurate look at current real estate rental trends and the state of the market going into the spring season.
Renter Demographic Statistics
Rental market trends can be challenging to keep track of because they can vary drastically in different locations and among different demographics. To help real estate agents, landlords, and investors understand the strongest and weakest housing markets, I’ve gathered important demographic real estate rental statistics, which highlight the differences in renters versus homeowners.
1. 48% of renters are under 30 years old
Research from Doorloop on the overall population of renter-occupied households shows that almost half of renters (48%) are under the age of 30. An additional 24% of renters are between 30 and 44, with the lowest renter rate being 10% for people aged 65 and older.
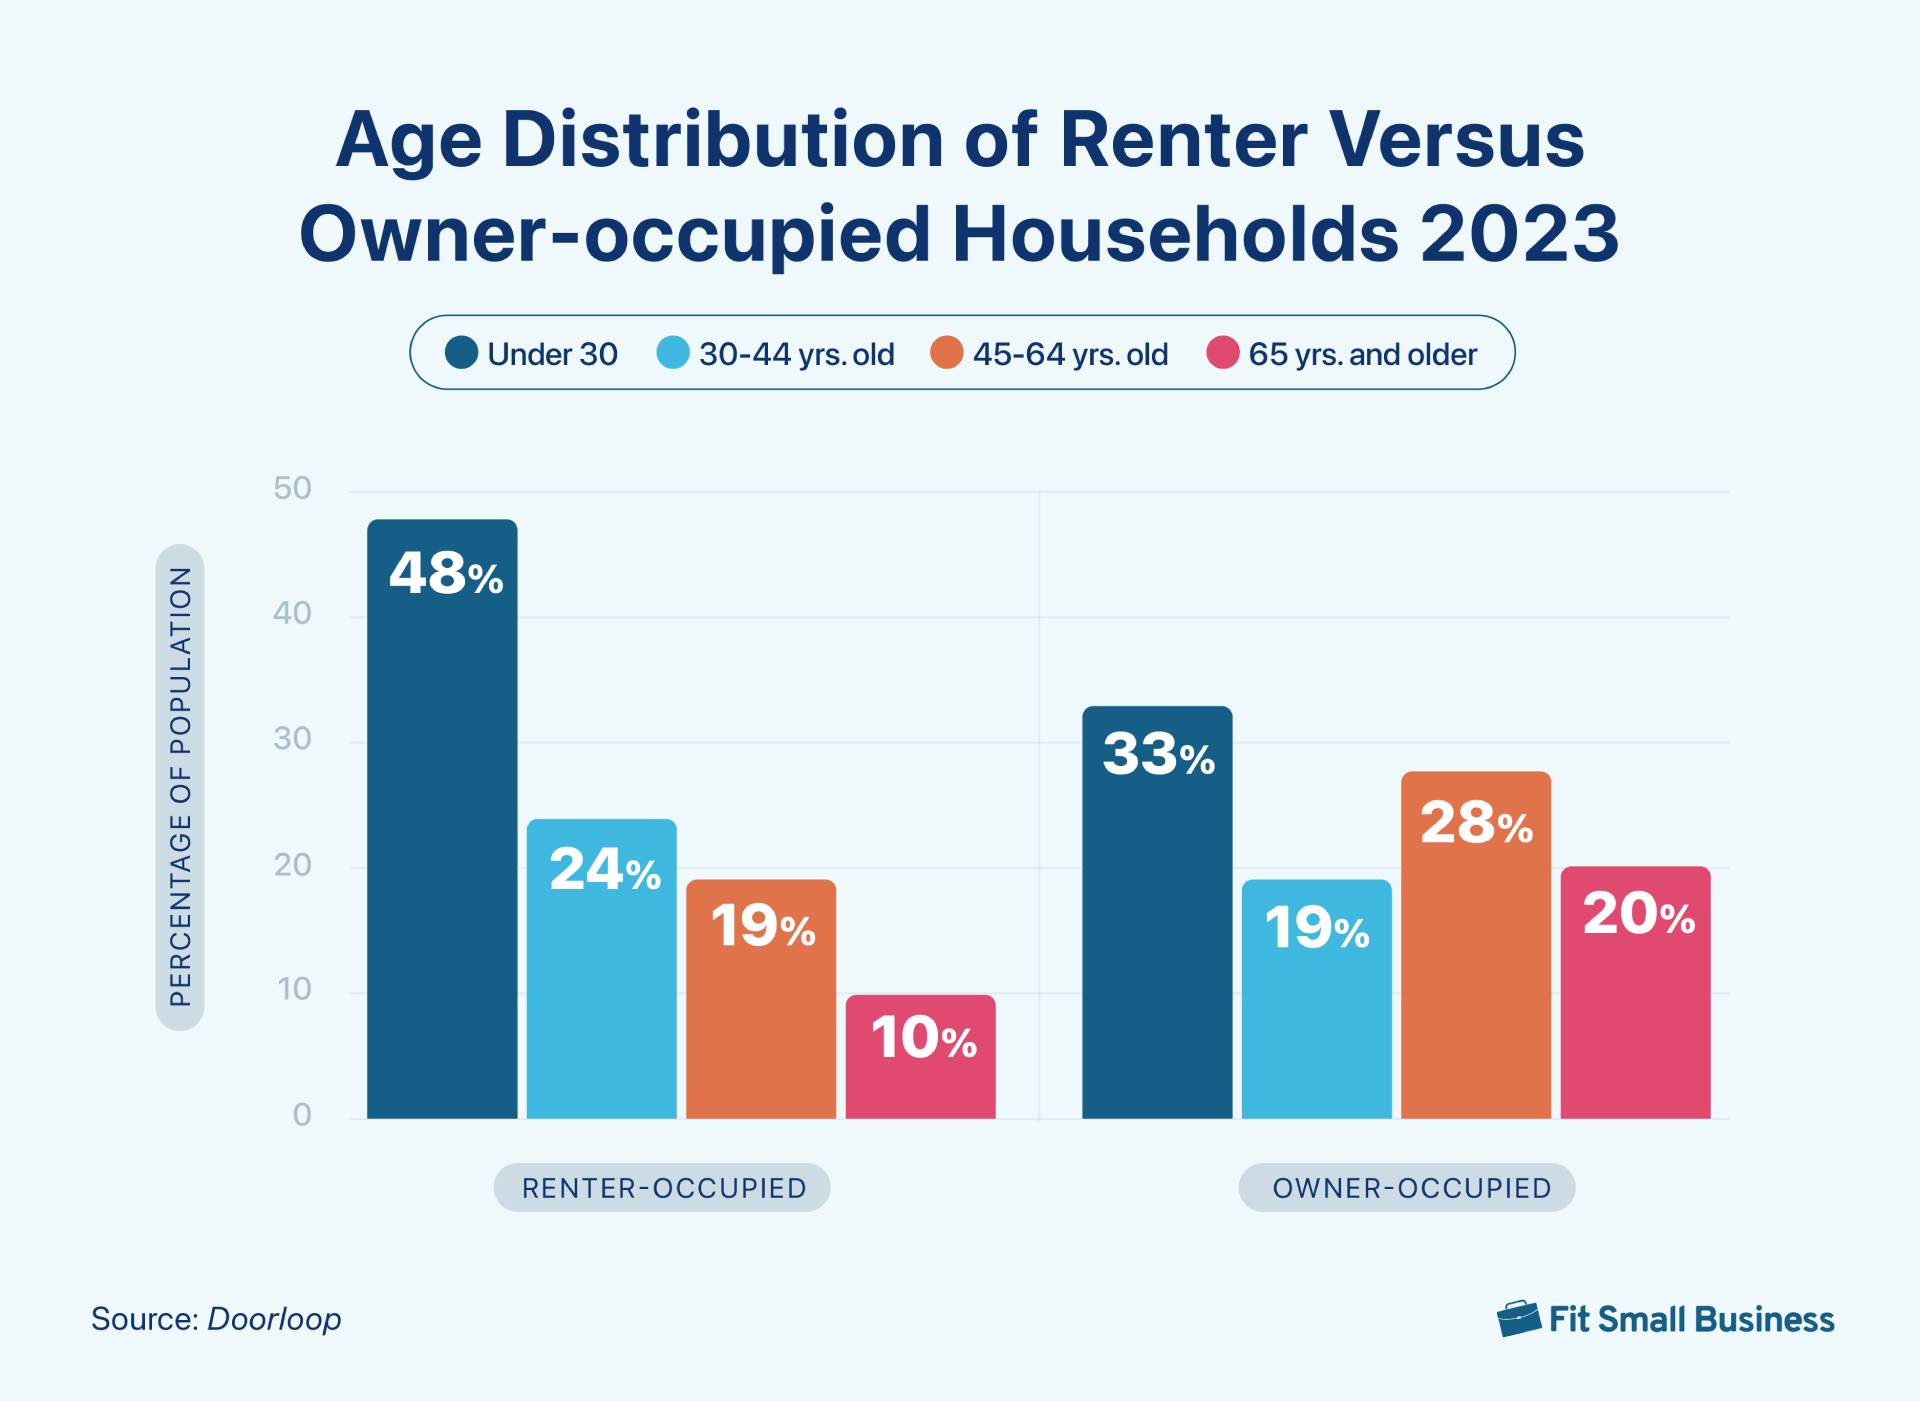
Key takeaway: Knowing these rental trends enables landlords and homeowners—those wanting to rent out their homes—to develop marketing plans that align with their target audience and financial situation. For example, this data indicates landlords should target young adults to effectively fill their rental units.
2. 38.1% of renters live alone
RubyHome reported that the renter household composition shows 38.1% of renters are living alone, 26.1% are married couples, 24.3% are composed of other families, and 11.5% are living with roommates.
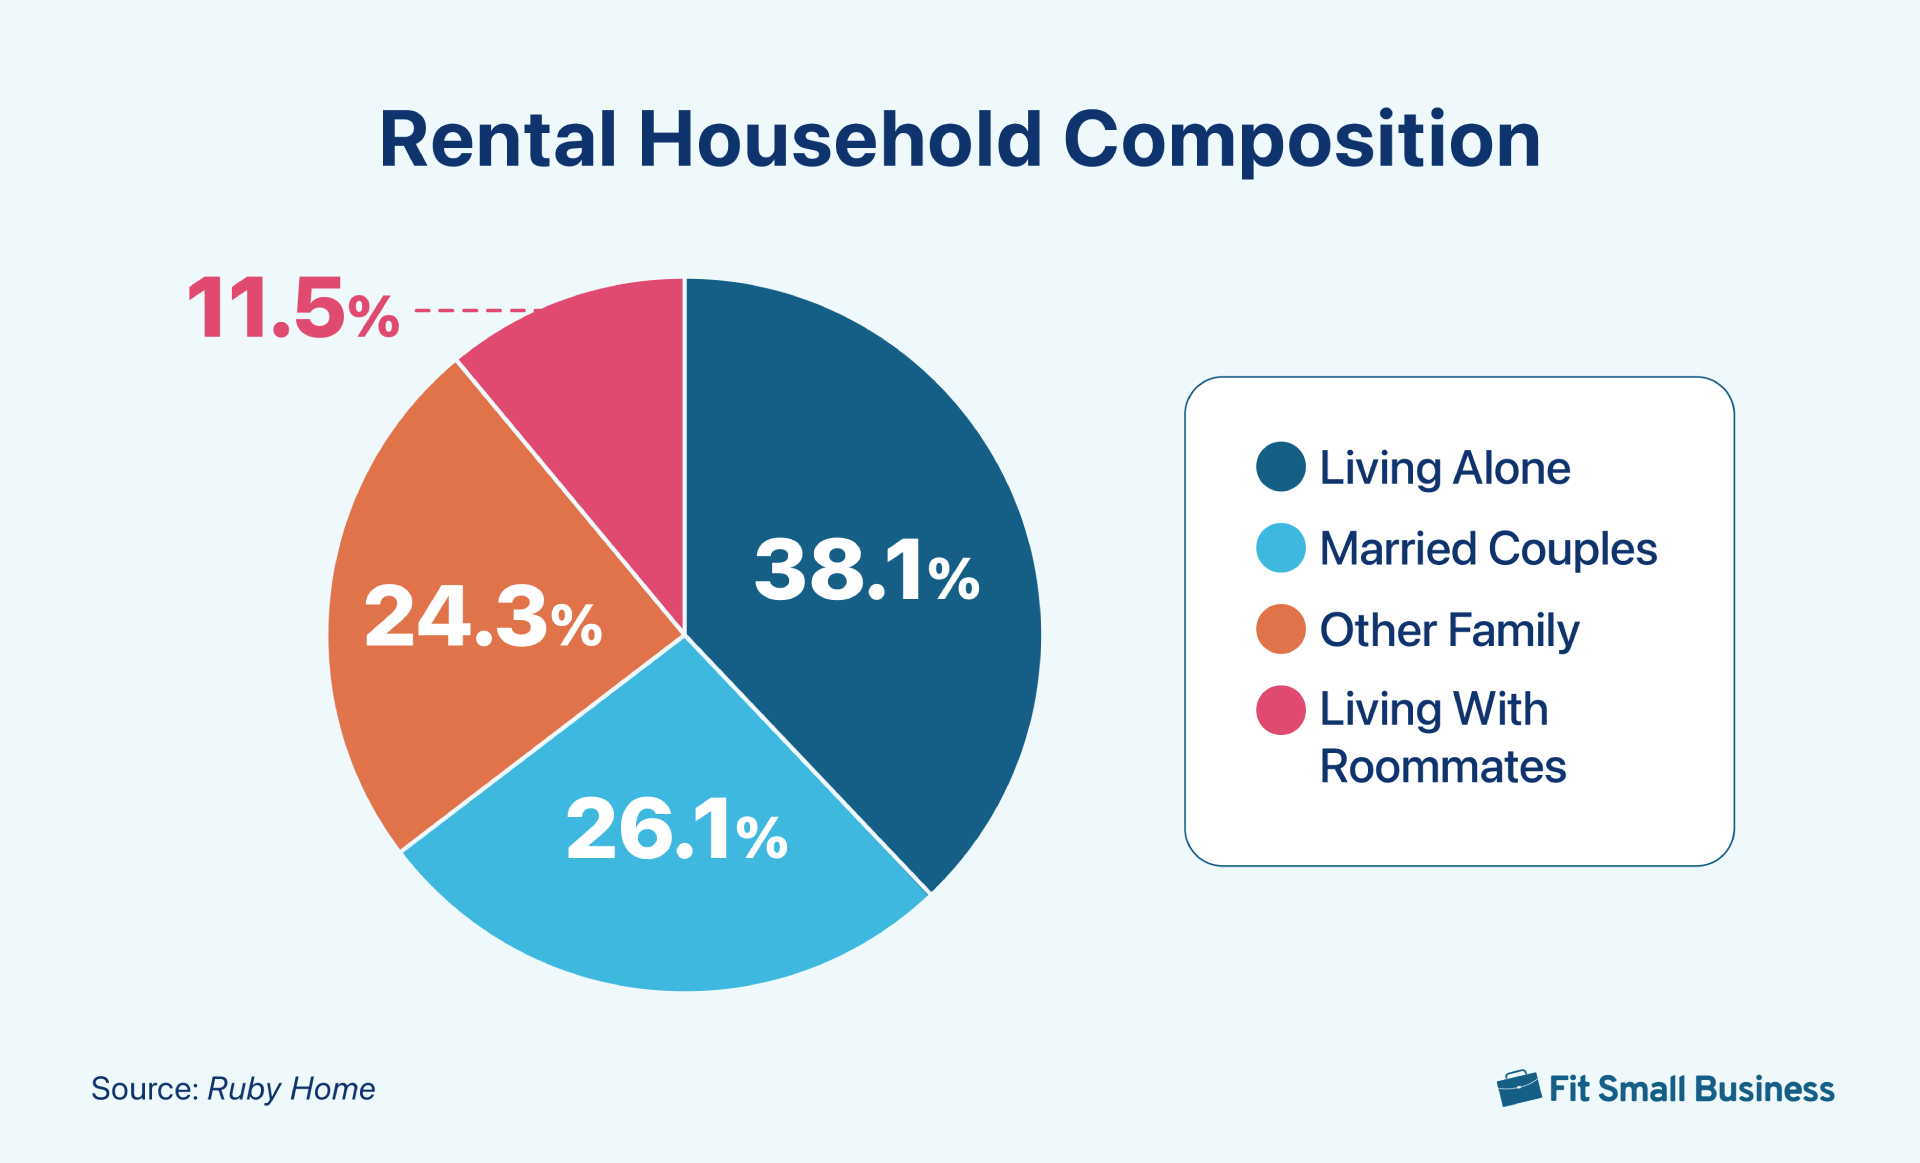
Key takeaway: Knowing the ideal number of occupants is important when learning how to find the right tenants for your rental properties. When investors are looking for properties to purchase, they should consider the area’s demographics. If your target location has more families, consider purchasing homes with more bedrooms. Conversely, studios or one-bedrooms would be more profitable if the demographic comprises single people.
3. 59% of renters have at least one pet
Most recent statistics show that 59% of renters had at least one pet in their home. This is a significant increase from 2018, when only 46% of renters owned a pet. Specifically, 40% of renter households owned at least one dog, and 32% owned one or more cats. Twenty-six percent of these households were more likely to have a pet than a child.
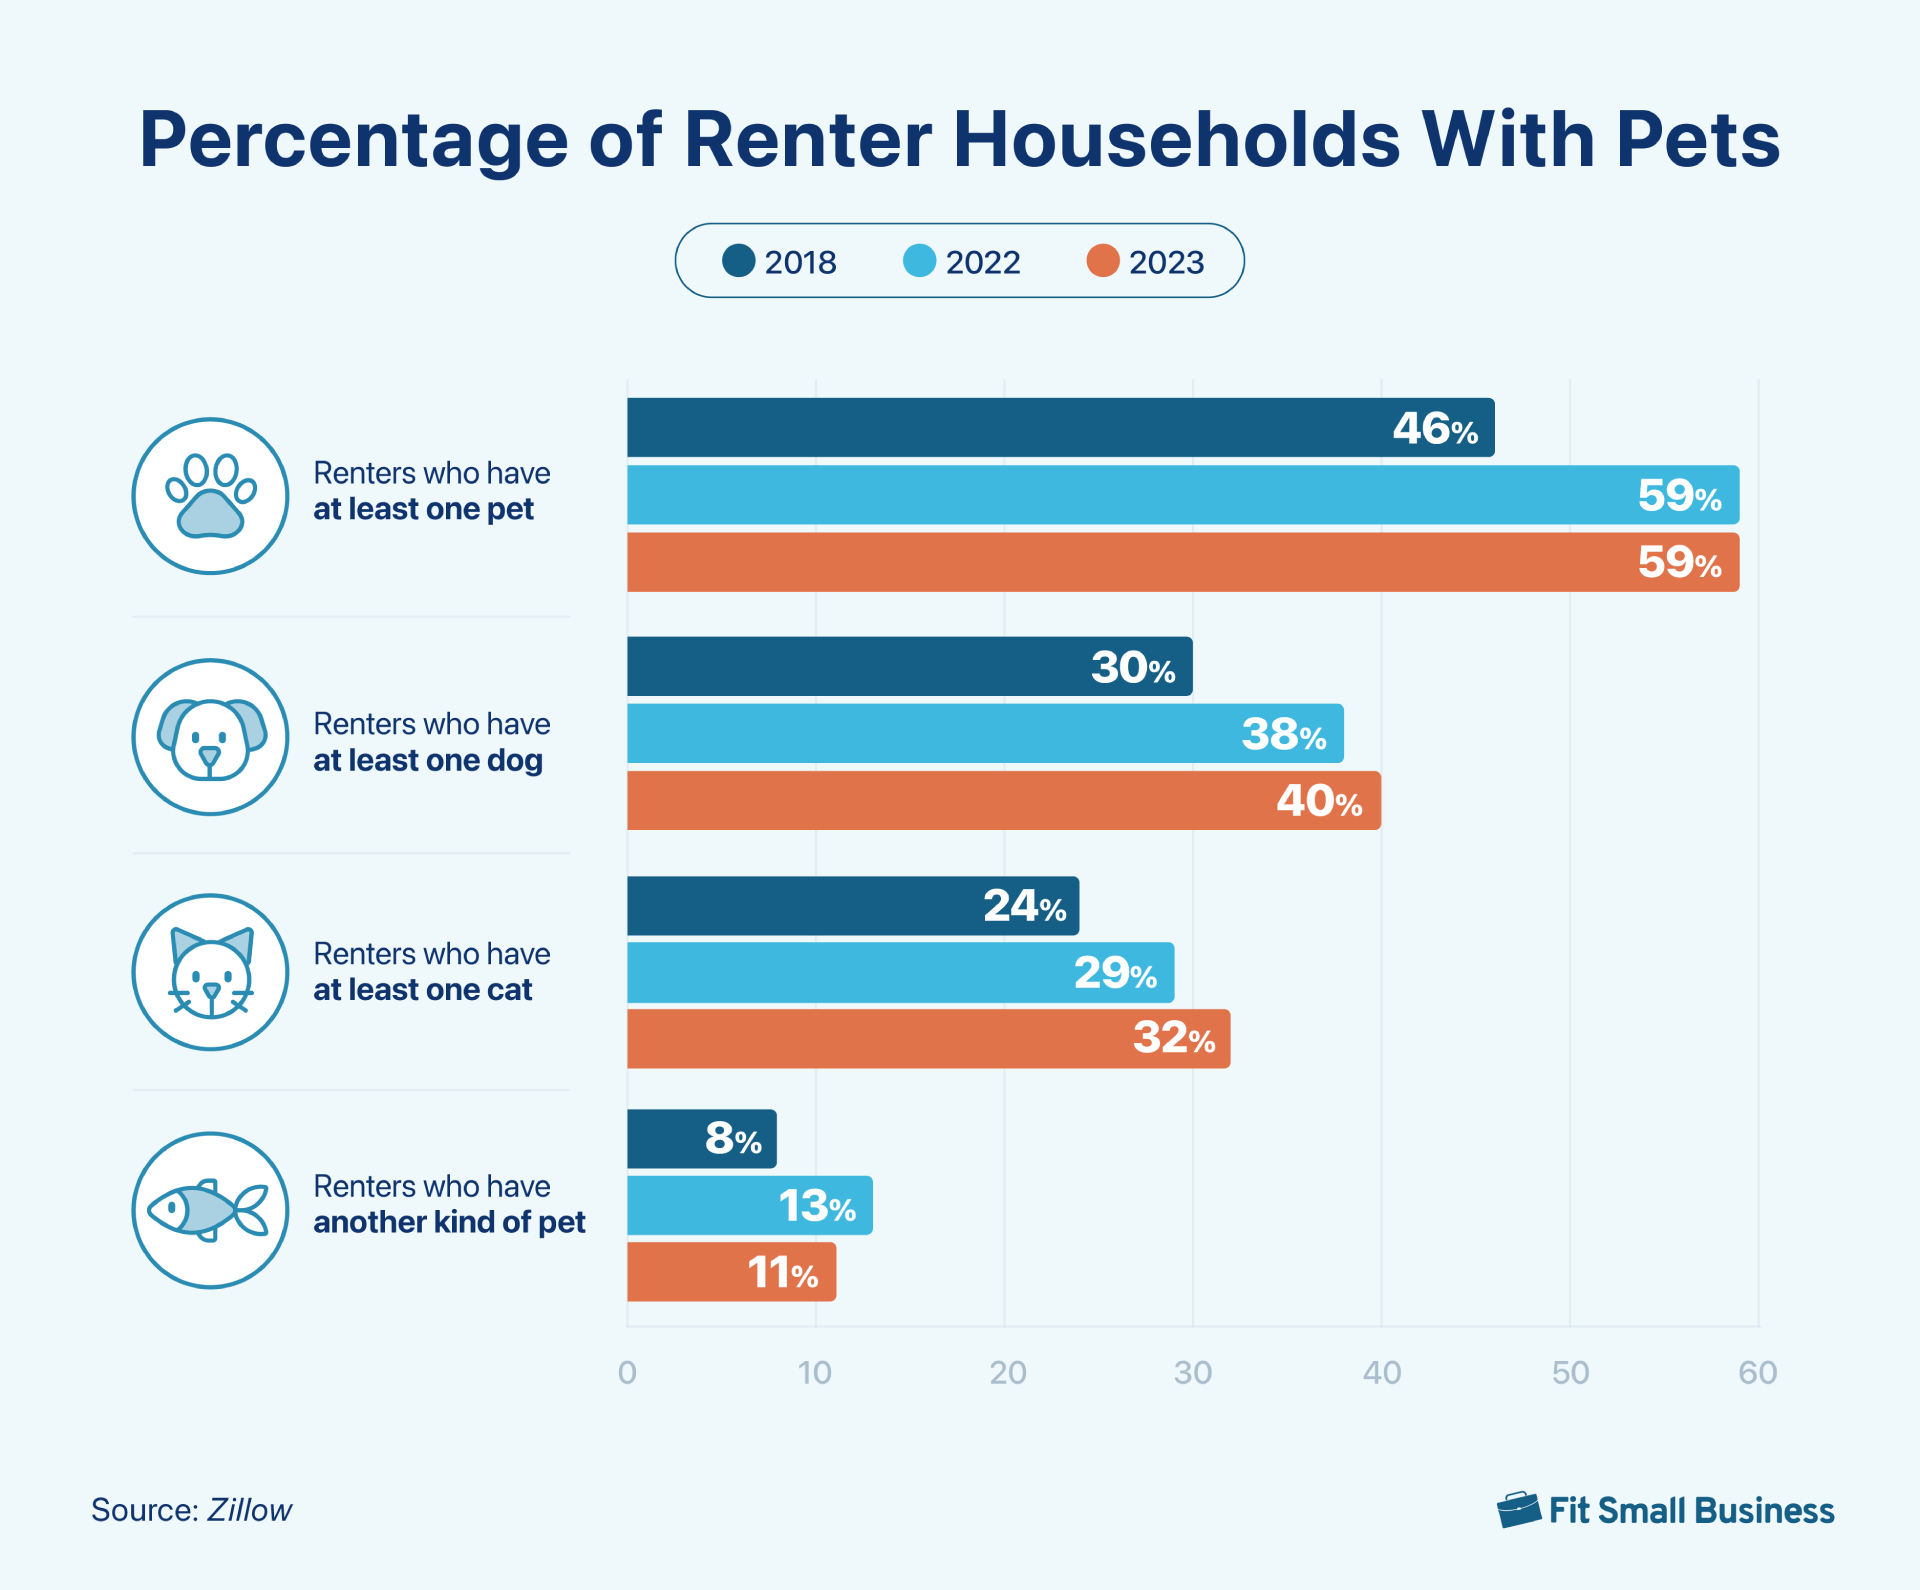
Key takeaway: Since more than half of all renters own a pet, it would be beneficial for landlords to revisit the pet policies if they want to attract more tenants to their real estate rental properties.
4. 52% of renters make less than $50,000 in income
Renters typically earn less per household ($47,301) than the average American ($70,784). Compared to 2022, the average household income has risen approximately $5,000 per year, a likely increase due to cost-of-living adjustments as inflation has risen.
As a result, the number of renters who earn less than $50,000 has dropped from 54% in 2022 to 52% in 2023. Only 28% earn $50,000 to less than $100,000, with 20% earning more than six figures.

Key takeaway: Knowing the average income of rental households is important when determining the right types of rental properties to purchase and the optimal price of rent. Rental households earning an average or below average income will find it challenging to keep up with the continually increasing rent asking prices.
5. Renter households approach 50 million
According to Doorloop, there are nearly 50 million rental units in the US today. The United States Census Bureau found that 50.3% were in a property with one to four units. In contrast, owner-occupied households have increased by almost 10% from pre-pandemic levels, equaling about 86 million households.
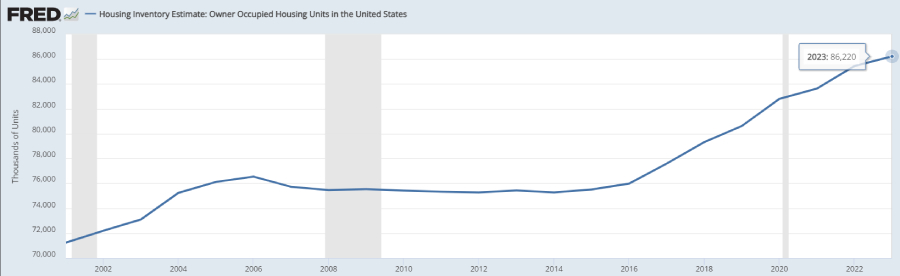
Housing Inventory Estimate: Owner Occupied Units in the US (Source: Federal Reserve Economic Data)
Key takeaway: The percentage of national real estate rentals implies that the majority of Americans can afford homeownership. However, the increases in mortgage rates, home prices, and basic necessities are making it more difficult for people to purchase a home, especially first-time buyers.
6. 52% of millennials now own a home
Just a few years ago, millennials anticipated renting permanently. Surprisingly, this generation has transitioned into an owner majority, with 52% of millennials owning a home in 2022. This leaves Gen Z as the significant target market for apartment owners and builders. Even though homeownership has long been associated with the “American Dream,” rental stats show that younger generations are less likely to own a home.
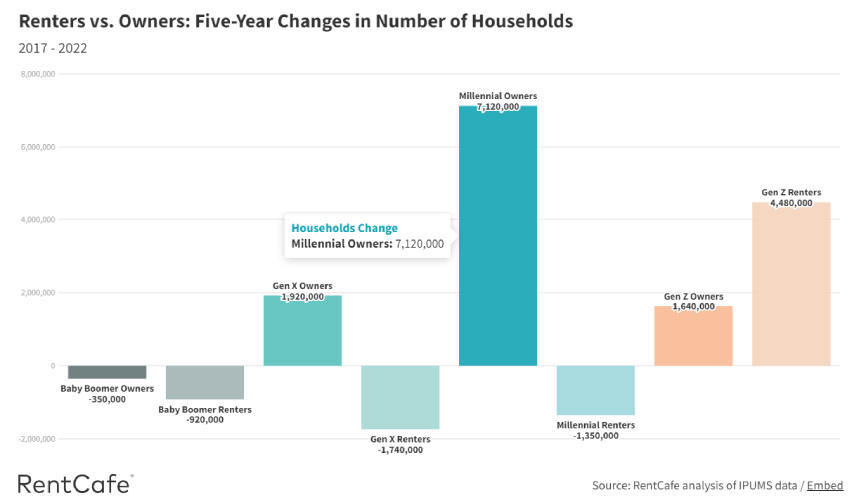
Renters vs owners: Five-year changes in the number of households (Source: RentCafe)
Key takeaway: Increases in income and family support are influencing factors leading to the rise of homeownership among millennials. Millennials saw a 44% increase in salary in 2022, which has since remained more stable. During the pandemic, many moved home and lived with their parents, allowing them to save significant amounts of money for a down payment or receive gifts from parents and family.
7. 64% of renters consider moving within the next three years
According to renting statistics in Zillow’s rental report, 61% of renters say they are considering moving within the next three years. Fifty-two percent of renters also say they’re considering moving in the next year, and 43% of renters are considering a move only when they buy their next home.

Key takeaway: Many renters look for ways to save resources and plan their next moves well ahead of time. This means landlords and rental property owners should consider ways to retain good tenants for longer periods. Nearly half of renters are looking to buy instead of renting, leaving plenty of opportunities for landlords.
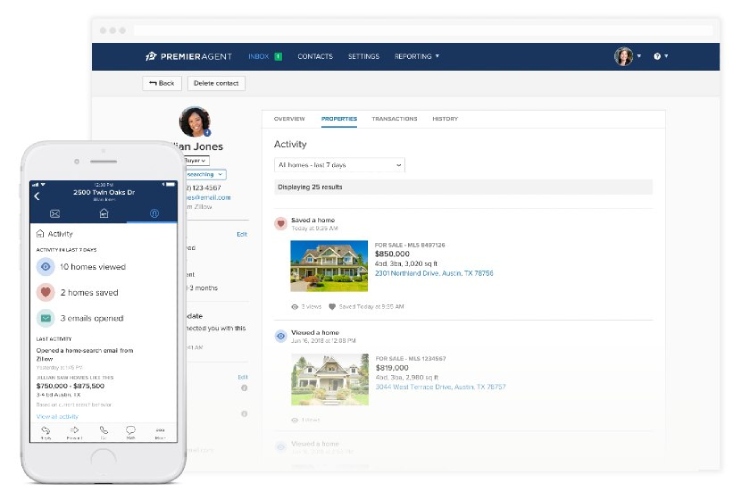
Every landlord must know how to find and attract tenants to fill a new rental property or to replace tenants who move out. To find good quality tenants, consider advertising your property on rental listing sites like Zillow. It is a highly visited website, giving you exposure and allowing you to capture high-quality leads. Zillow’s mobile app enables you to track your leads in real time. Third-party integrations are also available for you to leverage.
8. Renters’ primary priority is affordability
Seventy-two percent of renters said the affordability of the property is the most important factor in staying in a rental. Other important elements include the likability of the landlord or property manager, floor plans, or private outdoor spaces. Amenities, such as a gym or business centers, were cited as least likely benefits to reasons a renter would stay or extend a lease.

Key takeaway: Knowing rental trends and renters’ priorities can help landlords market their properties and keep qualified tenants. Given the focus on affordability, creating a plan to make properties more affordable or valuable will help landlords gain a competitive edge.
9. 74% of renters used mobile devices when searching for rentals
Renters used mobile devices (74%) as their primary tool in researching rental properties. Using a laptop or desktop computer comes second at 68%, followed by a smartphone or tablet at 63%.
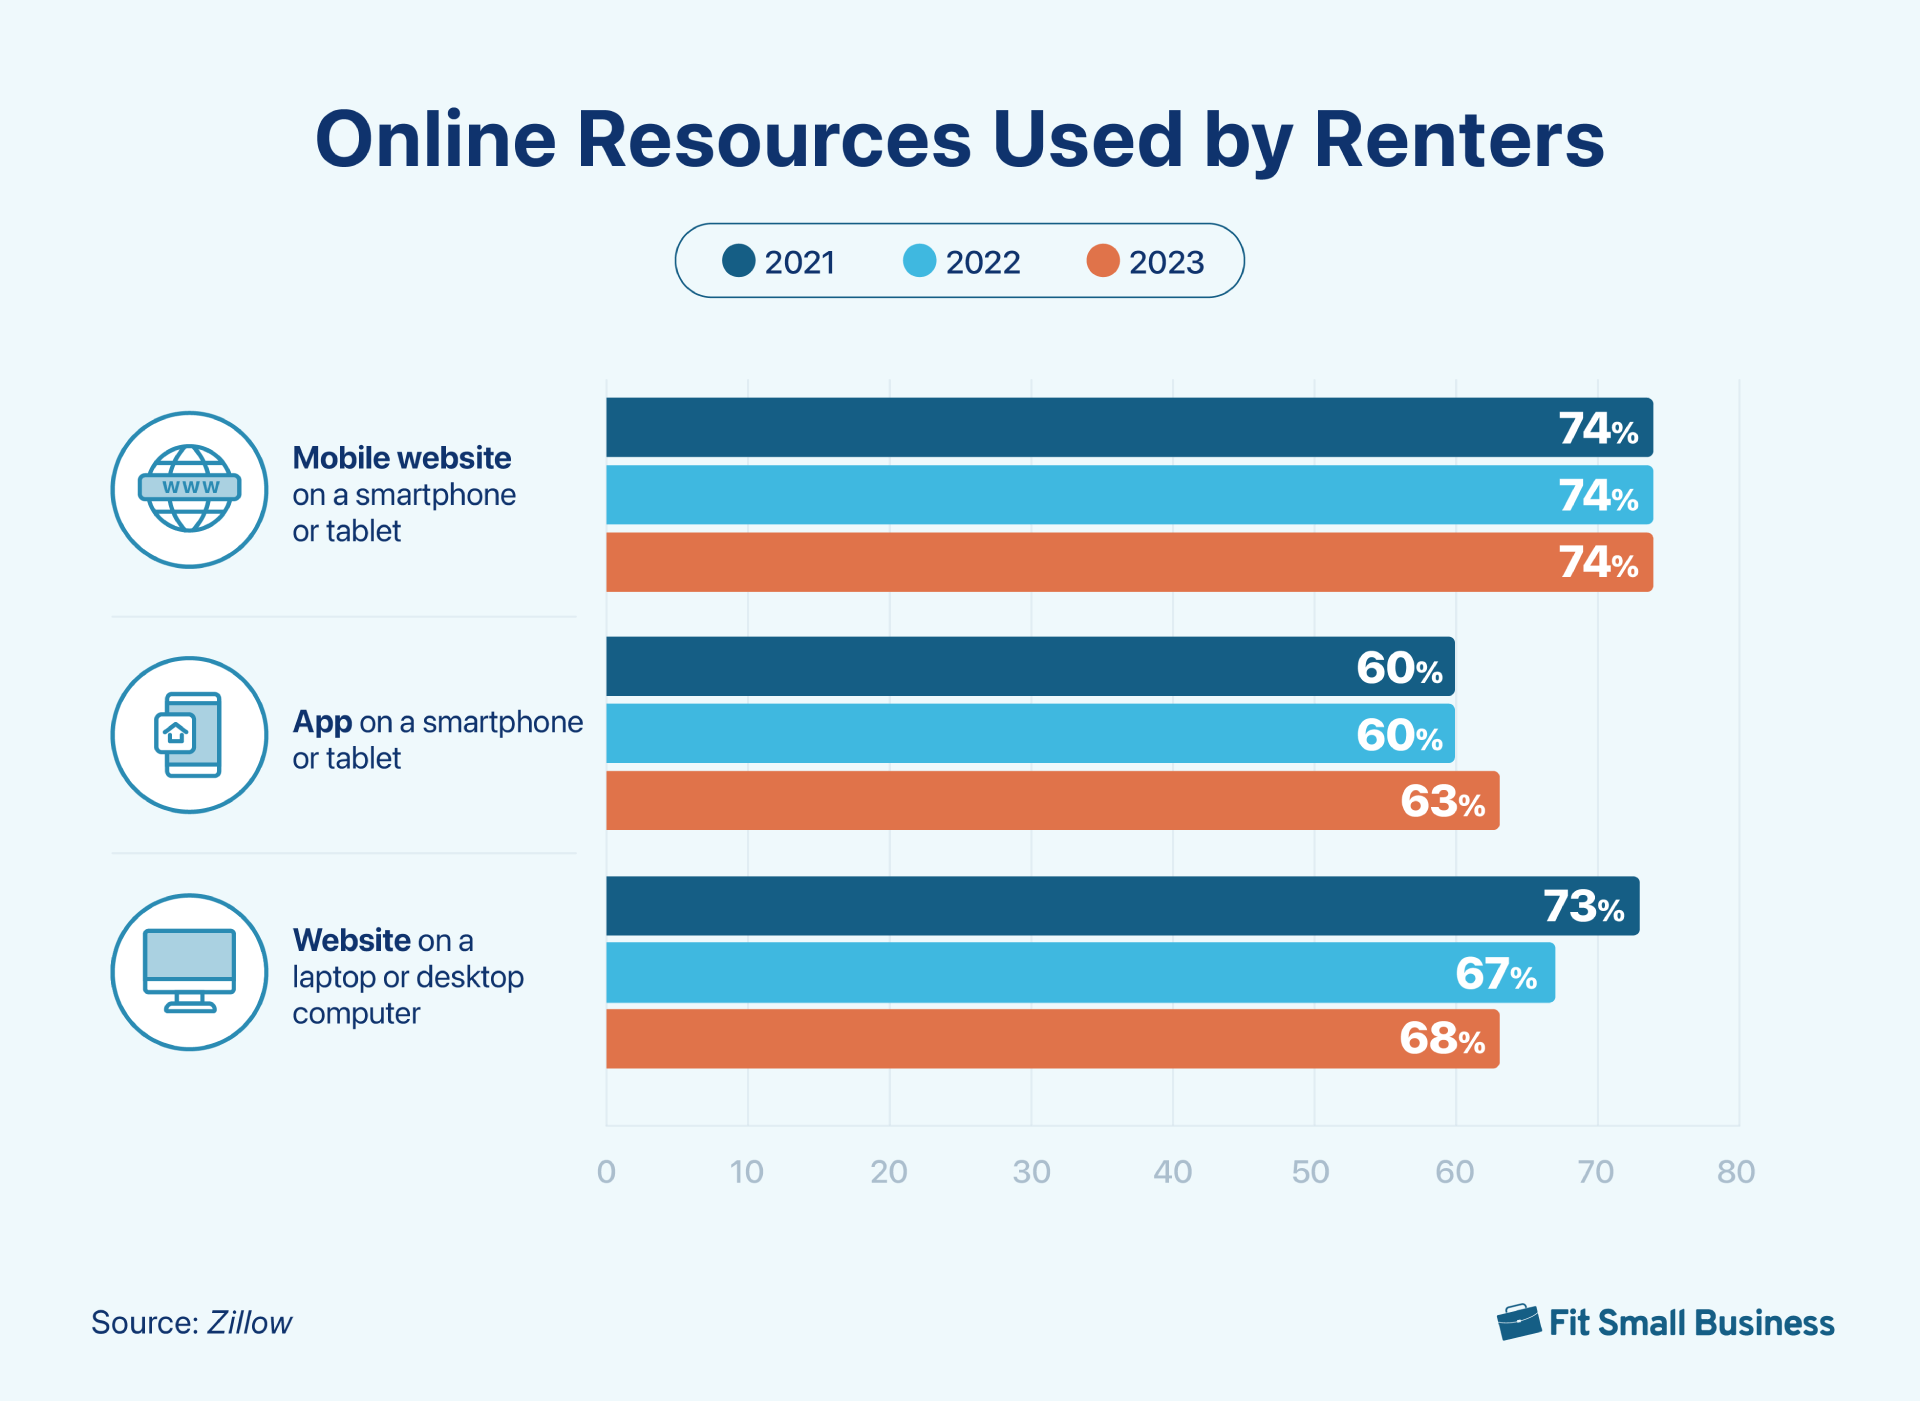
Key takeaway: Online search is generally on the rise across all device types, as seen from many real estate marketing statistics. However, an increasing number of tenants say they search on their smartphones each year. Prospective tenants, particularly younger searchers, anticipate seamless digital experiences like online applications, lease signing, or rent payment solutions.
If you’re a beginner landlord, Baselane is an excellent tool for collecting, automating, and tracking tenant rent payments. Its service is free for budget-conscious landlords who want to save money and utilize a reliable payment system and provides a mobile-optimized tool for both tenants and landlords.
10. 52% of renters signed their lease in-person or on paper
Even though electronic signatures are increasingly common, 52% of renters reported signing their lease physically. However, this figure has decreased by 20% since 2019. On the other hand, the number of renters who signed their lease online jumped to 40% in 2023, increasing by 19% from 21% in 2018.
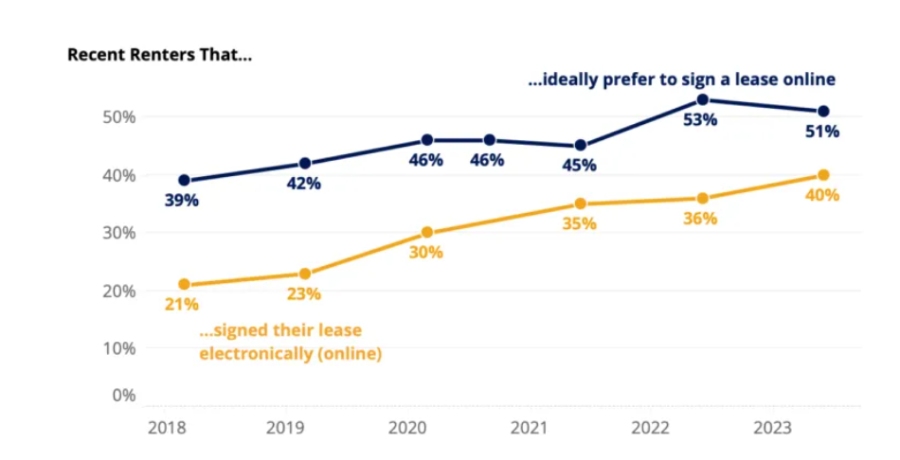
Preferred vs actual electronic lease signing (Source: Zillow)
Key takeaway: These important United States rental market statistics about renters’ processes and expectations show that they appreciate online solutions. Landlords should consider using social media channels to reach the younger demographic of renters entering the rental market.
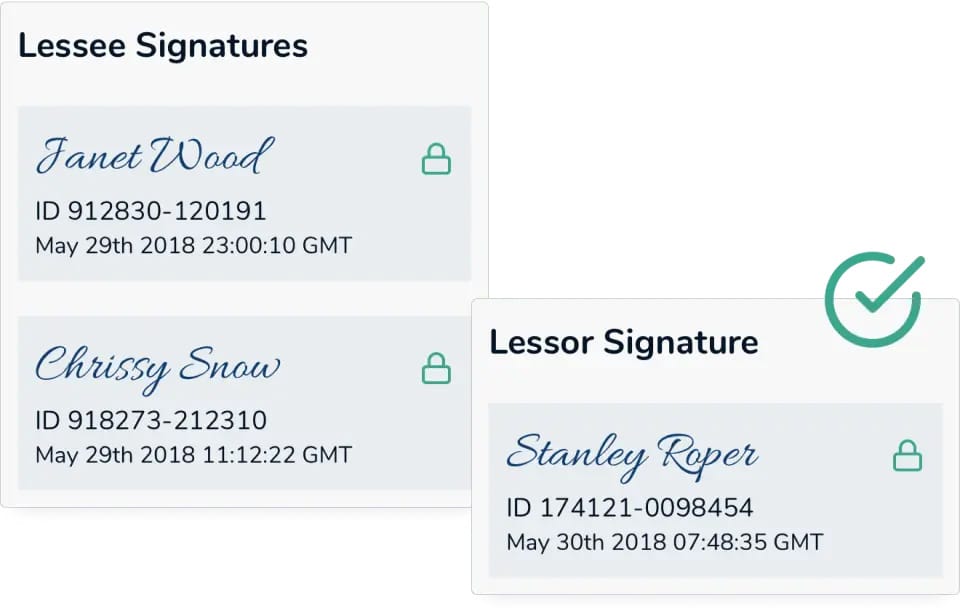
Avail’s digital signature (Source: Avail)
The data above implies landlords should utilize software solutions like Avail for online rent payment services, lease signing, and maintenance tracking. Avail helps investors manage real estate rental properties more effectively. To learn more, read our Avail review.
Rental Property Location Statistics
Landlords and rental property owners should review rental property location statistics regularly to determine which metro areas are the most profitable and the most challenging. Being aware of rental trends can help investors make wise financial decisions and increase their profits.
11. 70% of recent movers changed neighborhoods, stayed local
Approximately 70% of renters who moved said they stayed in the same metro area with 55% of renters living in the suburbs. This statistic has largely remained steady over the last five years. Forty percent of moving renters reported changing neighborhoods, while only 12% stayed put.
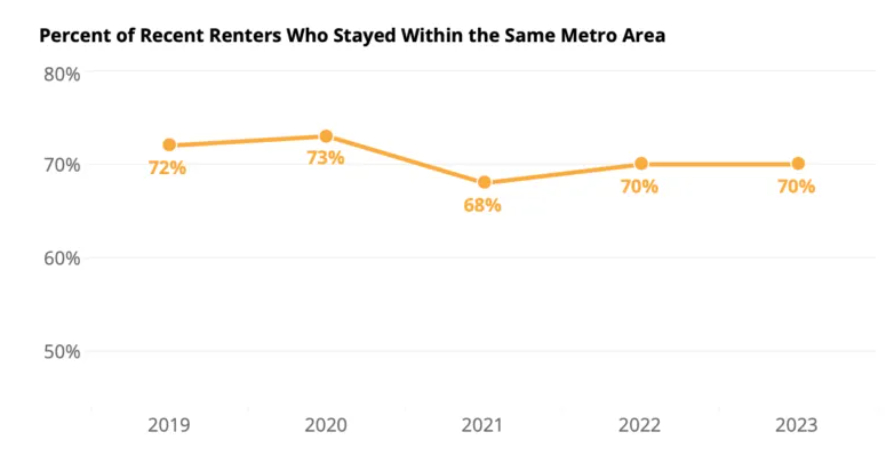
Percent of renters who stayed within the same metro area (Source: Zillow)
Key takeaway: Demand for rental properties is highest in suburban areas, so these are ideal areas for landlords to target. Renters are likely to remain in the same metro area. In addition, landlords and investors should research why renters prefer to live in suburban areas rather than other communities and neighborhoods, whether it’s the population, type of houses, or environment. This will help them create the most effective real estate investing business plan and marketing strategy.
12. 53% of renters live in apartment buildings
According to rental reports from Zillow, 29% of renters lived in a single-family detached house. However, 53% of renters live in apartment buildings—18% for a smaller-size apartment building and 17% for both medium- and larger-size apartment buildings. This study found that the typical renter lives in a two-bedroom, 1.5-bathroom apartment between 1,000 and 1,999 square feet.

Key takeaway: A majority of renters prefer apartment buildings to single-family homes as they are typically closer to transportation, less expensive for utilities, and oftentimes have additional amenities like common areas, a pool, and a gym. These rental property statistics are crucial for investors considering buying a multifamily property. Although a small percentage of renters live in this type of property, landlords could make them more appealing with the right offerings, such as rental rates, deposits, and credit rating requirements.
13. The South has the largest share of renters (36%)
The South has the highest percentage of renters at 36%. The West comes in second at 28%, followed by the Northeast with 19%, and the Midwest with 18%. If you compare these rental trends to the states with the lowest median household income, they are primarily in the South, like Arkansas, Mississippi, and Louisiana. Cost of living in these states also tends to be lower.
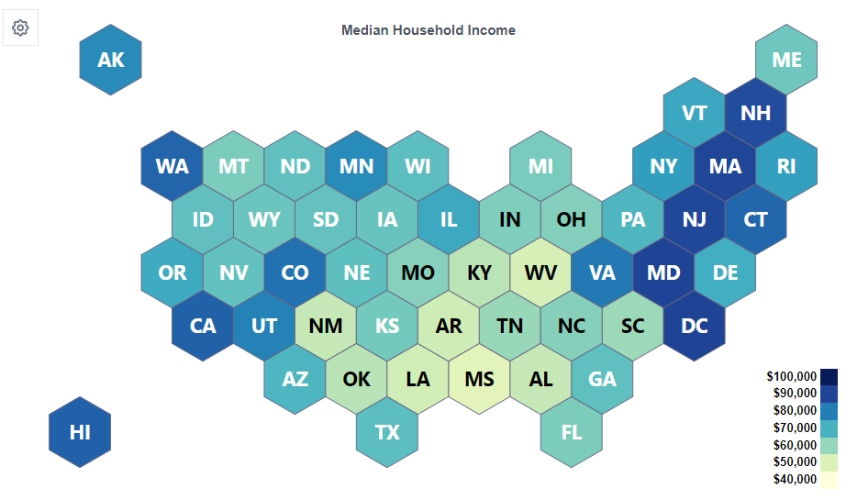
Median household income by state (Source: World Population Review)
Key takeaway: This data reveals that the Southern region is one of the best locations for real estate agents and property owners. Higher rates of renter-occupied homes indicate more demand, more opportunities, and the possibility of higher incomes.
14. San Francisco is the most expensive city for renters
According to a 2023 year-end study by Apartments.com, San Francisco, California, wins out as the country’s most expensive property rental market based on the price per square foot. The average rent per square foot in this metro is $3.98. New York City comes in a close second at about $3.92 a square foot of living space. Although the median rent prices in New York are overall higher than San Francisco, NYC spaces tend to be more spacious.
US Metro Area | Median Asking Rent Price | Price per Square Foot |
|---|---|---|
San Francisco, CA | $3,479 | $3.98 |
New York City, NY | $4,502 | $3.92 |
San Jose, CA | $2,871 | $3.34 |
Boston, MA | $4,003 | $3.12 |
San Diego, CA | $2,667 | $2.86 |
Top 5 most expensive US cities as of February 2023 (Source: Apartments.com) | ||
Key takeaway: For real estate investors researching rental statistics by city, it’s important to understand the average rent prices and demand in different cities nationwide. This information can help you make a financial strategy to increase your return on investment.
15. Oklahoma City, OK, is the least expensive city for renters
Rent in the Midwest and South regions of the US are historically more affordable. Oklahoma City, OK (OKC) comes in as the most affordable city for renters according to the Apartments.com study. The average rent per square foot in OKC is around $1.12 per square foot, with an average rental price of $989 a month.
US Metro Area | Median Asking Rent Price | Price per Square Foot |
|---|---|---|
Oklahoma City, OK | $989 | $1.12 |
Memphis, TN | $1,030 | $1.18 |
Louisville, KY | $1,140 | $1.22 |
Cleveland, OH | $1,498 | $1.33 |
Indianapolis, IN | $1,133 | $1.33 |
Top 5 most expensive US cities as of February 2023 (Source: Apartments.com) | ||
Key takeaway: Although the Midwest and South regions of the United States are the most affordable, investors looking for the highest return on their investments may have a harder time in these areas. Investors should try to find a balance between desirable areas and a sufficient number of units to maximize returns.
16. The largest increase in rent prices is in the Midwest
Redfin’s rental market report showed that the average rent prices in the Midwest and Northeast increased by 5% and 3.1%, respectively. On the other hand, the asking rent prices decreased by 1.6% in the West and 0.3% in the South.
Region | Percentage |
|---|---|
Midwest | +5% |
Northeast | +3.1% |
West | -1.6% |
South | -0.3% |
Asking rents in US regions as of October 2023 (Source: Redfin) | |
Key takeaway: The South and West regions of the US experienced a high volume of new residents during the pandemic, but rental trends show that these markets are stabilizing in 2023. For investors considering all the US markets, the Midwest and Northeast may be better options.
17. Florida has the largest decline in rent at -6.57%
According to Rent.com’s 2024 average rent price report, Florida has seen the most significant decrease in rents year over year (YoY). It is followed by Oregon (-5.48%) and Tennessee (-4.65%), states where rents have steadily declined in the last year.
State | Percentage |
|---|---|
Florida | -6.57% |
Oregon | -5.48% |
Tennessee | -4.65% |
Nevada | -4.24% |
Idaho | -3.79% |
North Carolina | -3.27% |
New Mexico | -2.43% |
Arkansas | -2.11% |
Pennsylvania | -2.03% |
Washington | -1.64% |
States with largest increase or decrease in asking rents, YoY - February 2024 (Source: Rent.com) | |
Key takeaway: The main reasons for rent decreases are increased inventory and lack of demand. For renters looking for an affordable rental property, we recommend exploring the states listed above. However, some areas may be more challenging for the real estate rental business since there is lower demand and higher supply.
18. Rents increased by more than 30% in some US cities
As of May 2023, four US cities have seen a rental rate increase of more than 30%, according to a SmartAsset report. Another eight cities have seen an increase of over 20% in rents, with several increases of over 10%. SmartAsset compared data from the Zillow Observed Rent Index (ZORI) from May 2022 to May 2023.
Where rent has increased most (Source: SmartAsset)
Key takeaway: Rent increases are typically caused by a lack of inventory and rising demand, which motivates property owners to raise their prices to keep up with the increasing demand. For investors looking for a location to maximize their profits, these cities may be the best options.
Real Estate Rental Statistics About Finances
It’s especially important for landlords and investors to understand the financial rental trends because these are crucial for making smart purchases and generating a profit from your investments. I’ve gathered the most critical rental stats data, like the median rent prices and vacancy rent indexes.
19. The vacancy index is trending up, sits at 6.6%
Based on the Apartment List national rent report, the national vacancy index reached 6.6% in March 2024. This is a significant increase from 2021, when the market saw a significant reduction in available inventory. We expect to see new apartment construction completed at the highest rates in decades.
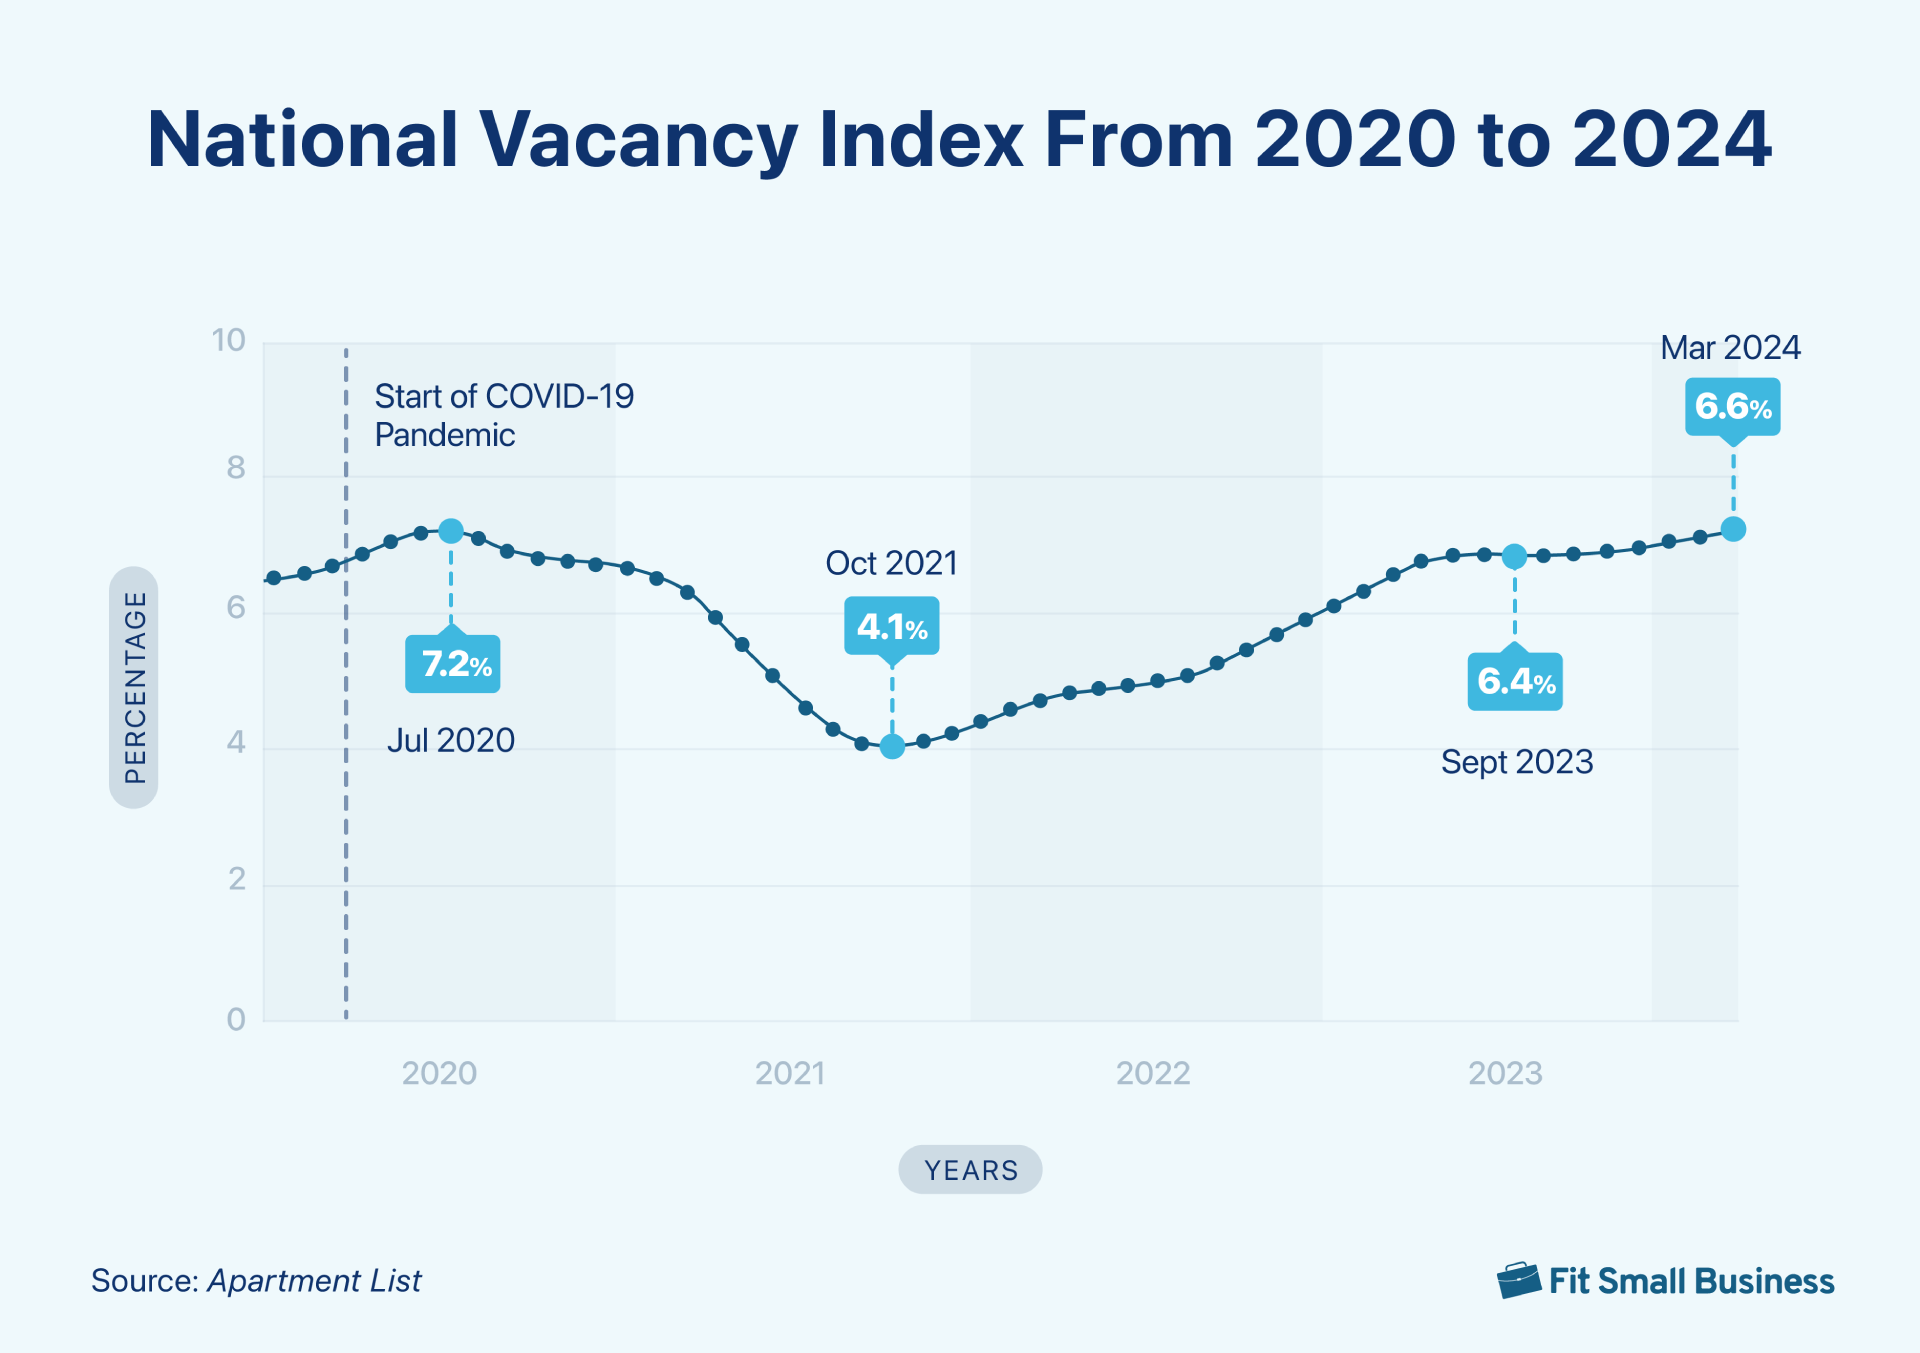
Key takeaway: After experiencing pandemic-related delays in recent years, new apartment development has resumed. There are now higher numbers of vacant rental units, which may lead to property owners fighting to find tenants to fill their units. This is the direct opposite of the last few years when renters competed for limited available inventory.
20. The median price of rent in the US is about $1,981
According to Rent.com, the average rental price in the US is about $1,981 per month. This is a 2.25% increase from the previous year. Gains are slowing as vacancy rates continue to climb and inflation soars. This is similar to the ZORI, which measured the typical rent in the US at $1,959.
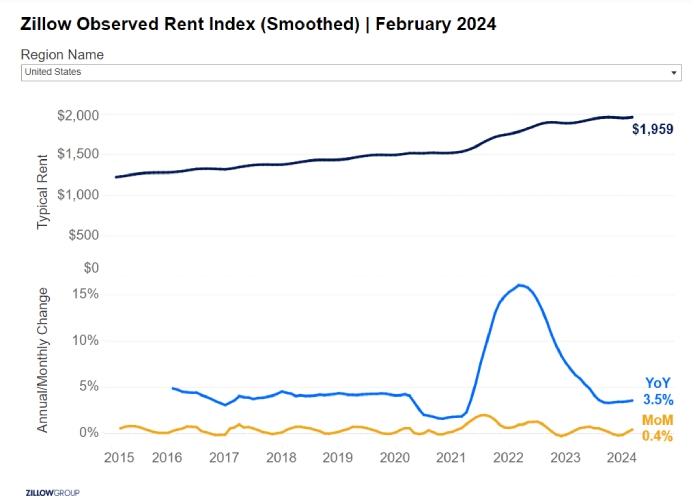
Zillow Observed Rent Index (Source: Zillow)
Key takeaway: It’s important for landlords to know the property rental index when calculating how much to charge for rent. People are less likely to move due to consistently high housing costs, inflation, and recession fears, leading to a decreased demand for new leases. Understanding how rent prices and demand increase or decrease can help you set rates to generate the maximum profit and attract good-quality tenants.
21. $1,343 is the average monthly rent in the US (varies by apartment size)
Calculating the average cost of rent is difficult because prices vary drastically by location, property type, and size. However, the average rent price for a one-bedroom apartment was $1,499 as of March 2024. For a two-bedroom apartment, the average monthly rent was $1,743 and for a three-bedroom apartment, it was $2,148.
Apartment Type | Average Rent (per Month) | Average Square Feet |
|---|---|---|
Studio | $1,515 | 469 |
One-bedroom | $1,499 | 699 |
Two-bedroom | $1,743 | 998 |
Three-bedroom | $2,148 | 1,285 |
Current national average of monthly rents (Source: apartments.com) | ||
Key takeaway: According to this US rental market trends data, rent prices are stabilizing but not decreasing. Investors should keep this information in mind as they determine what type of investment properties to purchase.
Bottom Line
While the rental market was highly competitive and vacancy rates were low for the last few years, some changes are coming in 2024. Rent growth is slowing down nationally, with rent prices decreasing and stabilizing in many areas. While this is good for renters, landlords and property owners must be aware of these rental patterns and keep an eye on them in the future to make effective and strategic moves.