







The point-of-sale (POS) system is a business command center for retail merchants worldwide. Modern POS technology allows retailers to do much more than simply process payments and transactions. Some of the benefits of a POS include the ability to track inventory, monitor data in real time, build customer loyalty, sell online, and even operate in person when you’re offline.
Let’s take a look at some point-of-sale statistics that can help you understand the trends and drive the growth of your business.
Current State of the POS Market
1. The global POS software market was worth $13.74 billion in 2023
Precedence Research expects healthy growth for the global POS software market for the next several years, with a compound annual growth rate (CAGR) of 9.02% from 2023 To 2032. The global market value of the industry was at $13.74 billion in 2023, with projections to reach nearly $30 billion by 2032.
2. The global market size for POS terminals is just over $100 billion
Looking at the hardware side of the POS market, Mordor Intelligence predicts equally strong growth. It anticipates the global POS terminals market will grow from just over $100 billion in 2024 to $151.97 billion by 2029, with a CAGR of 8.68%.
3. More than 70% of POS software and hardware are 2+ years old
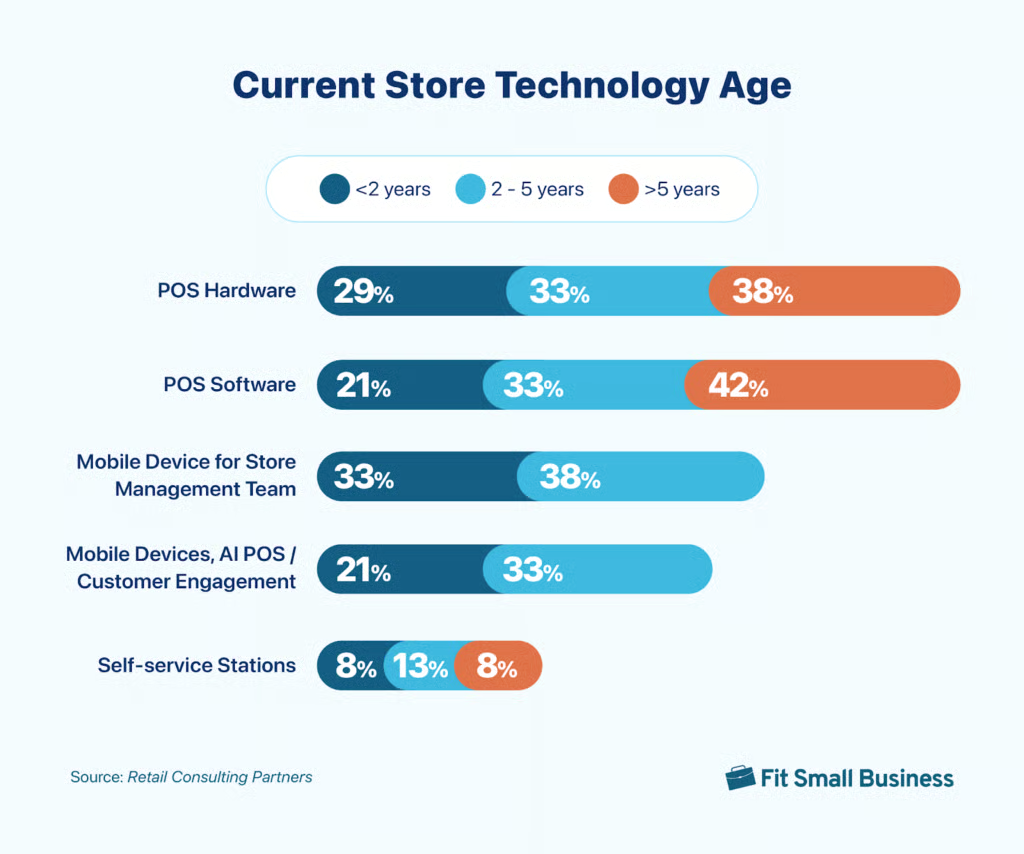
Only 21% of retailers are using POS software they’ve adopted within the past two years. That number for POS hardware is slightly higher at 29%. More than 40% of POS software and nearly the same percentage of POS hardware are over five years old.
4. Square controls nearly 30% of the POS market
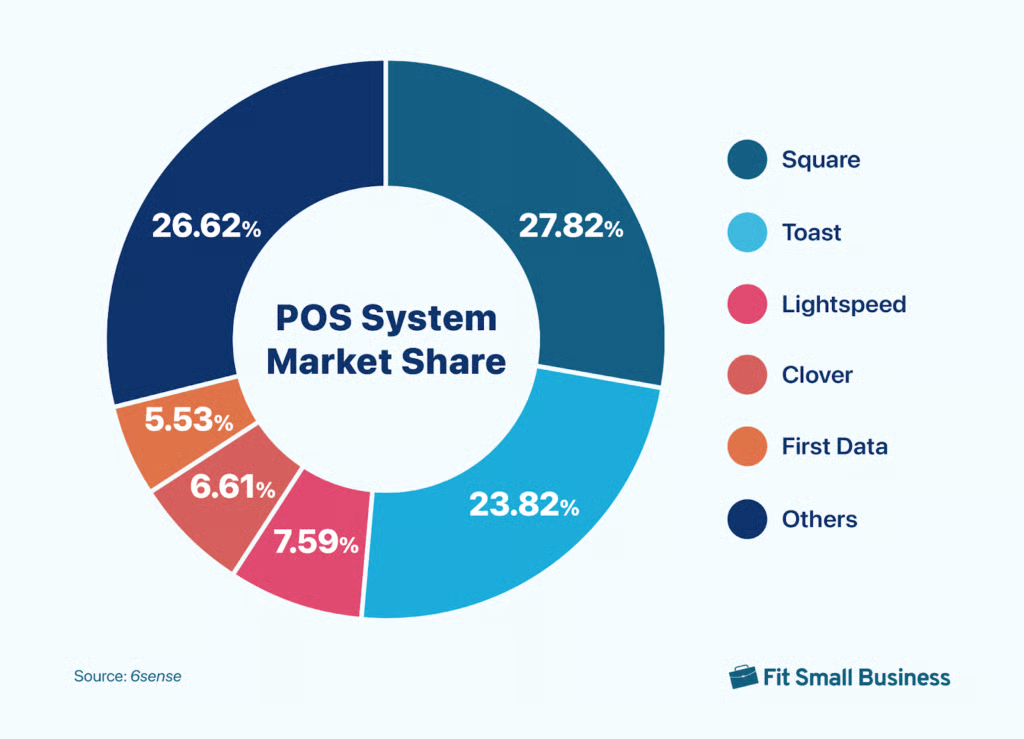
According to 6sense, an account-based marketing firm, Square claims over 27% of the POS systems market. Toast is not too far behind, with nearly 24%. Lightspeed, First Data (now Fiserv), and Clover round out the top five.
Mobile Point-of-Sale Statistics
5. The mPOS terminal market is expected to reach a value of $41.25 billion in 2024
With a value of $34.72 billion in 2023, the global mobile POS (mPOS) terminals market is poised for growth. Its value is expected to hit over $41 billion in 2024.
6. mPOS transaction value is projected to hit $3.78 trillion in 2024
Statista forecasts that the total transaction value for mPOS payments will reach $3.78 trillion globally in 2024. This is estimated to grow at a 12.76% CAGR, reaching $6.11 trillion by 2028. The number of people who use mPOS payments worldwide is also expected to grow, hitting over 2 billion users by 2028.
7. Average mobile transaction value is expected to reach over $10,000 in 2024
In 2024, the average mobile transaction value in the US is anticipated to hit nearly $11,000. By 2028, the total number of mobile payments users is expected to exceed 101 million.
8. The most used mobile payment brand by the end of 2023 was Apple Pay
As of December 2023, Apple Pay was the most commonly-used mobile payment brand in the US, with 60% of respondents using it in restaurants and retail shops. CashApp was the next most popular brand at 59%, followed by PayPal at 58%.
Retail POS Statistics
9. The global retail POS market is projected to grow to $34.4 billion by 2026
Globally, the retail POS market is expected to grow at a rate of 13.9%, from $15.8 billion in 2020 to $34.4 billion by 2026. North America is projected to hold the largest share of the global retail POS market, while grocery stores are forecast to be the segment with the highest adoption rate in the coming years.
10. Omnichannel integration and a robust order management system (OMS) are the top POS priorities for retailers
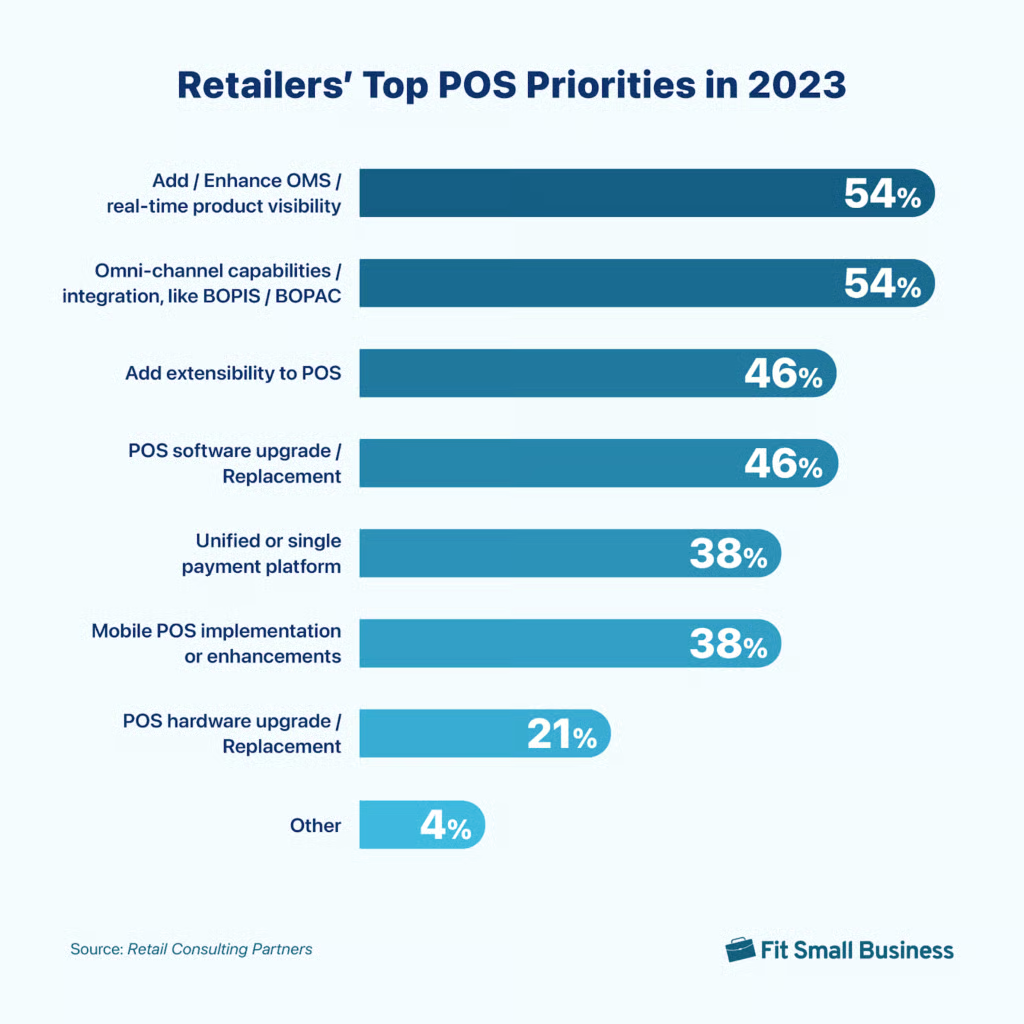
Omnichannel retailing continues to be a priority for respondents to a 2023 survey from Retail Consulting Partners. The top concerns were improving omnichannel integrations (54%)—like buy online, pick up in-store (BOPIS) and buy online, pick up at curbside (BOPAC)—and robust order orchestration capabilities (54%, up from 36% in 2022) to reduce the complexity of orders sourcing and routing from multiple channels.
Other priorities include software upgrades or replacement (46%), adding extensibility to their POS system (46%) and moving to a unified payment platform (38%).
11. POS data is the most valuable data source for retailers
According to The Motley Fool, data from POS transactions make up 51% of retailers’ most valuable data. This data can include average transaction value, sales per category, and sales per employee.
Restaurant POS Statistics
12. The restaurant POS terminals market was valued at $22.26 billion in 2023
The global market for restaurant POS terminals reached $22.26 billion in 2023, as restaurants continued to discover their ease of use, range of features, and time savings. This market has a CAGR of 8% from 2023 to 2030. The self-service kiosk subsegment of the market is projected to grow the fastest, with a CAGR of 9.5%.
13. Restaurants spend an average of just over $9,000 on upfront POS costs
RestaurantOwner.com found that purchasing a POS system costs restaurants an average of $9,300 upfront. This is down from more than $13,000 in 2017. However, monthly costs have risen since 2017, from about $140 to some $380 in 2022.
14. Researching a new POS for implementation after 2023 is a priority for 43% of restaurants
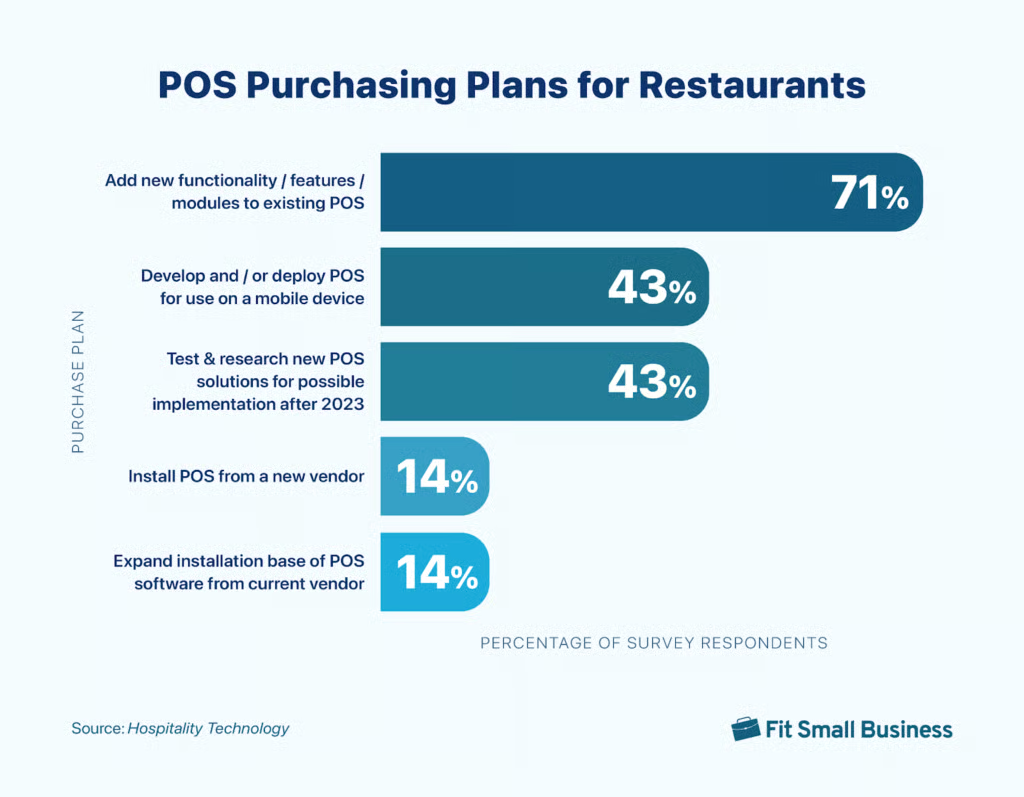
Almost half of restaurant operators plan to research and test new POS systems for possible implementation in 2024 and beyond. That’s on top of 43% that planned to prioritize identifying and purchasing a good mPOS to use in 2023. Many of these businesses seek platforms with more advanced and flexible features, including mobility.
15. Nearly 90% of restaurants use POS data to support various business offerings
Eighty-six percent of restaurants surveyed use point-of-sale data to make decisions on their discounting, loyalty programs, and marketing campaigns. POS data also supports menu optimization and digital engagement for restaurants.
16. Forty-six percent of restaurants want to upgrade their POS for better omnichannel experiences for customers
Nearly half of restaurateurs see a POS upgrade as the preferred way to deliver better omnichannel service to their customers. POS upgrades can also support better data gathering, more payment options, and self-service features.
17. More than 60% of restaurants use one or more handheld POS terminals
The use of handheld POS terminals by restaurants is growing. Sixty-one percent of those surveyed by RestaurantOwner.com in 2022 used them, compared to just under 30% in 2017.
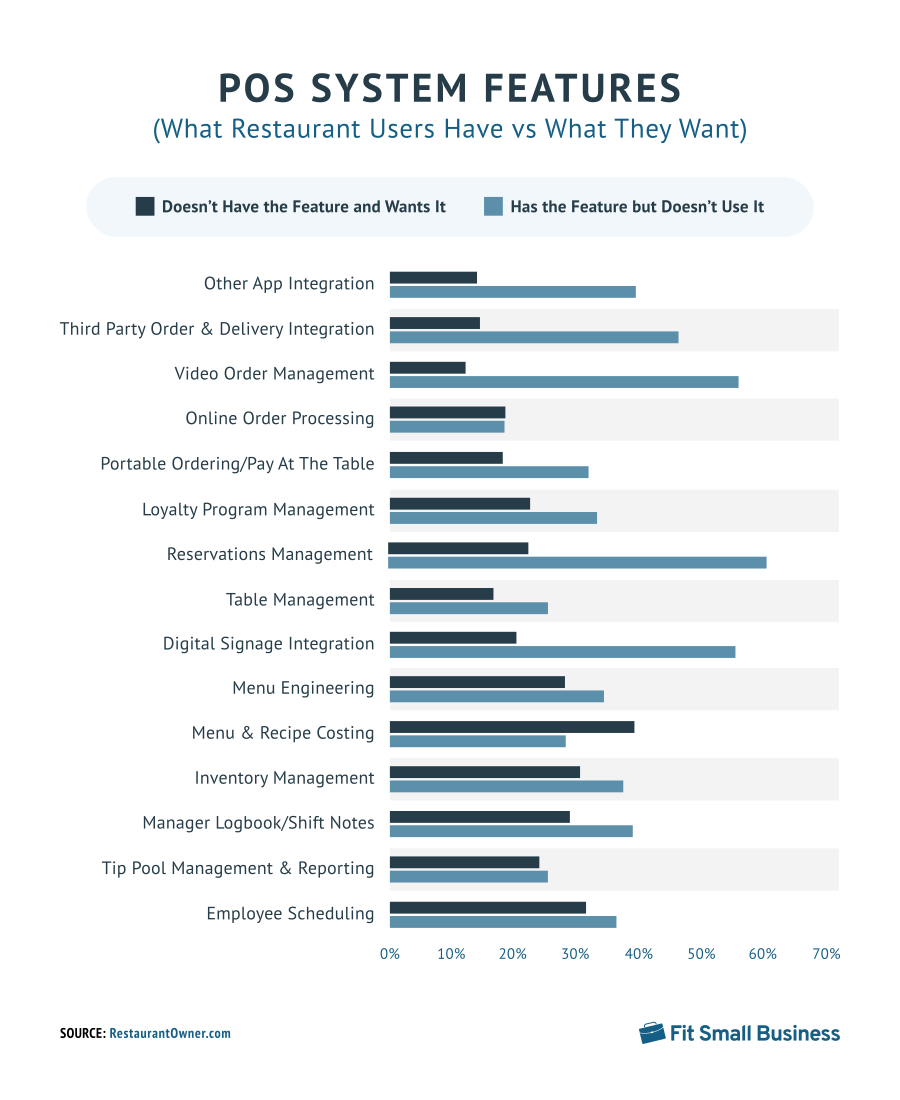
18. Menu and recipe costing is the top feature independent restaurant owners wish their POS had
Some 40% of restaurant owners in 2022 cited menu and recipe costing as the feature they want but their POS doesn’t have. That is followed by employee scheduling, inventory management, and menu engineering. On the flip side, reservations management, video order management, and digital signage integration are the features that are available in POS systems but the least used.
Cloud POS Statistics
19. The global cloud POS market is expected to surpass $30 billion by 2031
Cloud POS is growing at a much faster rate than the overall POS market, according to Straits Research. The research firm estimates a CAGR of nearly 25% for the global cloud POS market, from a value of $3.9 billion in 2022 to over $30 billion by 2031.
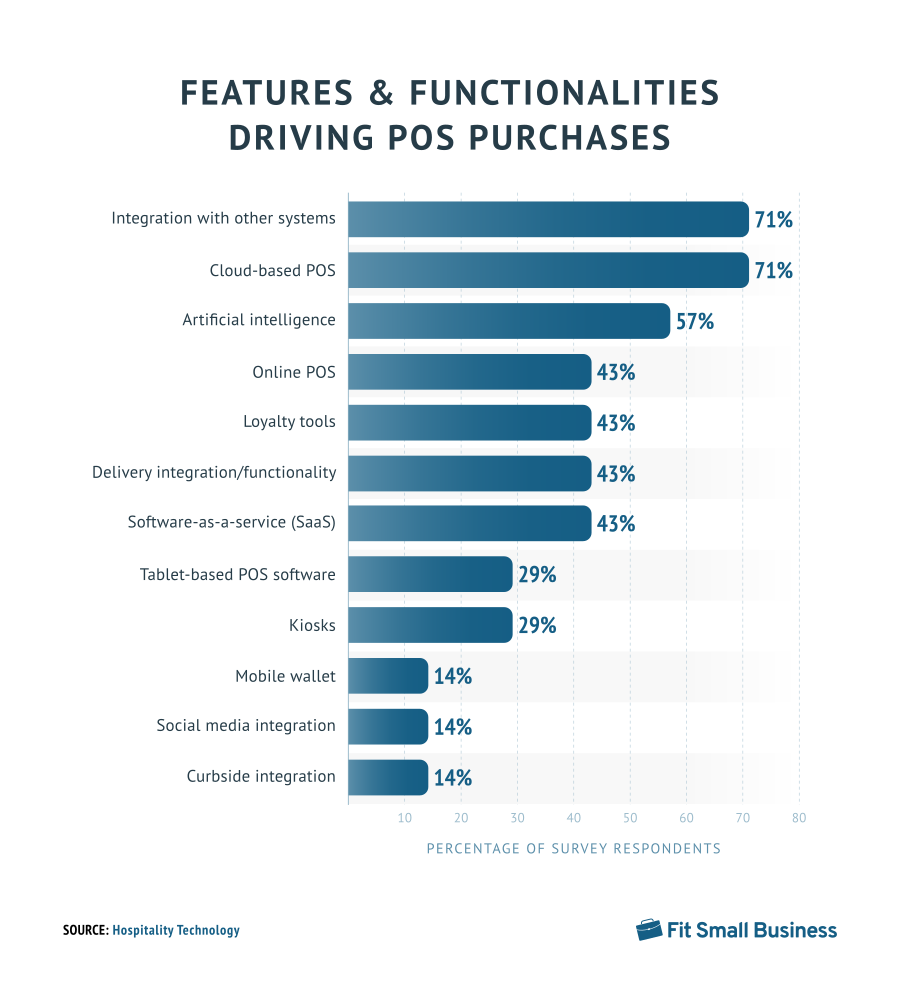
20. Cloud-based operations is one of the top three functionalities restaurants are seeking in their POS
Seventy-one percent of Hospitality Tech survey respondents selected integration and cloud-based functionality as their top priorities for their POS purchases. This was followed by artificial intelligence (AI), followed by online functionality, loyalty tools, delivery integration, and software-as-a-service (SaaS).
21. Cloud-based deployment is the fastest-growing deployment method for restaurant POS systems
On-premise deployment is by far the leading deployment method for restaurant POS systems (75% of revenue in 2022), according to Grand View Research. However, cloud-based deployment is the fastest-growing method, with a CAGR of 9.2% through 2030.
Bottom Line
A POS system is more than just a way to collect payments and process transactions. Modern POS systems act as a central command center, connecting all the different parts and pieces that make your retail business run smoothly. POS system statistics show that more restaurants and retailers are adopting the tool, with mobile and cloud POS technologies growing particularly quickly.
