

Retail data analytics describes the measurement, tracking, and interpretation of data—typically sales, inventory, employee, and consumer demand information—that allows retailers to discover trends and predict outcomes. Business owners can use dozens of retail metrics to evaluate performance, monitor progress, and—most importantly—drive sales.
Certain metrics are quantitative and are considered KPIs (key performance indicators) for their direct insight into productivity and revenue. Other analytics might be qualitative and tell you what’s driving that performance. Most successful retailers use a combination of both.
The retail metrics you choose to track depend on your unique operation and offerings, but we’ve defined 14 of the most helpful ones below.
- 1. Average Transaction Value
- 2. Items Per Purchase
- 3. Market Basket Analysis
- 4. Conversion Rate
- 5. Foot Traffic
- 6. Shopping Cart Abandonment Rate
- 7. Sell-through Rate
- 8. Sales Per Category
- 9. Gross Margin
- 10. Customer Retention Rate
- 11. Sales Per Square Foot
- 12. Sales Per Employee
- 13. Shrink Rate
- 14. Inventory Carrying Cost
- How to Collect & Use Retail Data Analysis
- Retail Metrics Frequently Asked Questions (FAQs)
- Bottom Line
1. Average Transaction Value
Average transaction value (ATV) is the typical amount a customer spends when they shop with you. This is an accessible metric for both brick-and-mortar and online stores because most point-of-sale (POS) systems can provide ATV on a daily, weekly, monthly, or annual basis. Measuring larger time frames provides a more accurate ATV meaning in retail, but monitoring daily ATV can help coach and encourage employees more directly.
To calculate your ATV, divide the total value of all transactions by the number of transactions.
Total amount of sales / total number of sales = average transaction value (ATV)
For example, if your monthly sales total $50,000 and you had 500 sales, your average sale is $100.
$50,000 / 500 = $100
- Building customer promotions: Using a gift with purchase promotion or discount with a certain dollar spend encourages customers to spend more to qualify for the promotion. Plus, this strategy is easy to employ even if you’ve moved your sales online.
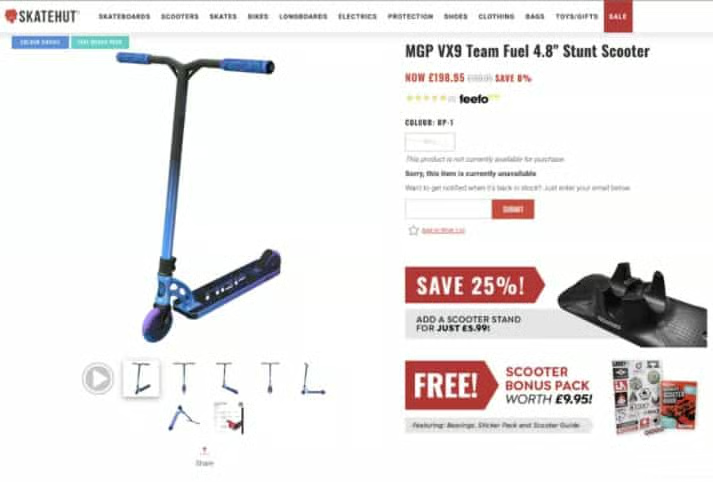
- Upselling: Upselling is the process of educating customers on the features and benefits of purchasing a higher-end model of a product they’re interested in—and encouraging them to buy the pricier model. This can be accomplished online by recommending relevant upgrades or including a comparison table on individual product pages.
- Identifying top-performing employees: Brick-and-mortar businesses can measure employee-specific ATV to identify employees with the highest average transactions and employees who need additional sales training.
- Setting specific ATV goals: Set a specific ATV that you would like employees to meet each shift or each week, and consider offering a bonus for employees who meet their goals.
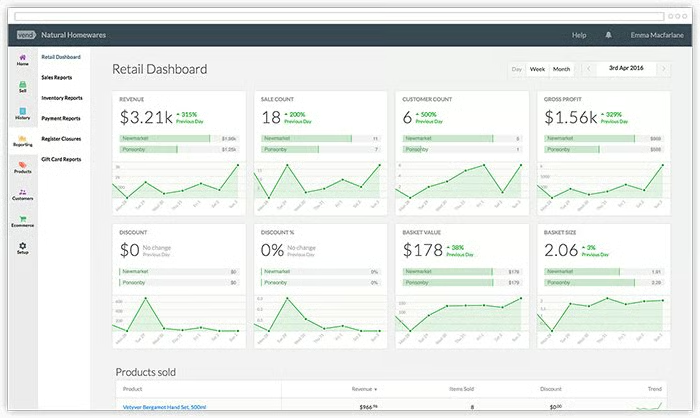
Vend POS shows the average transaction value or “basket value” on the retailer dashboard.
2. Items Per Purchase
Items per purchase, also sometimes called units per transaction (UPT), measures the average number of products sold during a customer transaction in a specific time period. While UPT in retail is a similar concept to ATV, you’re measuring how many products customers buy on average rather than how much customers spend on average.
Items per purchase can be calculated by dividing the total number of products sold by the total number of customer transactions for a specific time period.
Total number of products sold / total number of transactions = items per purchase
For example, if you’ve sold 100 items in 50 sales, your average items per purchase is 2.
100 items / 50 sales = average of 2 items per purchase
Like with ATV, you can use any length of time when measuring items per purchase. Monthly or seasonal data on items per purchase can provide a big-picture benchmark for how much people are buying. Alternatively, daily or weekly UPT measurements can track employee performance.
The most common way to increase items per purchase is via cross-selling, impulse sales, and add-on sales techniques. Cross-selling and add-on sales encourage customers to purchase additional related items. Impulse sales encourage customers to make unplanned purchases.
Increase UPT and drive sales by:
- Strategically merchandising: Ever notice how during the summer, grocery stores will place marshmallows and graham crackers next to the chocolate? Retailers place lower demand items next to products with a higher draw to encourage extra sales. Recreate this online with automated product recommendations based on individual products—or even consumer data.
- Training sales staff: Let employees know your current items per transaction, what you’d like it to be, and how they can help you get there. Educate them on all product offerings to help them make helpful recommendations to customers.
- Merchandising your checkout: Place tempting items like treats, travel-sized products, or inexpensive necessities at checkout so customers can pick up extra items while waiting in line. Though checkout looks different online, some retailers accomplish this by including suggested items on the cart screen or using popups at checkout—both of which can be tailored to customer interests.
- Offering seasonal products: Seasonal products can mean anything from sunglasses in the summer to peppermint-flavored items around Christmas. Think about products that customers need or want during a specific time of the year and put them front and center—whether that’s on an eye-catching display or on your store’s homepage.
3. Market Basket Analysis
Market basket analysis (MBA) is a type of statistical affinity analysis that lets business owners determine the strength of association between certain products that customers purchase together.
Using data collected through a POS system or other ecommerce tool, this retail metric helps sellers better predict the purchasing habits of customers—and ultimately drive sales.
Like measuring items per purchase, brands can use sales data to create likely conditions—or if-then statements—that let them anticipate which products a customer will buy based on what they already own or are planning to purchase. They can then use that information to recommend those products and increase sales.
To accomplish this, retailers use their existing POS system to collect sales data and then apply the Apriori algorithm, which can be used as part of the rules package in R.
This takes a bit of time and skill to do, but can be affordably outsourced to a professional data analyst through sites like Fiverr and Upwork. As this is a complex metric, you may want to start by reviewing your sales data manually and making note of any patterns that stand out to you if you’re a smaller retailer.
For example, if you have an electronics store, you may find that customers who buy a new cellphone are more likely to also buy a screen protector and phone charger.
Once you identify market basket relationships, the insight can be applied in both brick-and-mortar and online stores—similar to how you use UPT data. Increase your sales by:
- Cross-selling: If you can anticipate what customers are likely to reach for next, you can make it easier by placing those items close together in your store using cross merchandising strategies. In an online setting, create popups that appear when customers add certain items to their cart, include a “Discover Additional Products” feature like Amazon’s, or simply add likely pairings to product descriptions.
- Recommending related products: Likewise, better understanding what customers are likely to put in their carts makes it easier to choose recommended products to place on individual product pages. If you have a brick-and-mortar store, this is also excellent insight to provide employees who can then make tailored recommendations to shoppers.
- Tailoring marketing promotions: Beyond your website or storefront, MBA data can help you craft more effective marketing campaigns. By knowing what customers want before they do, you can increase sales by creating specific, targeted ads that make it convenient for consumers to get everything they need in one place.
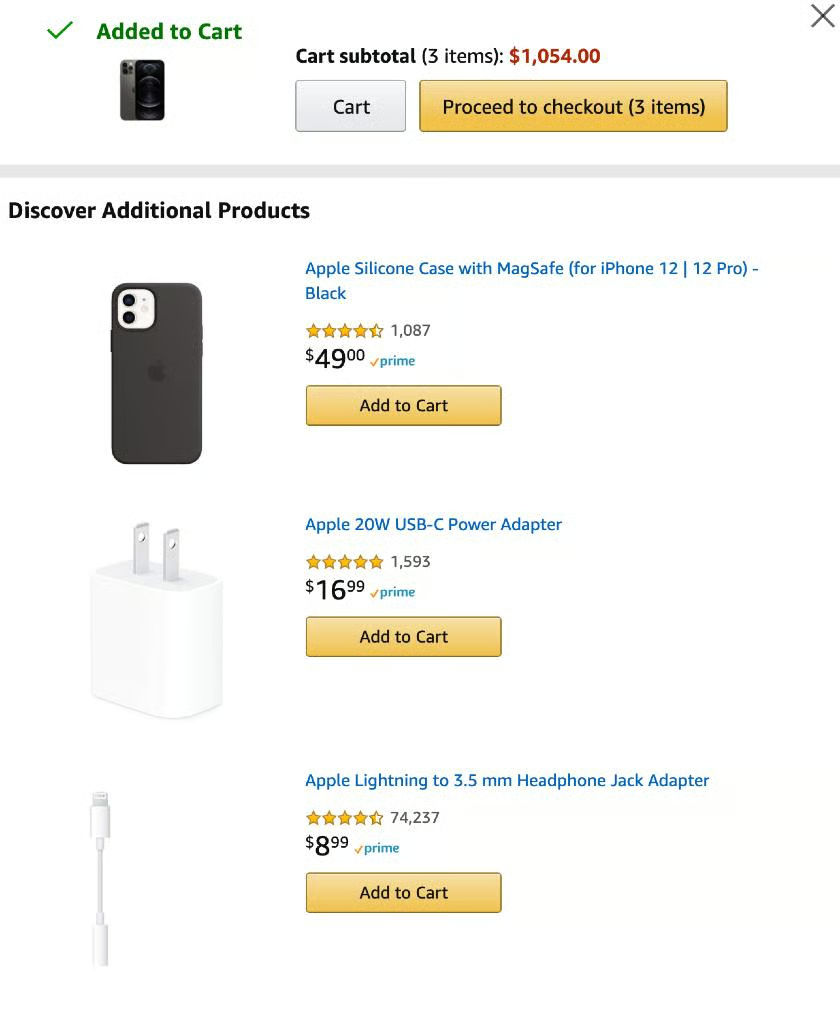
Amazon’s “Discover Additional Products” feature uses MBA data to recommend products that shoppers are statistically likely to buy.
4. Conversion Rate
Retail conversion rate compares the number of people who enter your store or visit your website with the number of people who make a purchase.
According to frequently reported figures, average brick-and-mortar conversion rates range from 20% to 40%—so 60% to 80% of people who walk into your store leave without buying anything. For ecommerce sites, the numbers are even more staggering, with conversion rates typically between just 2% and 5%.
Calculate your conversion rate by taking the total number of people who made a purchase and dividing it by the total number of visitors you have to your store or website. Conversion rate is presented as a percentage, so multiply by 100.
(Number of visitors who made a purchase / total number of visitors) x 100 = conversion rate
For example, if 100 people walked into your store and 25 made a purchase, your conversion rate would be 25%.
(25 paying customers / 100 total visitors) x 100 = 25%
Conversion rate is more commonly used by online businesses because it’s easy to track how many people visit or view your site in any given time period.
Once it’s collected, use conversion rate data to increase sales by:
- Placing products on your ecommerce homepage: If your ecommerce site has lots of visitors who leave right away, it could be because the product they wanted was too hard to find. Make sure your promotions and advertisements bring shoppers directly to that product page and not your site’s homepage.
- Testing different product pricing: If many people are showing interest in your products but not purchasing, try testing different pricing promotions or slightly lowering prices to see if that increases conversions. This is even easier in an online setting because you won’t have to create new signage or price tags.
- Adding employees during times of low conversion rates: If your brick-and-mortar business has high foot traffic but low conversions, it may be a sign that customers aren’t getting the help or attention they need. Adding employees can increase sales and conversions. For online businesses, a chatbot can answer questions and help your customers find what they need faster.
5. Foot Traffic
Counting foot traffic tells you how many people enter your store, what time they enter, and how much time they spend there. It can also tell you how and where they move around your space, pointing out key friction and dwell points.
You can calculate this retail metric with foot traffic technology that connects to your POS and other systems. Some software can also track movement throughout the store and identify important conversion and engagement locations.
- Determine your retail store hours: Make sure you’re open when you have lots of foot traffic. Consider closing during slow periods, or looking for ways to boost foot traffic when it trends down.
- Staff accordingly: Likewise, you can ensure you effectively manage your store by having enough staff on the schedule when you have lots of shoppers visiting your space. Consider putting your top-performing employees on the schedule during peak shifts.
6. Shopping Cart Abandonment Rate
Cart abandonment rate is the percentage of online shoppers who place items in their shopping cart but leave the site before purchasing—and it averages between 55% and 85%. It’s a vital ecommerce KPI, but doesn’t easily translate to brick-and-mortar applications.
To calculate your store’s shopping cart abandon rate, divide the number of completed transactions by the total number of shopping carts that have at least one item in them. Cart abandon rate is typically expressed as a percentage, so then multiply by 100. This number will give you the percent of completed transactions. Subtract this number to get the percent of abandoned transactions.
(Completed transactions / total shopping carts) x 100 = % completed transactions
100% – % completed transactions = cart abandon rate
For example, if in one month you have 50 completed transactions, but 200 total shopping carts created, your completed transaction rate is 25%. So, your cart abandon rate is 75%.
(50 completed transactions / 200 total shopping carts) x 100 = 25% completion rate
100% of total carts – 25% completion rate = 75% cart abandon rate
Targeting a potential shopper based on their abandoned cart is extremely effective for increasing sales because you’re reaching out to someone who has already expressed interest in a product. Use cart abandonment data to increase sales with:
- Automated follow-up emails: After a shopper abandons their cart, follow up with personalized emails reminding them of what is in their cart. Studies show that 45% of cart abandonment emails are opened, and 21% successfully lead shoppers back to the store.
- Discounts or promotions: Consider sending a 15% or 20% coupon to be used on the items in the shopper’s abandoned cart.
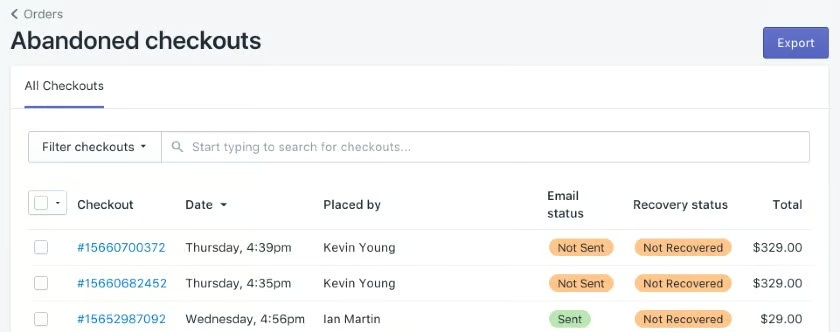
Shopify has built-in tools to monitor and recover abandoned shopping carts.
In addition to targeting shoppers who already abandoned their carts, you can reduce your overall cart abandon rate by encouraging shoppers to purchase right away.
Ecommerce sellers can drive sales and reduce shopping cart abandonment by:
- Showing the total cost of order: Shoppers are often surprised by the total cost of their order after shipping, taxes, and other fees are calculated. Prevent this by showing the estimated total with these fees included before shoppers even hit the checkout button.
- Reducing shipping costs: Oftentimes, shipping costs prevent shoppers from placing an order. Combat this by offering free shipping with a minimum purchase; this prevents shipping rates from eating into your margins and encourages customers to complete larger purchases.
- Streamlining checkout: Shoppers abandon carts when there are too many steps to take—or too much information to type—during checkout. Make it easier for customers to complete a sale by offering guest checkout and easy payment options like Apple Pay and PayPal.
- Having an agreeable return policy: Some shoppers abandon their cart if they are not sure what the return policy is or if they’re worried they won’t be able to return the item at all. By clearly posting a consumer-friendly return policy, you’ll set these shoppers at ease. Learn more about managing retail returns.
7. Sell-through Rate
Sell-through rate (STR) is the percentage of an individual product sold during a certain timeframe. It looks at how many of a particular item you started with and how many are left at the end. To calculate sell-through rate, divide the number of products sold by the beginning inventory on-hand.
(Products sold / starting number of products) x 100 = sell-through rate
For example, if you bought 100 copies of a specific book to sell in your store and after one month 40 of those books had sold, your sell-through rate would be 40%.
(40 books / 100 books) x 100 = 40% book sell-through rate
Retailers can use STR data to determine the popularity of certain products or the success of a new product launch. This enables online, brick-and-mortar, and multichannel businesses to increase sales by:
- Knowing when to purchase products: By knowing how quickly products are selling, you can tell which to purchase more frequently. You can do more accurate demand forecasting—and you won’t miss out on sales by running out of inventory. If your store is exclusively online, this strategy can also help you avoid the cost of storing excess products when they’re less likely to sell.
- Determining safety stock levels: Safety stock serves as a buffer for when you experience unexpected peaks in demand or challenges with suppliers. Your average sell-through rate can factor into the ideal safety stock level.
- Showcasing bestselling products: Visual merchandising strategies, like prominently displaying products with the fastest sell-through rates and labeling them as “bestsellers,” increase sales by encouraging more shoppers to purchase the product. For online retailers, this can be accomplished by highlighting products on your store’s homepage—or as recommended items at the bottom of relevant product pages.
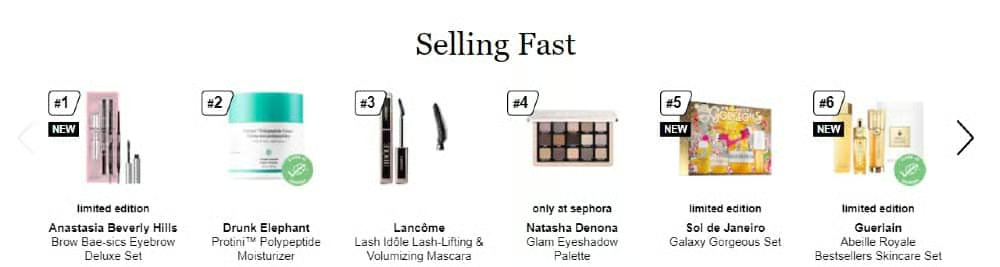
Sephora features a “Selling Fast” carousel on the homepage of its site.
- Discounting slow-moving merchandise: Decreasing the price of products with slower sell-through rates can increase sales of those products. This approach is even easier if you have an ecommerce business—simply adjust pricing online and gauge customer response.
- Eliminating worst-selling products: Phase out slow-moving products and increase sales by making room for new merchandise or bestselling items. This is also a smart strategy if you’re short on space for storing inventory.
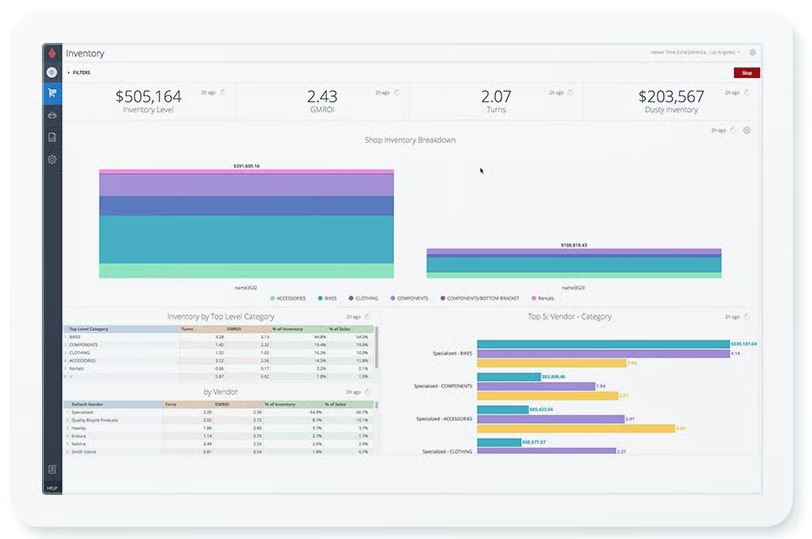
Lightspeed has reports to automatically calculate inventory turnover by product and category.
8. Sales Per Category
Sales per category—or sales per department—examines the total sales a retailer has for each type of product. This information is useful because it shows which types of products are bringing in the most money. With deeper insight, it can also be used to determine the most popular and profitable product categories so you can drive additional retail sales.
Luckily, sales per category is one retail metric that requires very little calculation. It simply involves tracking product sales and totaling those numbers based on whatever categories you’ve assigned. Most POS systems allow you to run sales by category reports automatically.
If you’re not using a POS system, the ability to track sales per category comes down to the tools you use to organize your inventory. For example, if you’re using a separate inventory management software, you could track estimated category sales with inventory counts. Some retailers even track category sales with spreadsheets they update at the end of each day, although this can be quite labor-intensive.
Sales-per-category data allows you to make informed decisions on which products to feature in your store, which products to restock, and which ones are not selling. Accomplish this by:
- Focusing on what’s working: If one or a few categories are consistently outselling others, feature those items more prominently in displays and on your website. If you have the space in your stockroom or warehouse, consider expanding product lines in those categories.
- Investing in profitable merchandise: When it comes time to restock products or introduce new merchandise, buy more products in the categories that are selling well. This is especially helpful if you have an online shop and can’t store inventory for long periods of time.
- Phasing out slow categories: If there are categories that are selling significantly less than others, consider making them a smaller part of your store—especially if those current products take up a large footprint in your storefront or storage area.
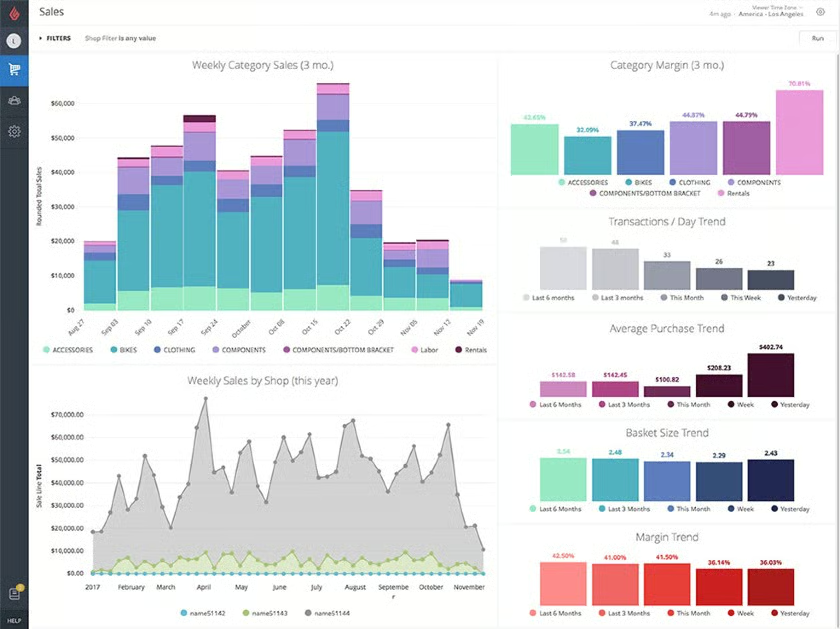
Lightspeed analyzes sales by category and creates color-coded visuals with the sales data.
9. Gross Margin
Gross margin (or gross profit margin) is an important retail KPI for driving sales because it shows what percentage of your store or product revenue is actually profit—versus what just covers the cost of merchandise.
Products with higher profit margins can be more profitable than items that have higher total sales, but a lower profit margin.
Gross margin is calculated by subtracting the cost of goods sold (COGS) from selling price, dividing by selling price, and then multiplying by 100 to get a percentage.
(Selling price – cost of goods sold) / selling price x 100 = gross margin percentage
For example, let’s say you have a sweater that you sell for $50 and it costs you $15 to purchase that sweater wholesale. Your gross margin would be 70%, which is pretty good. Margins can vary by industry (grocers and food sellers typically have lower margins), but generally retailers should aim for at least 50% margins.
(($50 – $15) / $50) x 100 = 70%
($35 / $50) x 100 = 70%
Gross margin can be calculated for an entire store, per item, or per product category. Once determined, retailers can use gross margin to increase sales by:
- Increasing prices on low-margin products: If some of your margins are very low (below 40%), try increasing prices slightly. Ecommerce makes it extremely easy to experiment with pricing because you don’t have to constantly change physical price tags or signage.
- Stocking more high-margin products: Because you make a higher percentage of profit from each sale, high-margin products bring in more profit even if sales are slower than that of low-margin products. Depending on your warehouse situation, this may be difficult for ecommerce businesses—especially if you recently moved online.
- Promoting high-margin products: Change your store display to feature high-margin products in the front or at checkout. Likewise, an online business can feature high-margin products on its homepage or in email promotions.
10. Customer Retention Rate
Customer retention rate (CRR) refers to a retailer’s ability to hold on to current customers and keep them coming back. A high customer retention rate typically indicates strong customer loyalty and satisfaction with the retailer’s products or services.
This metric is important for sales because it focuses on long-term revenue and growth potential. If a business consistently brings in new customers, but they only shop once, your sales will remain steady but won’t grow in a significant way. Alternatively, if a store brings in new customers who keep returning, that business will experience significant growth.
To calculate CRR, divide the total of repeat customers by the number of total customers. Retention rate is typically expressed as a percentage, so then multiply that by 100.
(Repeat customers / total customers) x 100 = customer retention rate %
For example, if you have 500 total customers one month, and 200 of those are repeat customers, your retention rate is 40%.
(200 repeat customers / 500 total customers) x 100 = 40% customer retention
Customer retention leads to higher sales in less concrete ways, including:
- More referrals: Loyal or regular customers are more likely to spread positive feedback about your business and recommend your business to friends or family. This is especially powerful for ecommerce businesses that aren’t limited by customer location.
- Decreased cost of customer acquisition: A commonly cited statistic says it costs up to 25% more to acquire new customers than to retain current ones. If you’re relying on Facebook Ads or other online marketing to drive traffic to your website, this is an especially important statistic.
- Higher spending: Customers who return to your store again and again typically have a higher average transaction value than first-time customers.
11. Sales Per Square Foot
Sales per square foot is the average revenue your store brings in for every foot of sales space. It provides perspective on how efficient you are with use of sales space, and helps you make smart merchandising, inventory, and sales decisions.
Retail sales per square foot data serves as a retail KPI for your brick-and-mortar store—but it doesn’t apply well to ecommerce operations.
If you want to know how to calculate sales per square foot, take your total sales and divide it by the number of square feet in your selling area. The selling area consists of the sales floor, merchandise displays, and register area—just don’t count your office or stockroom.
Total sales / square feet of selling space = sales per square foot
For example, if you’ve sold $500,000 worth of merchandise in a year and the total area of your sales floor is 2,000 square feet, your sales per square foot is $250.
$500,000 / 2,000 = $250
Retailers should aim for at least $500 per square foot in annual sales, but this can vary depending on your merchandise.
If you sell bulky, inexpensive products, like secondhand furniture, your sales per square foot is likely lower than that of a high-end electronics or jewelry store. That said, if your sales per square foot are significantly lower, they may be lower than they should be.
If you have a brick-and-mortar shop, use sales per square foot to increase sales by:
- Comparing sales per square foot for different areas of the store: If certain areas of your store have higher sales per square feet, try to replicate those merchandising strategies or product selections in underperforming store areas.
- Changing your store layout: If all of your bestselling items are at the front of your store, shoppers might not even be looking at the back half; switch your store layout to encourage shoppers to walk around the whole space.
12. Sales Per Employee
Sales per employee examines how much revenue each employee is bringing in.
Retailers can look at total sales by employee, but a more accurate method is examining an employee’s average retail sales per hour. This method fairly compares full-time and part-time workers.
To calculate the average sales per employee per hour, first gather the total sales by each employee. Take each employee’s individual sales and subtract any commissions they receive from those sales. Finally, divide that number by the number of hours they worked—this will give you their average sales per hour.
(Individual employee’s sales – commissions) / Number of hours worked = Average sales per hour
POS systems automatically show employees’ sales per shift or day. Many systems, like Lightspeed, also let businesses run custom reports on employee sales to see retail store metrics like average sales per hour, sales per category, and sales per time of day.
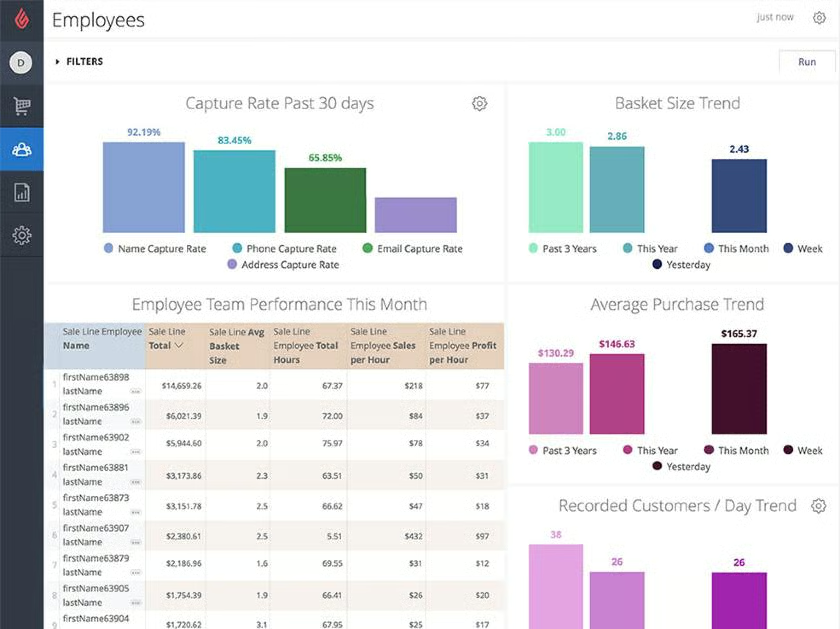
Lightspeed automatically calculates employee sales per hour, employee profit per hour, and average transaction value per employee.
Examining employees’ average sales per hour provides insight into current performance and establishes a benchmark for what retailers can expect employees to accomplish. Average sales-per-employee data can be used to drive sales by:
- Informing staffing decisions: If you want to hit a particular revenue goal, this HR data point will help you determine how many employee hours you will need to hit that goal.
- Spot coaching opportunities: If some employees have an average sales per hour that is much lower than others, they may benefit from sales training to help boost their performance.
- Identify strengths: If some employees have high average sales per hour, retailers can monitor those employees, evaluate what they’re doing that’s causing them to perform well, and share that information with the team.
13. Shrink Rate
Inventory shrinkage is the difference between a product’s recorded stock count and the amount physically on hand. The difference between these two amounts is referred to as “shrink” or “retail shrink”—indicative of missing inventory. Your shrink rate, therefore, tells you how quickly you’re experiencing this loss.
To calculate shrink rate, divide inventory losses by the amount of inventory you thought you had or should have. Multiply this number by 100 to get your shrink rate. A high shrink rate indicates a serious issue.
(Inventory losses / Inventory you should have ) * 100 = Shrink rate
- Detect external theft: External theft involves customers stealing products from your shelves. If you’re experiencing high shrink rates, consider taking these retail theft prevention steps.
- Identify internal theft: The culprit could also be internal, perhaps staff or vendors. High shrink rates might also indicate employee theft. Implementing an employee policy reporting system will help combat this issue.
14. Inventory Carrying Cost
Your inventory carrying cost tells you how much you spend holding product. This includes direct costs like warehouse rent, employee wages, insurance, utilities, and taxes, as well as indirect costs including depreciation and shrinkage. Generally, inventory carrying costs account for 20%–30% of total inventory value.
To calculate inventory carrying cost, add capital costs, service costs, risk costs, and space costs. This sum will tell you the holding cost.
Capital costs + Service costs + Risk costs + Space costs = Inventory Carrying Cost
To calculate it as a percentage of your total inventory value, divide the carrying cost by your total inventory value, and then multiply by 100.
( Inventory carrying cost / Total inventory value ) * 100 = Inventory Carrying Cost (percentage)
- Optimize your warehousing systems: Whether it means reorganizing your warehouse space, negotiating better terms with your landlord, or investing in warehouse management software, look for ways to get more control over this area of your business.
- Consider First In, First Out (FIFO): FIFO inventory is when the first item you put on your shelves is also the first item you distribute when you make a sale. FIFO is a way to mitigate obsolescence holding costs—and it’s especially impactful for businesses that sell perishable goods.
How to Collect & Use Retail Data Analysis
Retail metrics can be a powerful tool for driving sales—but to use them effectively, you’ll need to collect, examine, and interpret the analytics methodically.
The hardest part about using retail analytics isn’t just making sure you have the data available, but knowing how to read it and turn that data into action.
Here’s how to make retail analytics work for your business in five steps:
1. Set Up a POS System
Technically, it is possible to track some retail metrics on your own with a spreadsheet. However, setting up a POS system can ensure accuracy while saving you hours of labor each week—and enable robust analytics by providing data that would otherwise be very difficult to collect.
For that reason, the first step in implementing retail data analytics is to choose a POS system that can create custom reports that make valuable data easier to digest.
2. Choose What to Measure
Before you can use retail analytics to drive sales, decide which data points, KPIs, or general retail industry metrics you want to measure.
If you’re using a POS system, you’ll have a huge volume of information at your fingertips all at once. However, it’s best to focus on a few retail data points at a time and methodically measure a few small changes—instead of trying to track several variables at once and getting overwhelmed.
3. Collect Retail Business Data
Once you choose specific metrics, start collecting that data. This should begin after you set up your POS system.
Many independent retailers try to track sales and customer transactions with spreadsheets. However, this takes a lot of time and rarely yields as much information as a POS.
4. Analyze & Compare Numbers
Simply having these numbers can provide some initial insight into your business’ performance. But to use them to inform business decisions, you’ll need to plug them into one of the specific retail data analytics formulas below to get a more specific and actionable number.
Then, create a set schedule for measuring your chosen analytics so you can track performance over time to see if sales are improving. This can be incorporated into store management duties.
5. Use Retail Analytics to Inform Decisions
Once you determine what to measure and when, use the information you collect to make informed business decisions such as the actions we highlighted above for each metric.
If you’re collecting data around sales of specific product categories, see which categories are performing best. And when it’s time to buy merchandise, invest more in the product categories that have higher sales.
Retail Metrics Frequently Asked Questions (FAQs)
Expand the questions below to get answers to some of your most common retail data analytics questions.
Start by setting up a POS system with an analytics dashboard. Then, use the available analytics reports to start learning relevant retail analytics, like the ones mentioned in this guide.
Retail data analytics may be qualitative or quantitative, and you can use a combination of the two for a more complete picture of your business’ performance. However, retail data analytics can also include:
- Predictive analytics
- Prescriptive analytics
- Descriptive analytics
- Diagnostic analytics
Bottom Line
Now more than ever, business owners need targeted data to make purchasing, marketing, and staffing decisions that will increase profitability without the guesswork.
Retail analytics provide the information for retailers to make informed decisions that can help them compete with bigger businesses.