






Measuring key sales metrics enables you to identify and improve total sales activity, sales forecasts, conversion rates, and the all-around process and cost-efficiency. In this article, we offer 12 examples of sales metrics you can compare to industry standards, previous periods, or internally between individual reps or teams. This helps you find and fix flaws in your sales operation to boost sales performance and efficiency—and increase profits.
| Sales Metrics Example | What It Measures |
|---|---|
| Segmented Revenue | Total sales revenue broken down by a segmented unit, e.g., sales pipeline, product or service, geographic territory, target customer, lead source, sales team, or rep |
| Average Customer Lifetime Value (CLV) | Average revenue generated per customer over the course of the lifespan (average length of time someone remains a customer) with your company |
| Cost of Selling | Total cost to sell your products or services as well as segmented costs (by team, product or service, lead source, and so on) |
| Churn Rate | Also called customer turnover, or the rate of customers who decide not to purchase from your business again, cancel their subscription, or not renew their contract |
| Total Sales Activity | Total number of sales activities, such as calls placed, emails sent, meetings scheduled, presentations delivered, proposals sent, or referrals requested |
| Deal Closing Rate | Percentage of open sales opportunities that become closed deals |
| Leads Generated by Source | Total number of qualified leads generated, broken down by lead source |
| Average Deal Value | Average revenue value of every contract, won opportunity, or deal finalized |
| Average Length of Sales Cycle | Average amount of time it takes to get a lead through the sales process and into a closed deal |
| Sales Qualified Rate | Total percentage of all leads that have shown interest in your products or services by seeking price estimates or expressing they are almost ready to purchase |
| Weighted Deal Value of Pipeline | Total value of all deals in the pipeline times the percent chance of closing each deal |
| Rate of Selling Activity | Percentage of time a sales rep spends on selling activities |
- 1. Segmented Revenue
- 2. Average Customer Lifetime Value (CLV)
- 3. Cost of Selling
- 4. Churn Rate
- 5. Total Sales Activity
- 6. Deal Closing Rate
- 7. Leads Generated by Source
- 8. Average Deal Value
- 9. Average Length of Sales Cycle
- 10. Sales Qualified Rate
- 11. Weighted Deal Value of Pipeline
- 12. Rate of Selling Activity
- Using Sales Metrics to Improve Sales Performance
- Bottom Line
1. Segmented Revenue
What it measures: Total sales revenue broken down into segments
While total revenue shows how your business is performing overall, segmenting revenue into categories tells a deeper story about what areas are working and which need improvement. Segmented revenue can be broken down by things like product or service line, geographic territory, sales team, target customer or persona, lead source, and individual sales rep.
Determining the segmented sales analysis metrics is the first step in measuring sales performance because it allows you to identify the “what,” as in what areas need improvement. Once you know what needs improvement, brainstorm ideas about refining the specific category or revenue. Or, if you’re referring to revenue broken down by lead source, you may decide to discontinue using specific lead sources.
For instance, you found that over the last six months, $100,000 was generated by online inbound leads, $56,000 was generated by outbound sales prospecting, and $9,000 was generated by trade show leads. Instead of investing in future trade shows, you would then decide to invest more resources in inbound marketing and outbound sales.
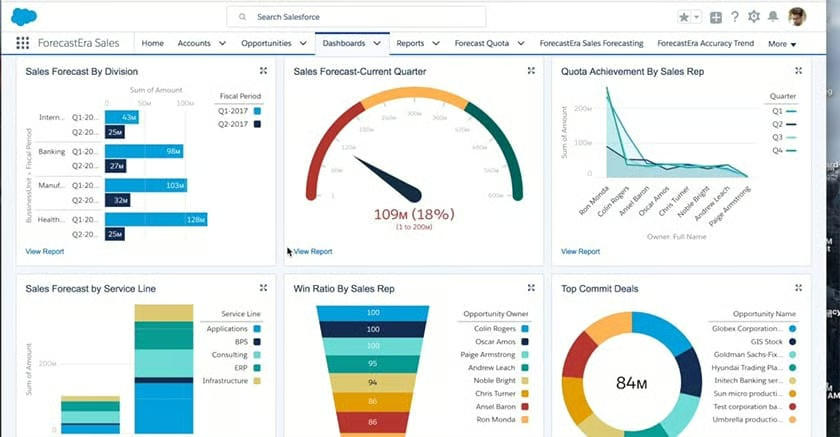
Customer relationship management (CRM) systems like Salesforce show sales revenue breakdown information on the system’s dashboard. Plus, Salesforce takes your current key performance indicators (sales KPIs) and other data like activity, opportunities in the pipeline, and deal values to create up-to-date sales forecasts. Real-time forecasts help estimate business growth by predicting how much revenue you plan to generate.
2. Average Customer Lifetime Value (CLV)
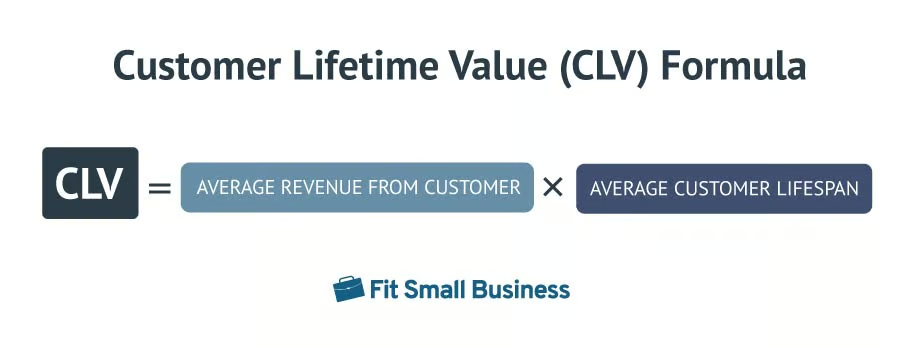
What it measures: Average revenue generated per customer over their lifetime with a company
Although measuring CLV requires a few years of historical data, it shows the true value of attaining a new customer in terms of lifetime revenue. Average customer lifetime value shows your business’ effectiveness at customer retention and remarketing to existing customers. This, in turn, reveals where improvements can be made to extend the length of the average lifespan and increase the average amount a customer spends over that span.
This sales metric is also an excellent way to evaluate whether your sales team and customer service reps are effective at cross-selling and upselling to new and existing customers. Plus, you can use this stat to see how your business compares with industry standards and measure it over time to see if you are executing strategies needed to increase the average lifetime value.
Average Customer Lifetime Value (CLV) Calculator
3. Cost of Selling
What it measures: Total cost of selling your product or service
Sales metrics related to revenue or deals are often the most common metrics for sales performance. However, the true cost of selling reveals your sales productivity and efficiency. The cost of selling includes sales materials, salaries, commission expenses, salesman productivity, sales technology, travel expenses, and event costs.
The cost of selling can be looked at as a whole for a sales organization or segmented by different sales teams, sales methods, or product lines. Looking at sales productivity metrics allows you to improve profitability performance by reducing or eliminating expenses that aren’t necessary to produce sales.
For example, let’s say you break down the total cost of selling by the three sales teams that make up your department. You discover your top-selling team spent $0 on travel expenses because they used video conferencing software to meet with distant prospects. At the same time, sales efficiency metrics show that although the two other teams spent $5,000 on travel, they produced significantly less revenue.
As a result, you conclude that travel expenses are unnecessary to close deals, and you decrease budget spending for those kinds of expenses accordingly. In addition to eliminating waste and identifying the most effective selling tools and methods, this directly impacts your business’ bottom line and profitability.
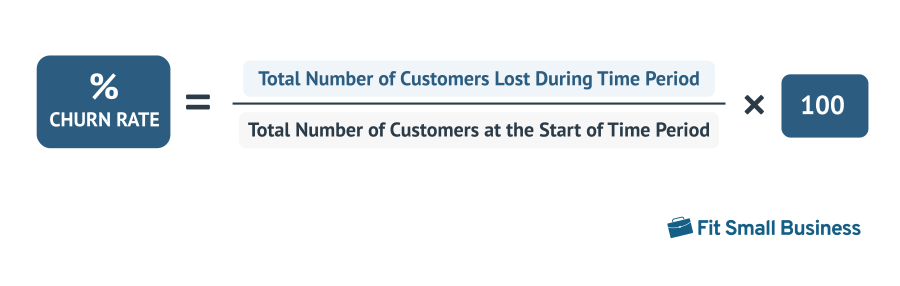
4. Churn Rate
What it measures: Percentage of customers who decide not to purchase from your business again, cancel their subscription, or don’t renew their contract
Knowing your churn rate (also known as your customer turnover rate) enables you to evaluate your company’s customer service and ability to retain or resell to existing customers. Due to how expensive it is to bring on a new customer or client, keeping the churn rate as low as possible is essential to ensure maximum sales value.
Your churn rate tells the story of how your revenue is being generated so you can make adjustments that improve sales performance metrics. For example, if you find your business is great at acquiring new business but has an 85% churn rate, your organization’s CLV is not being maximized, and the cost of selling may be far more than average or desirable.
Improvements in your sales operation to decrease churn and increase customer retention also lower the costs of marketing and advertising needed to acquire new business. Examples of sales process improvements to reduce churn are adding resources to customer service and training sales and customer service agents. You can also add new products that appeal to existing customers, create loyalty programs, and develop more effective cross-selling and upselling strategies.
Churn Rate Calculator
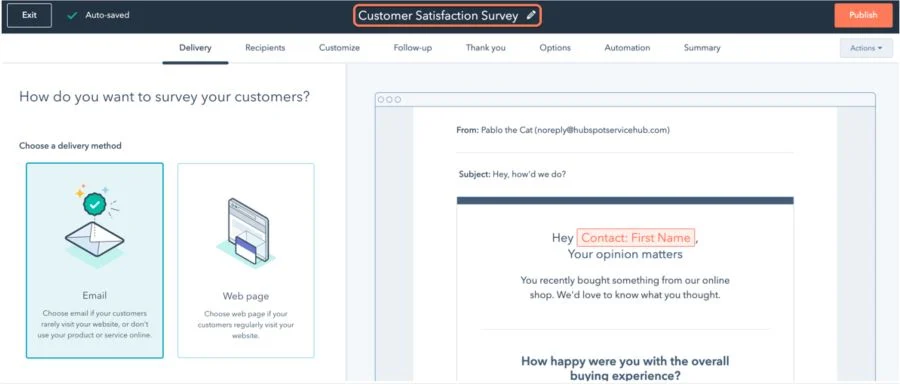
CRM platforms like HubSpot CRM allow you to catch customer churn before it happens by creating and emailing customer surveys. HubSpot users can quickly find out exactly how their customers feel through custom surveys. They can also use this tool to discover things they can do to improve customer satisfaction, decrease selling costs, and increase average customer lifetime value.
5. Total Sales Activity
What it measures: Total daily, weekly, or monthly sales activity completed by sales reps, including calls placed, emails sent, proposals sent, appointments created, referrals requested, and sales presentations or product demos conducted
Sales activity metrics show what each sales rep or team is doing with their time. Your business activity will vary depending on how leads are generated and how your sales pipeline is set up. The idea behind measuring sales activity is that if you know the conversion rates of your sales pipeline and funnel, you can use total sales activity to measure, predict, and improve sales performance.
For example, imagine you want to generate $50,000 of revenue this quarter, and you know it takes four product demos for every deal closed, with an average deal size of $10,000. You also know it takes an average of 70 cold calls to schedule one product demo. Based on this information, the activity required to schedule enough appointments to close five deals at $10,000 each is 1,400 cold calls during the quarter.
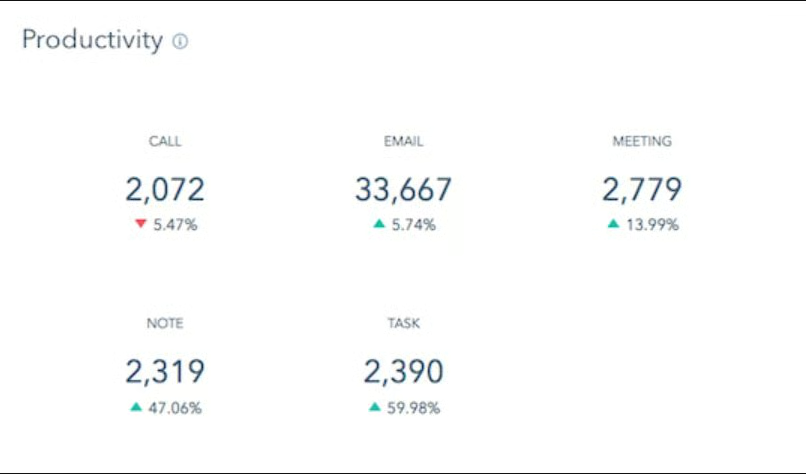
You can easily track activity metrics designed to hit your company’s sales goals using CRM systems like HubSpot. HubSpot takes the total sales activity completed and breaks it down by sales rep and activity type. Managers can then generate sales reports to see which reps are performing well vs those needing more coaching or sales training.
6. Deal Closing Rate
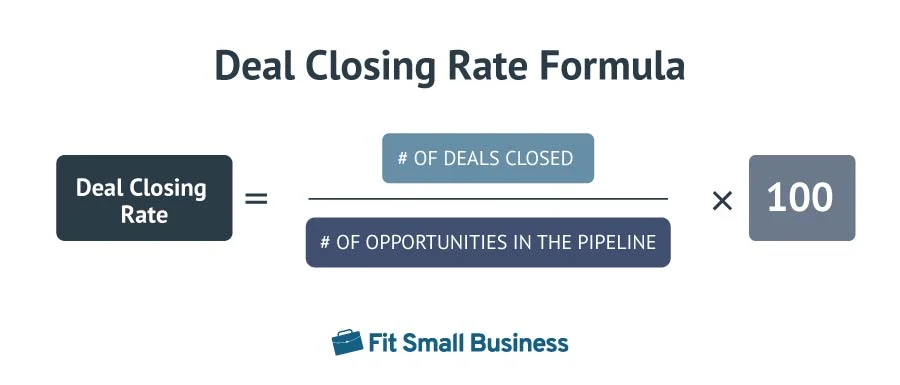
What it measures: Percentage of deals closed compared to current open opportunities
The deal closing rate is used as a predictor for sales forecasts and as sales performance metrics for how efficient your sales pipeline is. When used for forecasting, for example, if you know that 3% of all opportunities in the pipeline are closed deals, and you set your deal goal at 50 per year, you’ll need about 1,667 total leads generated to hit your sales goal.
When using deal closing rate to evaluate your pipeline, you can improve performance by finding where the bottlenecks are in the pipeline that are negatively impacting deal win rates. The closing rate is an accumulation of the entire sales process, so you also want to look at the conversion rates of each stage in the pipeline to get a better picture.
For example, let’s say your deal closing rate is 3%, but you found a significant drop-off where opportunities are being lost at the sales presentation stage of the pipeline. Knowing that, you can invest in sales training programs to improve your team’s ability to deliver successful sales presentations.
Deal Closing Rate Calculator
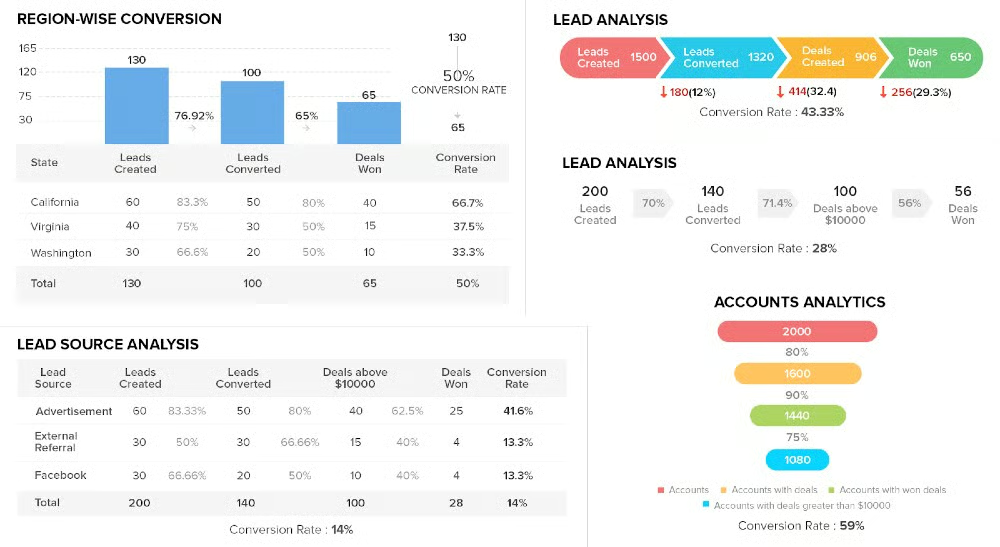
CRMs like Zoho CRM help you analyze closing and conversion rates for all sales pipeline stages. From the pipeline analysis dashboard, you can see how effectively your sales team gets a lead to the next spot through a funnel style, horizontal pipeline, and a listed breakdown by geographic territory or lead source.
7. Leads Generated by Source
What it measures: Total qualified leads generated broken down by lead source
This sales metric enables you to identify the most effective and efficient lead sources for your business. Tracking how many and where each lead came from during a set time period shows how good your business is at getting opportunities in the pipeline and which lead sources offer the most promise.
Using the leads generated sales metric broken down by source is one of the most solid sales performance measurements. It can also show you the best source of qualified leads, or leads that have expressed interest in your business to some degree and are more likely to convert.
For example, let’s assume that of your qualified leads, 30% are generated through online ads, 25% are from outbound prospecting, 20% are from networking events, 15% are from referrals, and 10% are inbound from content marketing. Since content takes a long time to develop, you may want to redirect effort and resources to other lead generation tactics that are more effective and take less time to execute, such as seeking referrals or online advertisements.
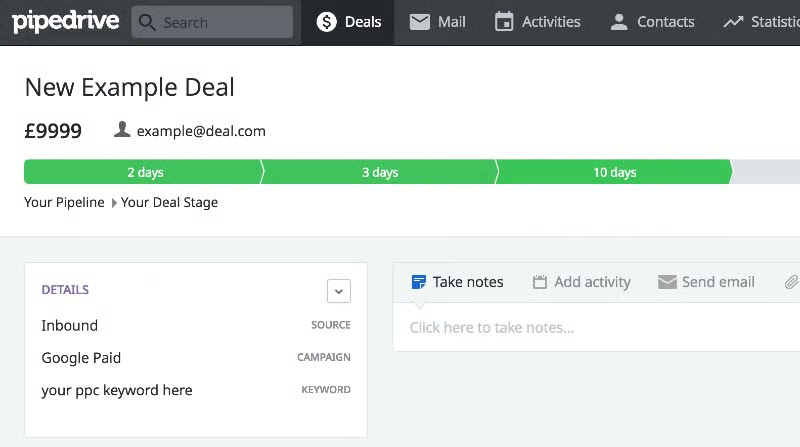
CRMs like Pipedrive can track the source of a deal, lead, or opportunity within its profile. This allows you (or any sales rep) to view a contact’s record and discover where they became aware of or are interested in your business, so you are better informed before starting a conversation.
8. Average Deal Value
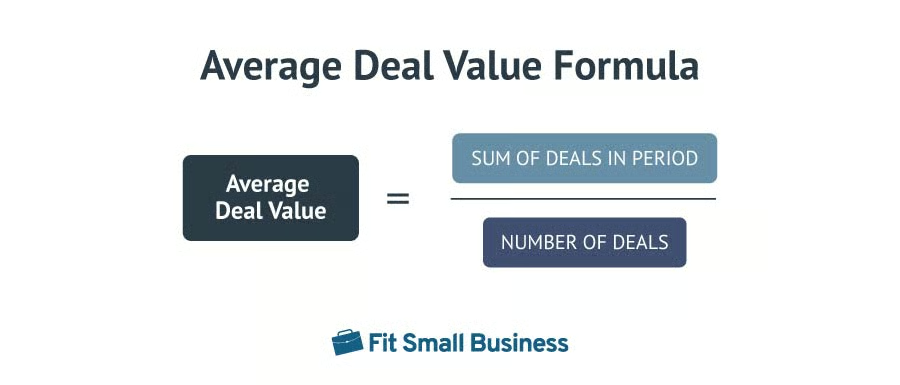
What it measures: Average revenue from a closed deal or won opportunity
By knowing how much, on average, you bring in per every deal closed, you can forecast the total revenue you will acquire over a specific period. If your average deal value is $10,000 per deal, per year, and you know, based on your pipeline conversion rates and total activity quotas, that 12 deals will be made, then your total projected revenue is $120,000.
Knowing your average deal value improves sales performance by dictating your target markets. Let’s say you are a software company that was initially targeting small businesses, but after two years, you found your average deal value was much higher than expected because of some large deals that were closed. This tells you that your software is well-suited for larger businesses, so you can shift your sales strategy to produce higher-value, more profitable deals.
Average Deal Value Calculator
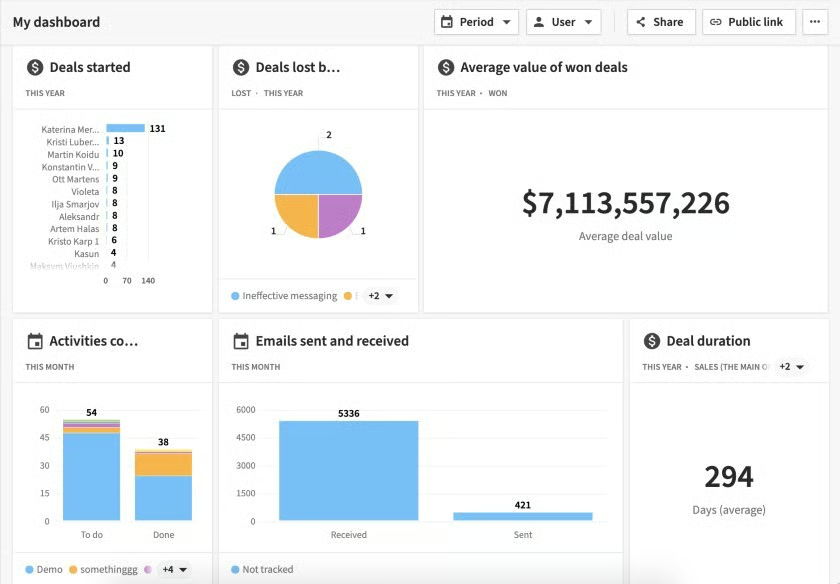
CRMs like Pipedrive offer an array of deal analyses via sales dashboards. Using data about your current opportunities and closed deals, Pipedrive can display information on average deal value, the average time it takes to close a deal, deals lost, deals started, and activity metrics to see what’s being done to close the deal.
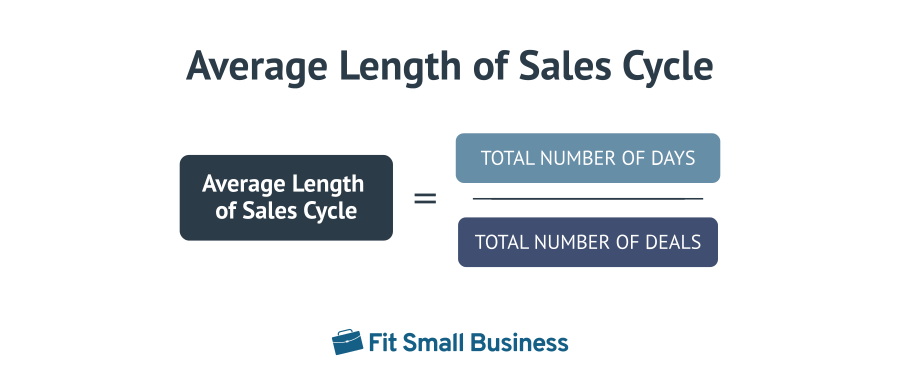
9. Average Length of Sales Cycle
What it measures: Average number of days to turn a new lead into a purchasing customer
To estimate when a deal will close, the average length of your sales cycle is an essential sales metric. This stat can be taken a step further to improve individual performance metrics if you evaluate the average length of a sales cycle per sales rep to see which ones are quickly responding to opportunities and putting in plenty of activity.
For example, while looking at the average length of a sales cycle for John and Richard, you find John’s average is 140 days while Richard’s is 230. You also look into each rep’s activity and find John responds to all inquiries within one day and sends 20 follow-up emails daily. Richard takes three days to respond and only sends five follow-up emails per day. With this sales data, you can work with Richard to set clearer expectations on sales and follow-up activity.
Average Length of Sales Cycle Calculator
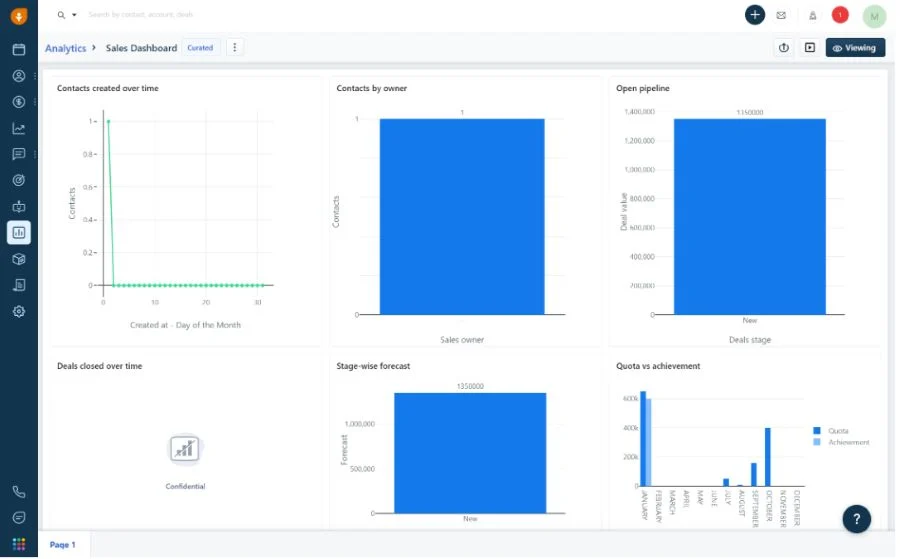
Use a CRM like Freshsales to create corresponding revenue-to-activity reports. One of the unique capabilities of Freshsales in this respect is its sales cycle and sales velocity reporting. It provides information on the average time each sales rep spends with a lead in a specific stage of the pipeline.
10. Sales Qualified Rate
What it measures: The percentage of sales-qualified leads determined either by expressing interest in your products or services by seeking cost estimates, or by telling a sales rep they are almost ready to purchase
This stat shows how effective your sales and marketing teams are at gauging interest among leads ready to make a purchasing decision. Being sales-qualified is the highest level of lead qualification someone can be at before making a purchase decision. The higher your sales-qualified rate, the more deals you are likely to close.
Tracking this sales metric shows you the proportion of leads your sales reps should prioritize—the ones closest to making a purchase. You can also improve performance if you find marketing qualified leads (MQL) rates are high but sales qualified rates are low. For instance, your team can prioritize follow-up activity and sales promotions that entice leads to become sales-qualified.
11. Weighted Deal Value of Pipeline
What it measures: Total value of all deals in the pipeline multiplied by the percent chance of closing each deal
The weighted deal value of your sales pipeline is a way to forecast your business’ total sales. It takes into account the total potential value of a deal along with the percentage chance that you will close the deal, and then aggregates all the current deals in your pipeline.
For example, imagine you have 12 current opportunities. Six are valued at $4,000, and each has a 20% chance of closing, and the other six are for $7,000 with a 10% chance of closing. Your total weighted deal value and project revenue for that pipeline are then $9,000. This information can be used to determine which route to take to produce more revenue or hit revenue goals.
If the weighted deal value of your pipeline is lower than you’d like, you then have three options. The first is to create more opportunities by generating more leads. The second is focusing on leads and opportunities with a larger potential deal value. The last option is to increase your likelihood of closing the deal through lead nurturing activities.
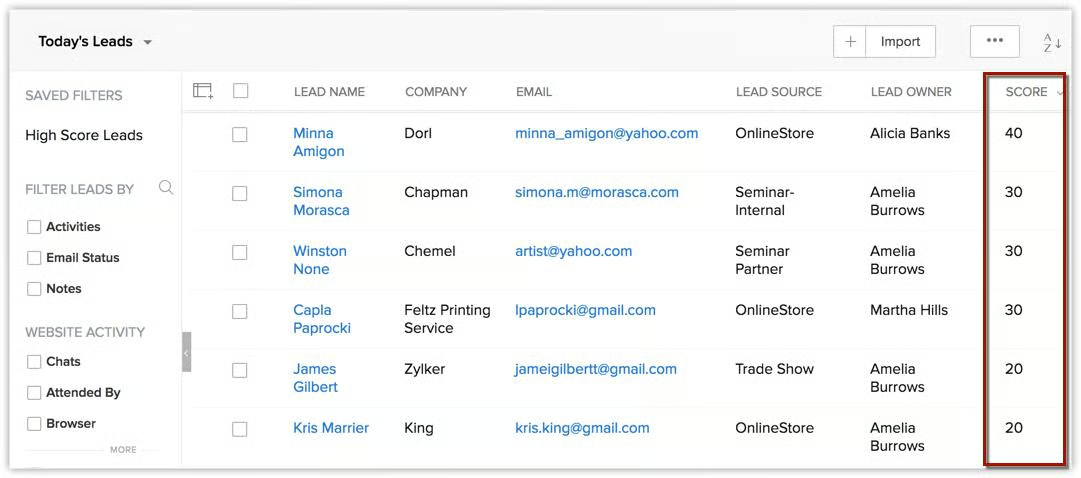
One way to determine the possibility of closing a deal is through lead scoring. Lead scoring assigns a quantitative value to each lead in terms of how robust an opportunity it is to pursue based on interactions with them and behavior indicators like links clicked, downloaded files, or emails opened. Lead scoring can be calculated and tracked in CRM systems like Zoho CRM.
12. Rate of Selling Activity
What it measures: Percentage of a sales rep’s time spent on selling activities like making calls, sending introduction or follow-up emails, creating and sending proposals, conducting presentations, or requesting referrals
Knowing how much time a sales rep is spending on selling-related activities allows sales managers to hold reps accountable for performance goals and activity quota attainment. In addition, it can answer the questions as to “why” they are unable to hit their activity quotas or revenue goals. This metric can also help you determine if they are spending too much time on non-selling activities, like surfing the web or doing data entry.
Tracking the rate of selling performance enables you to improve operational performance by finding the root cause of selling deficiencies. For example, if a sales team did not hit their performance quota of $500,000 revenue because 50% of their time was spent manually entering lead data in a CRM system, you may need to hire clerical staff or automate data entry.
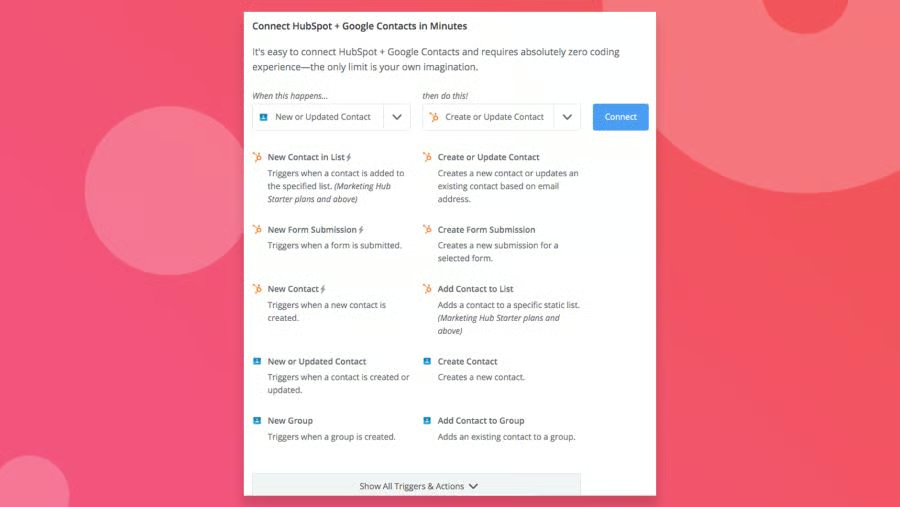
Data entry automation tools like Zapier give your sales team their time back doing sales activities. Through Zapier integrations and workflow configuration, when a new lead emails you or someone submits an online web form, their contact information is automatically added to a data system such as a CRM or spreadsheet.
Using Sales Metrics to Improve Sales Performance
The ultimate goal of using sales metrics is to make adjustments that improve sales performance. Many metrics are key performance indicators (KPIs) that tell sales management which areas need the most improvement vs which strategies are working well and should be expanded. For example, if the total revenue for a business is $600,000 but only $50,000 is from recurring customers, a sales manager needs to find ways to decrease churn, improve CLV, and increase customer loyalty.
Some metrics, such as total sales activity and closing rates, can also show comparisons between teams and individual reps. These comparisons allow you to hold people accountable for not hitting quotas and reveal methods or patterns of activity that work well, but may not have been thought of before.
For example, let’s say you looked at the sales activity of three sales reps and found that one of them generates more sales-qualified leads than the other two combined. The high-performing sales rep attends 12 networking events and one trade show per month, creating tons of personal connections. This prompts you to require your other two sales reps to start attending networking events and trade shows.
Upon finding patterns that lead to higher sales performance, sales metrics tell a deeper story of what’s happening, allowing you to hone in on the root causes of poor sales performance. The most important sales metrics can then be used as you create or update your company’s sales plan.
Bottom Line
Sales metrics tell the true story about what is going on in your sales operation, enabling you to make critical decisions to improve sales performance. The best sales metrics show where improvements need to be made and which parts of your sales process are falling behind. You can leverage that information to adjust your long-term strategy, increase resources, and provide coaching to your sales teams.
