


Customer service reports are dashboards or documents that provide businesses with an overview of a support team’s activity summary, individual agent performance, and quality of customer interactions. It helps you identify actionable insights like best practices and areas for improvement related to customer experience. Companies need to generate various kinds of reports to gain full visibility of their customer service quality.
Below, we share seven essential reports every business should generate from their customer service software to assess their servicing quality regularly.

1. Customer Service Team Report
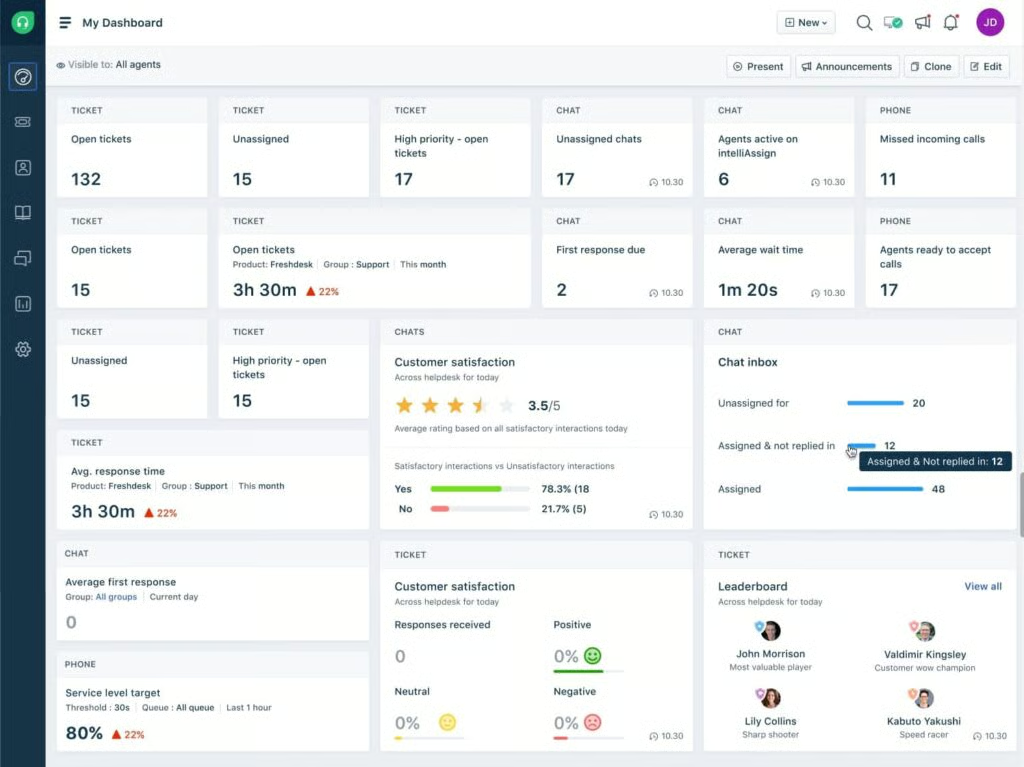
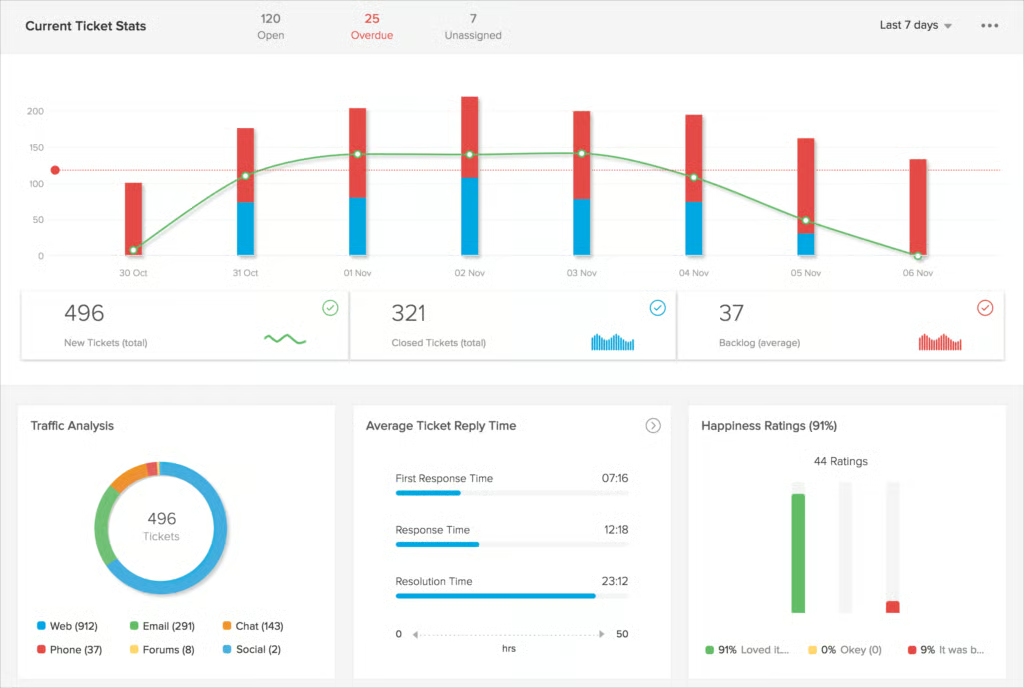
The customer service team report gives you an overview of your team’s daily, weekly, or monthly performance. It also highlights the agents’ SLA compliance, response time, individual performance, and request volume from every support channel. A quick look at this report helps you assess the overall health of your support team and determine if your agents are on track to achieving business goals.
Relevant KPIs and Metrics
- Average response time: It measures the time it takes a support agent to respond to a call, email, web form, or live chat query. The quicker your reps respond to queries, the higher your customer satisfaction and agent productivity rates will be.
- First call resolution: It is the success rate of the support team in solving an issue during the first point of contact with the customer.
- Number of requests: It is the volume of incoming calls and support requests, including the nature of each issue. This lets you know which particular times have high call volumes, so you can plan an appropriate work schedule for agents.
- Top-performing agents: It lists the support agents according to their performance over a specified period. It highlights those who deserve recognition and helps you identify which agents need additional training or coaching.
2. Customer Satisfaction Report
The metrics included in the customer satisfaction report help you understand customers’ sentiment toward your company and the quality of support provided. A drop in these metrics could indicate decreasing customer service quality, poor product quality, or bad marketing decisions. On the other hand, a company that maintains good scores in this report has satisfied, engaged, and loyal customers.
Relevant KPIs and Metrics
- Net promoter score (NPS): It shows how the public perceives your service levels and how likely they are to refer your business to their peers.
- Customer effort score (CES): It measures how much effort your customers have to exert to resolve an issue or answer their questions.
- Customer retention rate: It is the percentage of a company’s existing customers who remain loyal over a given period.

3. Customer Service KPI Report
The customer service KPI report provides each support rep’s performance evaluation and allows you to drill deeper into individual metrics. The KPIs in this report counterbalance customer-based feedback, giving a more accurate picture of how well your agents meet your support standards. They help determine whether the feedback was intended for your support, product, or customer experience.
In some cases, support agents receive poor ratings because of customers’ unrealistic expectations of how they should resolve issues. On the other hand, customers can also give high ratings for satisfactory services, such as when reps go the extra mile to resolve a concern. Customer service analytics give managers a targeted insight into service quality based on rating categories specific to the company.
As an example, consider a customer who purchases a product from a company for the first time and is impressed by how the support agent handled the transaction. The buyer gives the transaction a high rating even when their interaction lasts longer than what the company considers acceptable. This discrepancy can be easily spotted by looking at the customer service KPI report.
Relevant KPIs and Metrics
- Service level agreement (SLA) compliance: It measures your capacity to meet the SLA standards and helps identify new ways to improve overall customer service standards.
- Customer support vs revenue: It calculates the cost of customer support in relation to the total revenue. The ideal goal is to provide high standards of service at lower costs.
- Customer satisfaction (CSAT) score: It measures a customer’s satisfaction with your products and services at key customer journey touchpoints. This KPI provides insights into how effectively your company is meeting expectations.
4. Customer Retention Report
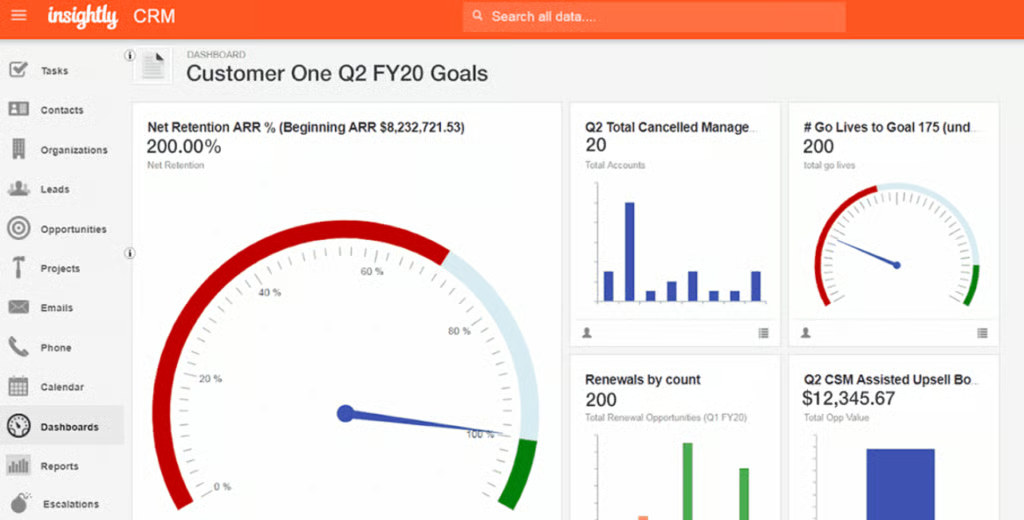
This report provides detailed analysis and metrics that help you understand how and why customers stay loyal to your brand or churn. It offers at-a-glance insights into your strengths and weaknesses, as well as how much money is won or lost in a given month. Moreover, you can identify potential customer loyalty issues and create strategies to retain more clients.
Relevant KPIs and Metrics
- Customer churn rate: It is the percentage of customers who have stopped using your brand or service over a specified time frame.
- Revenue churn: It tracks, monitors, and measures the percentage of revenue you have lost from existing customers and tells you where the revenue loss came from.
- Monthly recurring revenue (MRR) growth rate: It tells how your customer retention rates affect your monthly revenue.
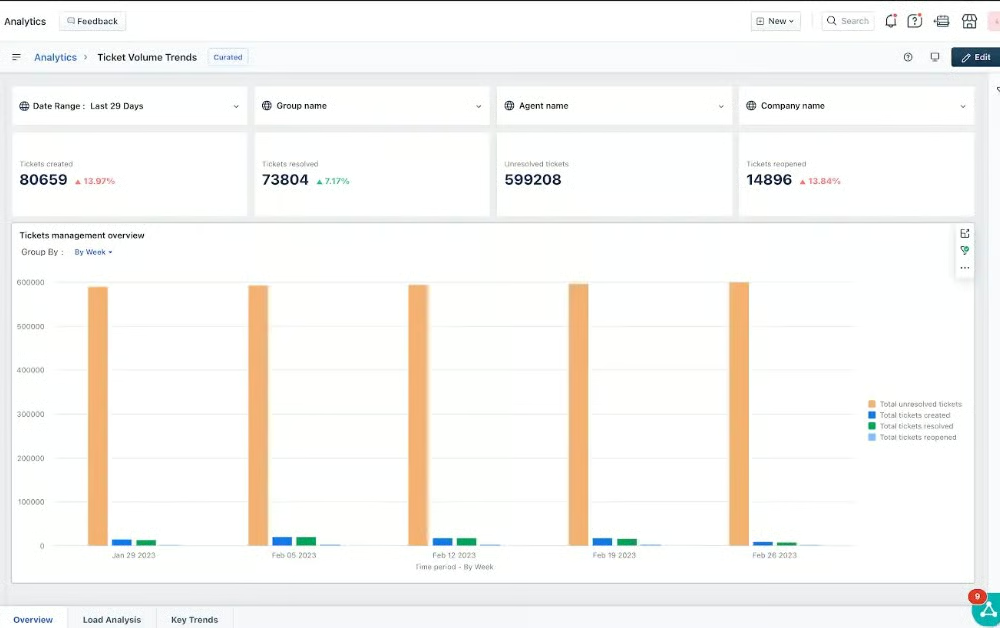
5. Ticket-level Report
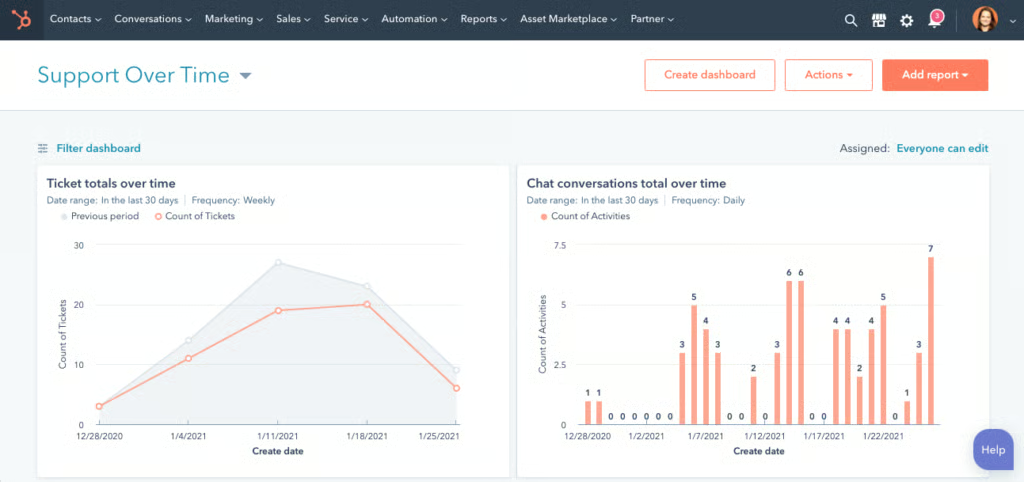
The ticket-level report offers granular data, such as created and resolved tickets, missed calls, chat average pickup time, average resolution time, and ticket volume from each channel. This includes details of all incoming emails, support calls, live chats, survey forms, and social media messages. It also indicates which support channels are used most by your customers.
It is crucial to monitor the ticket-level report because its metrics play a critical role in customer satisfaction. For example, if the average time to close is high, you can investigate what’s taking up their time. Also, ensure the frequently answered questions (FAQs) are covered in your knowledge base, so your reps don’t need to type out the same instructions repeatedly.
Relevant KPIs and Metrics
- Ticket volume: It is the number of incoming support tickets received by the customer service team.
- Time to close: It is the average time it takes for the support team to resolve a customer issue.
- Open rate: It is the proportion of tickets waiting for a solution in a specified period.
- Escalation rate: It is the percentage of cases that first-line agents elevated to their senior leaders and managers to be resolved.
6. Individual Agent Productivity Report
The individual agent productivity report gives the manager a detailed view of a support rep’s activities and performance within a specified time frame. The relevant metrics here are similar to those seen on the customer service team dashboard, except this one is for an individual agent. This report allows you to monitor a rep’s efficiency and ability to resolve issues, as well as determine where additional one-on-one coaching is required.
Relevant KPIs and Metrics
- Ticket volume per rep: It is the number of tickets assigned to an agent for a specified time period.
- Tickets closed: It is the proportion of received requests successfully resolved by an agent.
- Customer satisfaction: It reflects customers’ collective rating or level of happiness with an agent’s performance and engagement.
- Time to resolution: It is the average time it takes an agent to resolve an issue.
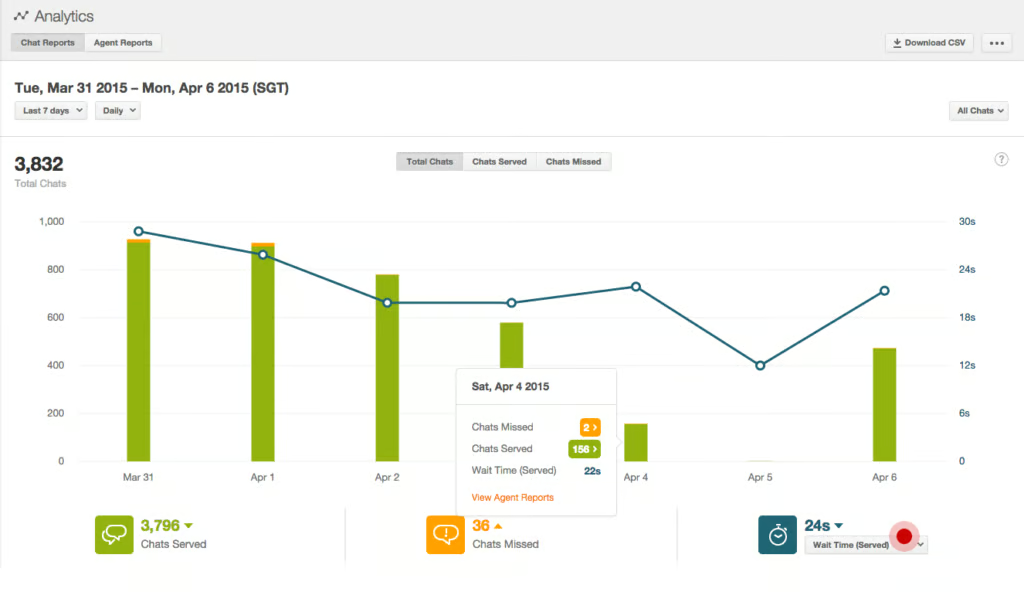
Zendesk analytics dashboard shows agent chat performance metrics. (Source: Zendesk) 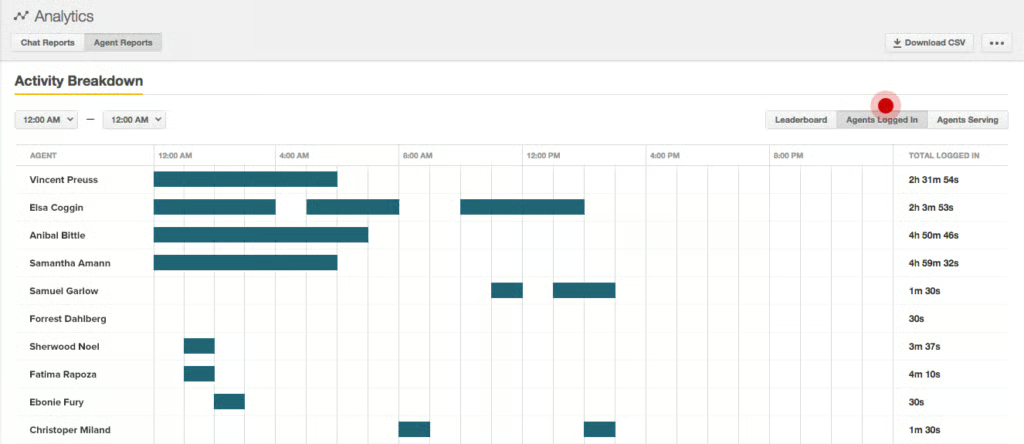
Zendesk analytics dashboard shows agent productivity breakdown report. (Source: Zendesk)


7. Case Performance Report
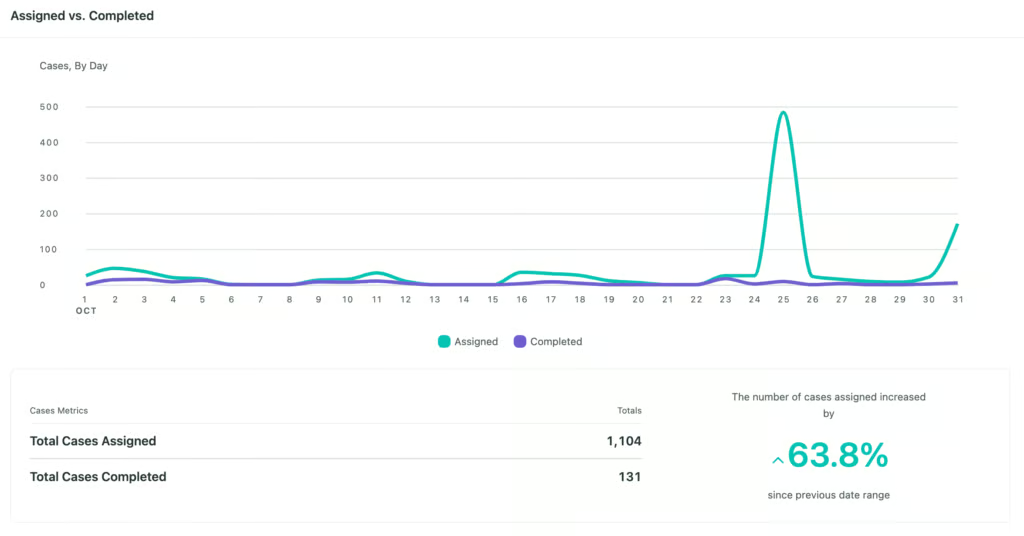
This customer support report enables managers to measure agent productivity and efficiency based on the status of assignments and how they were handled accordingly. The relevant metrics are related to a ticket-level report. A case performance report compares the number of assigned cases and the total number of cases completed successfully, which is useful in managing your hiring and staffing.
Relevant KPIs and Metrics
- Completed: It is the number of cases marked as complete. If you reassign a case to another rep, this counts as ‘completing’ or ‘being completed’ for this report.
- First Touch: This metric counts the duration a case is assigned to a rep and when the agent replies to the assigned message.
- Active Case Time: This refers to the cumulative time a case is open, giving insight into the duration a case remains open since it was assigned.
- Case Resolution: This metric pertains to the time the case is first assigned to a rep up to when it is marked as complete.
- Completion Ratio: This is the ratio of assigned cases marked as completed within the time range of reporting.
Benefits of Customer Service Reports
Regularly running and monitoring reports on customer service metrics and performance helps support team managers easily spot trends and patterns in agent performance and customer experience. Below are five top benefits of customer service analysis reports, including details on how they contribute to increased customer satisfaction.

Better Understanding of Customer Experiences
Customer experience metrics like CSAT score and NPS are excellent indicators of how happy your customers are with your offerings. To make sure you interpret these statistics accurately, implement customer service analysis reports at every touchpoint. These reports help spot and fill customer experience gaps, as well as determine what you are doing right along the way.
For example, let’s look at how unexpectedly high shipping fees could affect a customer’s buying experience. If a report indicates customers are abandoning their shopping cart once shipping fees are shown, you can offer free shipping for every $50 worth minimum of products. This tactic could improve the customer experience and encourage shoppers to complete their purchases.
Real-time Updates on Team Performance
It might be easier for small businesses to track their support team’s performance and activities. However, it’s not the same for bigger companies with dozens of employees. Fortunately, you can easily generate and pull up real-time updates on assignments, activities, and performance using service reporting tools.
Real-time reports give a birds-eye view of your work processes’ health. For instance, your customer service team dashboard tells you that your agents’ number of resolved tickets has been abnormally low in the last few days. Upon investigation, you find they have difficulty answering questions about a new product. To improve their resolved ticket score, you can conduct additional training or a refresher course on the product in question.
Data-based Goals & Decisions
Service reports provide support team managers with reliable data on which they can base their decisions. These include decisions on staff scheduling, hiring, team expansion, promotion, coaching, and even termination. You can also refer to data on customer satisfaction levels when proposing changes in your service protocols.
For example, let’s say launching a new batch of products has doubled your team’s ticket volume, and many support calls are going unanswered. Based on this finding, you can hire new agents to accommodate all incoming requests.
Increased Agent Productivity
Customer service reports can be used to increase agent productivity. The data shown in the reports can be used to craft sales compensation plans and other employee motivation ideas. This helps sales agents do their jobs better and inspires high achievers to maintain their level of performance.
Improved Customer Loyalty
Reports on customer experience and satisfaction tell you if your clients are happy and would want to remain loyal to your company. If reports reflect that they are unsatisfied with your product or their buyer experience, you can propose and implement changes, like new packaging, to improve their perception of your brand.
Frequently Asked Questions
What makes a good customer service report?
A good customer service report comprehensively outlines your customer service team’s performance, activities, and outcomes related to customer interactions and experiences. It is easy to understand and well-presented in an intuitive dashboard or document with accurate data.
What is the most important customer service report?
Customer satisfaction reports are one of the most important customer service reports. While all types are essential in business, knowing what your customers feel and think about your business is what matters most. It is the foundation and basis of your customer service strategy and performance metrics.
How can customer service reports improve customer satisfaction?
Customer service reports can improve customer satisfaction by providing customer service managers and reps with actionable insights. The generated data from customer service analysis reports can be used as a basis for developing customer support strategies that extend to sales, marketing, and other business functions.
Bottom Line
Customer service analysis reports are essential indicators of your support team’s performance, product, and work processes. They also provide actionable insights into what customers expect of your product, solution, or service, as well as how well your reps effectively manage requests for support. Ultimately, these reports promote higher customer satisfaction and more positive experiences by guiding you to meet customers’ needs and expectations best.