Learn about key payment statistics around consumer preferences for speed and convenience, including a decline in cash use and an increase in mobile and contactless payments.
Payment trends and technologies like buy now, pay later (BNPL) and innovations across traditional payment channels like live chat and messaging platforms have also mushroomed into the mainstream. Below, we review general customer payment preferences and payment statistics and trends across the retail, ecommerce, restaurant, and B2B industries.
Key Takeaways:
- Cash use isn’t going away but continues to decline, with cash payments falling 8% in 2023.
- Digital wallet payments are consumers’ most preferred payment method.
- With the growth of consumer adoption of BNPL, more than half of retailers offer this type of financing.
- The majority of restaurant operators are prioritizing investments in technology.
- Paper checks remain the most common B2B payment method, but the use of other methods is increasing.
Customer Payment Preferences
1. 48% of shoppers believe it’s highly important to have payment choices
According to one survey by PYMNTS.com, nearly half of US shoppers believe payment choice is a “highly important feature” for merchants to provide.
2. 16% of consumers switched to a new payment method
According to PYMNTS, about 16% of shoppers have switched to a new payment method in 2023. In addition to those shoppers, nearly half have tried a new payment method, even if they haven’t officially made the switch. Consumers are increasingly open to trying new modes of payment, and it’s also becoming increasingly important for merchants to keep up.
3. 30% of consumers who switched moved to digital wallets
Of the surveyed shoppers who have switched to new payment methods, nearly a third have turned to digital wallets. Many who tried digital wallets for the first time ended up sticking with this payment option, replacing their former way of paying for purchases. In fact, 40% of consumers who tried digital wallets have since decreased their use of other payment methods.
4. Cash payments decreased by 8% in one year
Globally, cash payments fell by 8% in 2023. They’re expected to continue declining, at 6% each year through 2027. However, cash payments are still important to both businesses and consumers alike. In fact, cash accounted for 16% of global transactions in 2023.
5. 16% of consumers pay for all purchases with cash
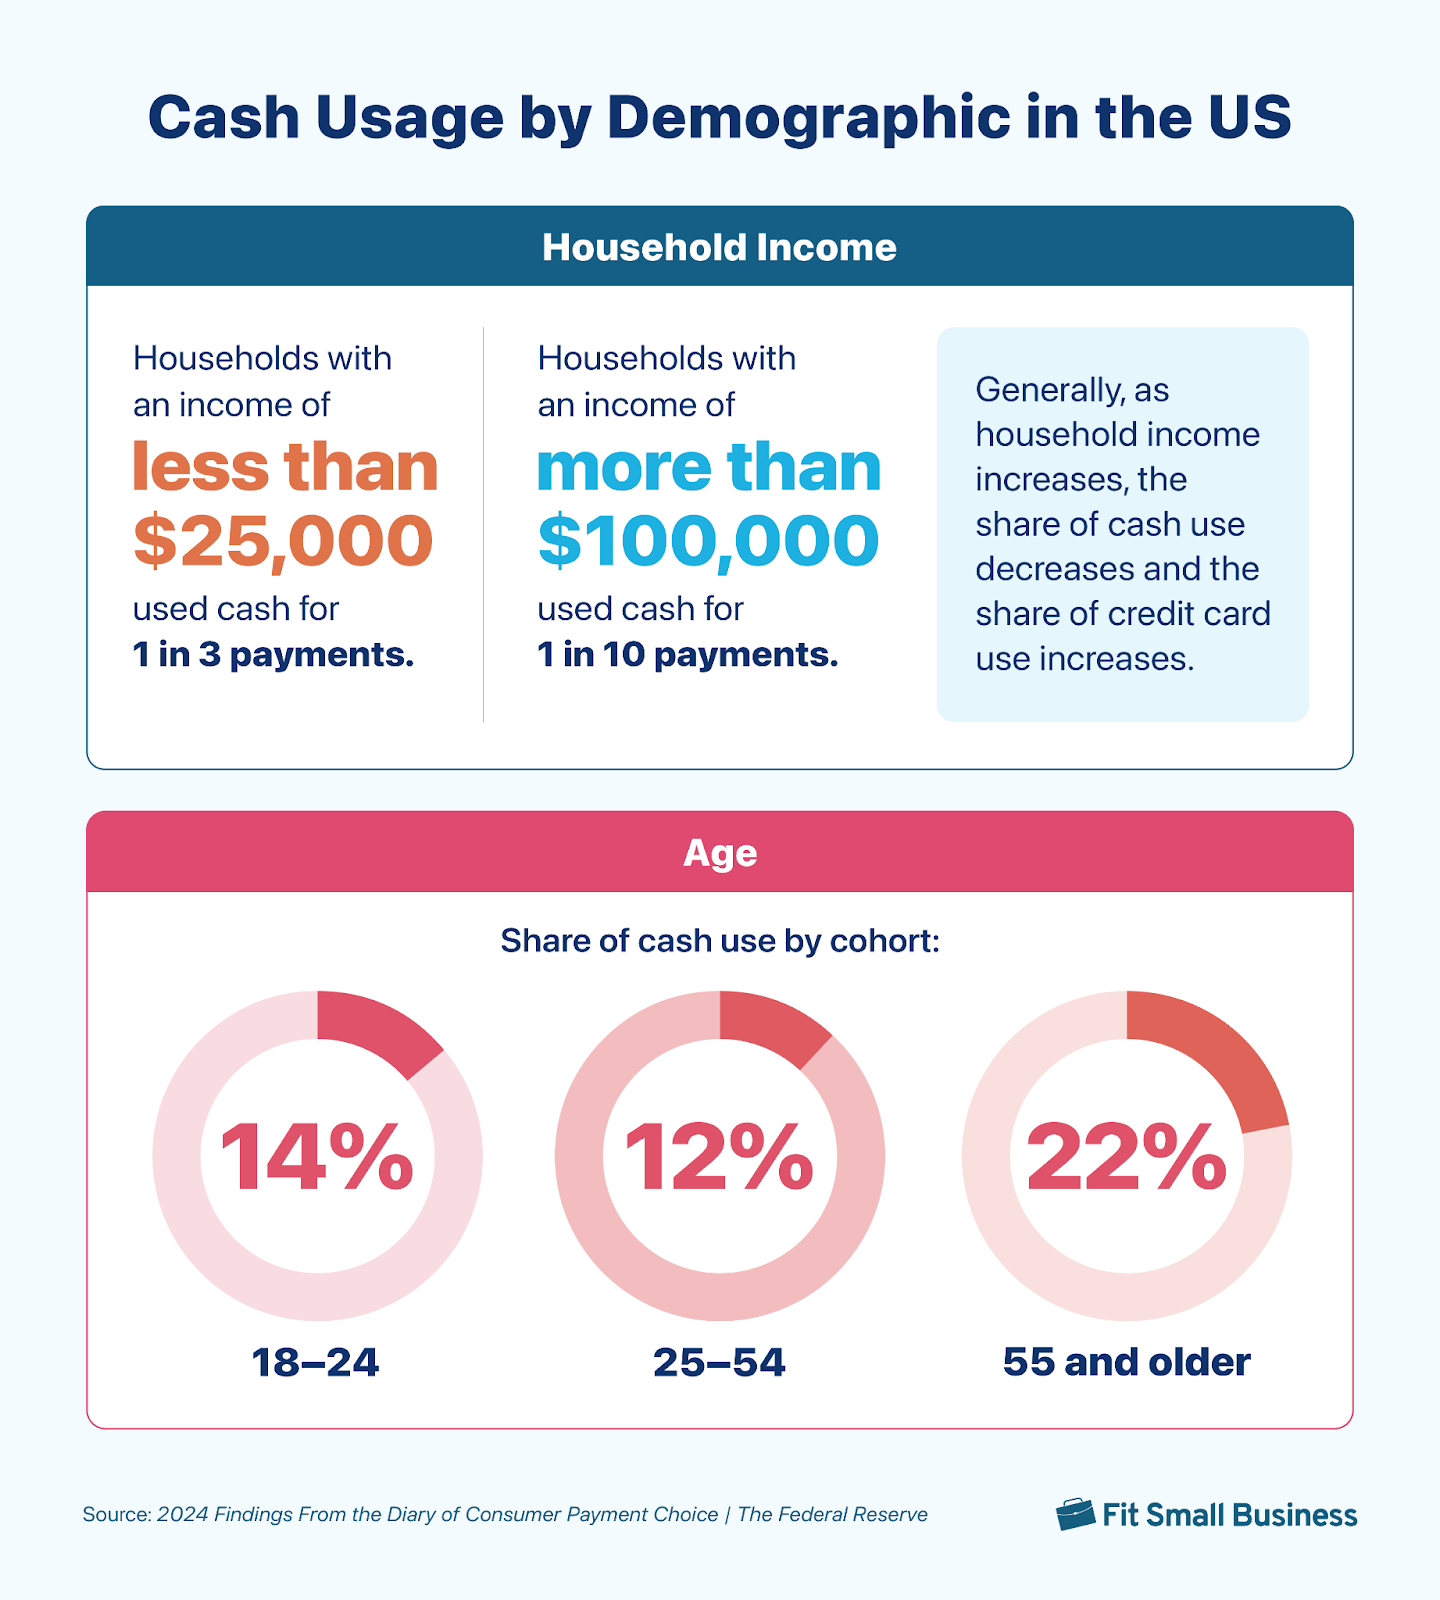
According to the latest Federal Reserve Study on consumer payment choice, Americans are heading to a cashless economy—but not as fast as was initially foreseen. In fact, the number of American shoppers who say all or almost all of their purchases are paid for with cash post-pandemic is on a steady decline—from 20% in 2021 to 18% in 2022 and 16% in 2023.
The same report also shows that cash usage varies widely based on demographics. Age, income, and ethnicity show a role in cash preferences. Adults over 55 and households with less than $25,000 annual income prefer to pay in cash.
6. 5% of consumers have stopped paying in cash for purchases
That said, cashless spending has become the norm for many consumers, with 5% of Americans in 2023 (up from 4% in 2022) stating that they no longer use cash for any type of purchase.
7. The mobile wallet market is forecasted to be worth more than $51 billion by 2030
According to estimates, the global mobile wallet market is anticipated to grow annually by 28.3% from 2023 through 2030—reaching $51.53 billion in value.
8. Retail and ecommerce own the largest market share for mobile payments
Compared to other segments like remote technology, banking, and hospitality, retail and ecommerce make up the most market share for the global mobile payment market. These segments accounted for 32% of all mobile wallet payments in 2022.
9. Digital wallet payments in 2023 reached $14 trillion
Worldpay’s latest global payments report showed that digital wallets were the overall most preferred payment method in 2023. On average, 50% of online consumers and 30% of customers paying in-store used their digital wallets to complete their purchases.
10. Buy now, pay later is growing 18% each year
According to buy now, pay later (BNPL) statistics, payments using this method grew 18% from 2022 to 2023. In 2023, BNPL payments claimed $316 billion, about 5% of global ecommerce spend. It’s predicted to grow at 9% CAGR through 2027.
In this age where the culture of convenience is evident in almost every aspect of a person’s life, the ease of making payments now plays a significant role in consumer behavior. With that said, it’s hard to ignore the role of smart devices in the latest digital payment trends.
What this means for merchants:
- Consumers are more inclined to try digital wallet payments for the first time compared to other payment methods that they have not used before
- Consider offering a digital wallet as a payment option over BNPL or cryptocurrency
11. Prepaid cards will be worth more than $1 trillion by the end of 2024
Per global data, the total transaction value of prepaid cards in 2024 will surpass $1 trillion. Prepaid cards include gift cards, reloadable stored value cards, payroll, business-to-consumer payments, and government benefits.
Retail Payment Stats
12. Cash payments will make up less than 10% of total POS transactions by 2026
According to one report, cash payments are on the decline—so much so that by 2026, they won’t even account for 10% of total point-of-sale (POS) transactions.
Another report notes that in 2023, cash use made up 16% of global POS spend at about $6 trillion, an 8% decrease compared to 2022. Cash is predicted to continue to decline by about 6% each year through 2027.
13. Credit cards make up 27% of POS payments
While many consumers are using less cash and more new payment options, credit and debit cards are still holding strong onto their market share. In fact, combined, credit and debit cards make up about half of all POS transaction value in 2023. More specifically, there were $10 trillion in credit card transactions, about 27% of global POS spend, and $8.3 trillion in debit card payments, about 23%.
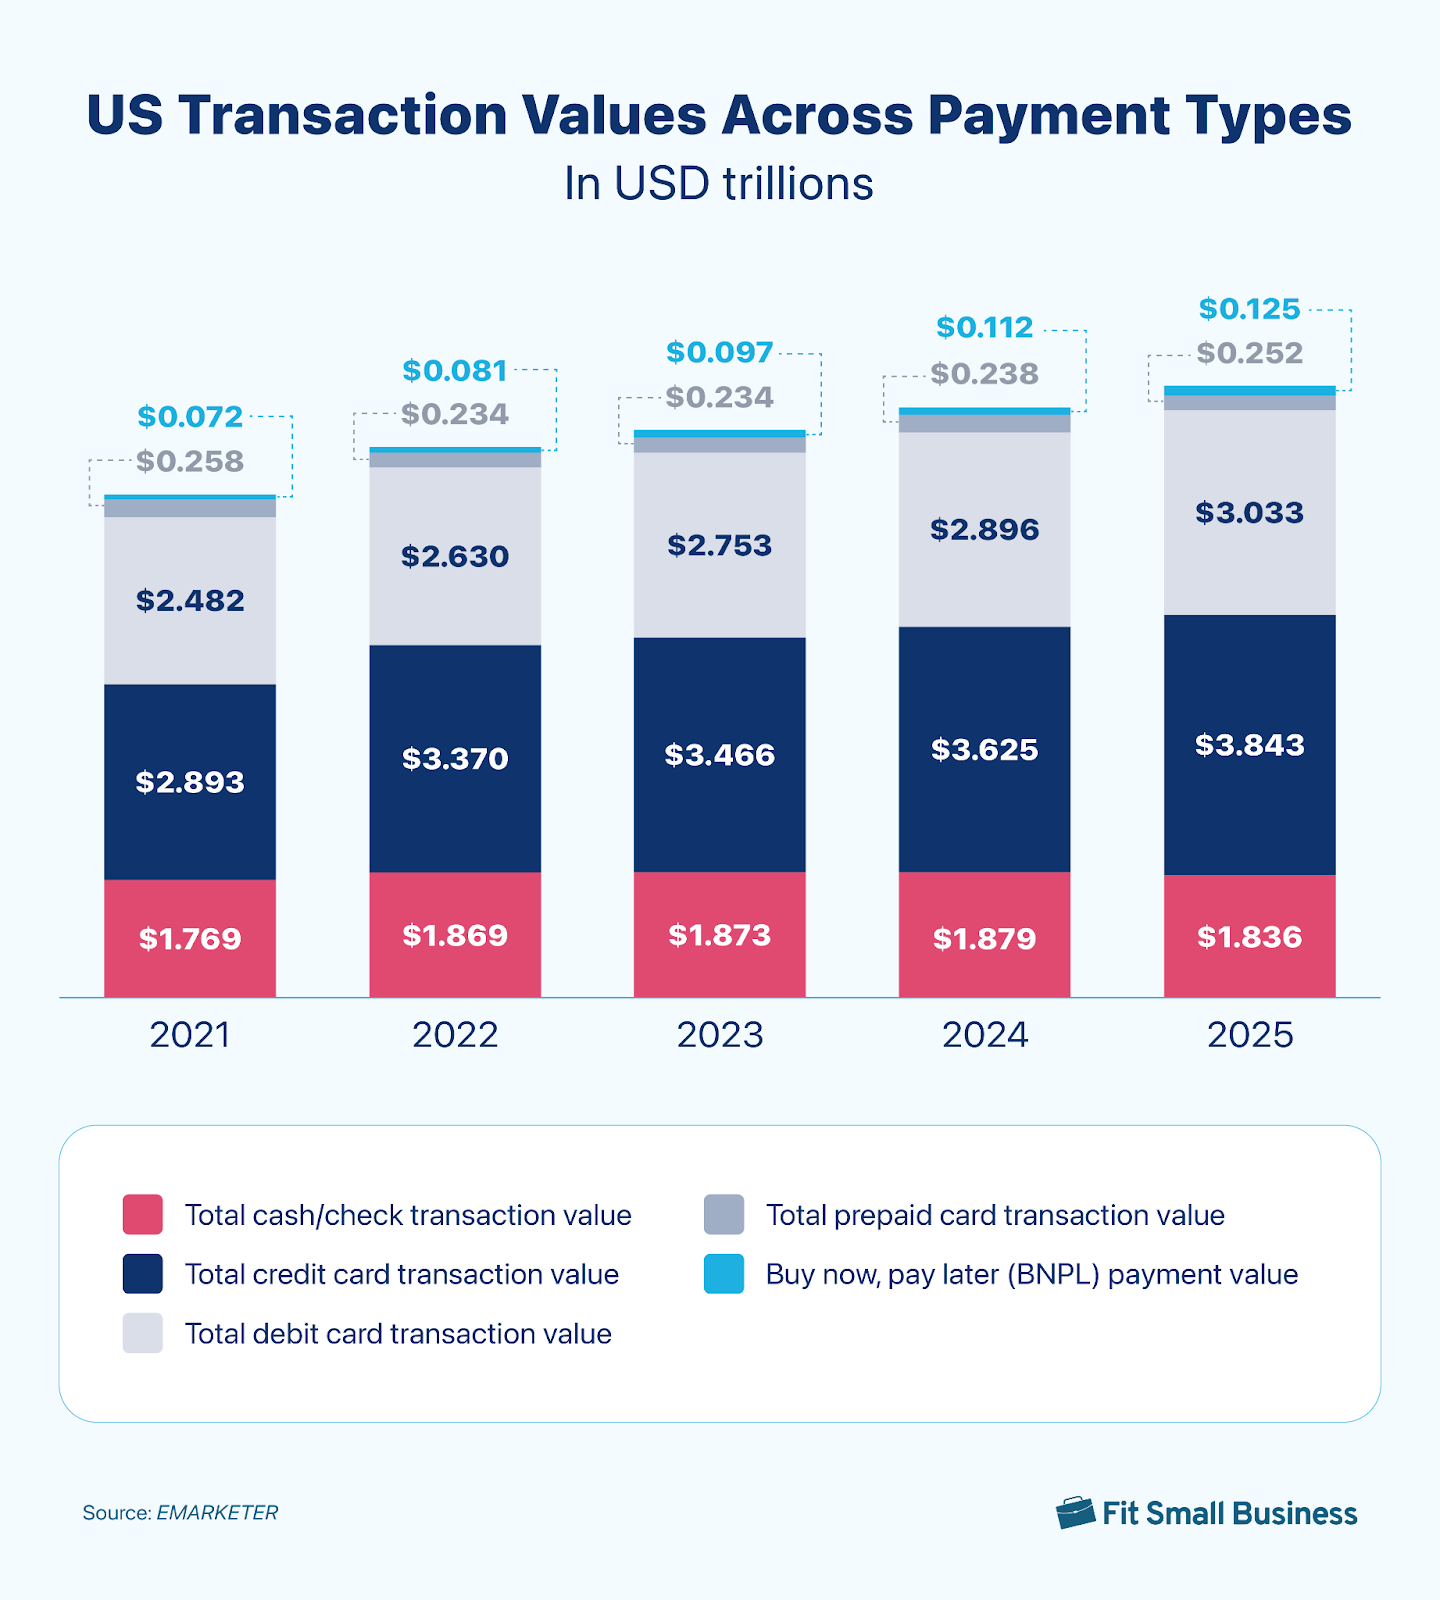
14. Credit card payments will surpass $3.8 trillion
According to forecasts, total credit card payments will amount to more than $3.8 trillion by 2025. They remain the most popular retail payment method in the US.
15. In-store digital wallet use is forecasted to grow 33% year-over-year
According to PYMNTS, 2024 is expected to see a 33% year-over-year increase in in-store digital wallet use in the US.
16. Digital wallets accounted for 30% of global POS payments
Even though credit and debit cards tend to reign supreme, digital wallets are the fastest-growing payment method, with a 16% increase year-over-year. In 2023, digital wallet POS transactions amounted to more than $10.8 trillion, making up 30% of global POS spend. By 2027, digital wallets are forecasted to be about $19.6 trillion in POS spending.
17. 79% of global in-store transactions were made via tap-to-pay contactless payments.
According to Visa, contactless payments are driving card-present transactions. The first quarter of 2024 saw 79% (a 5% growth from the last quarter of 2023) of in-store consumers using the tap-to-pay contactless method to pay with their credit card. Mastercard reported an 8% growth year over year for card-present transactions.
18. 35% of consumers have opted into BNPL
Consumer awareness and adoption of BNPL has grown over the last few years. Thirty-five percent of US consumers surveyed in 2023 have used BNPL, though this figure declined from 50% in 2022.
19. 58% of retailers offer some form of BNPL
Due to the increase in consumer demand, 58% of retailers who participated in a survey from Forrester and the National Retail Federation have already implemented at least one BNPL option in-store, with 38% of retailers coming out with their own installment financing options.
Frictionless, seamless, cash-free payment processing provides convenience—which is why digital payments are growing in popularity. This is not limited to payments but also encompasses other functionalities such as refunds, product recommendations, and information security.
In the US, consumers prefer digital shops (and would leave other shopping apps) to look for these features.
20. Only 2% of retailers offer Bitcoin or other crypto payment options
In the NRF 2022 State of Retail Payments report, only 2% of respondents said they’ve implemented Bitcoin or other crypto payments in their stores. Moreover, many retailers don’t expect their businesses to accept crypto in the next three to five years, citing a lack of consumer demand. Other reasons include regulatory uncertainty (59%), exchange rate volatility (42%), risk and complexity issues with Know Your Customer (KYC), and anti-money laundering (AML) (42%).
21. Cryptocurrency represented just 0.2% of total global ecommerce payments
Despite lots of buzz a few years ago, crypto isn’t making much headway when it comes to ecommerce payments. In fact, cryptocurrency payments totaled about $11 billion in 2023, just 0.2% of total global payments.
22. Reducing payment processing fees is a top priority for 36% of retailers
Mitigating fraud and reducing fees topped merchants’ payment priorities last year and have continued as priorities in 2023.
The Forrester/NRF report shows that reducing fees from payment gateways (36%) dominated in-store payment initiatives. Supporting omnichannel settings ranked second. Fraud mitigation ranked third on the list, with chargeback reduction also a crucial priority for retailers, ranking fourth.
23. Payment processing fees are a top challenge for 30% of retailers
Fees remained a pain point for most retailers last year, with 30% of them saying the costs of accepting payments (like processing and network fees) were a top challenge in the past 12 months. Another 21% said the same about chargebacks.
Ecommerce Payment Statistics
24. Ecommerce payments are anticipated to grow at more than twice the rate of POS payments
In 2023, global ecommerce payments exceeded $6.1 trillion, about 14.4% of the total market. And it’s predicted to grow 9% year-over-year through 2027 to represent 17%. That’s more than twice the rate of POS payments, which is forecasted to grow 4% annually for the same period of time.
25. Digital wallets accounted for 50% of global ecommerce payments
Regardless of whether online or in person, digital wallets are the fastest-growing payment option. When it comes to ecommerce payments, digital wallets actually represent half of all transactions.
26. Shipping fees and taxes are the top reasons shoppers abandon their carts
According to the latest cart abandonment study, extra fees like shipping and taxes are the main reason for cart abandonment. However, a majority also leave their carts because of the checkout process—they don’t want to create an account to check out (26%), they don’t trust the website with their credit card information (25%), checkout was too long or complicated (22%), or there are not enough payment options available at checkout 1(3%).
To help decrease abandonment rates and increase conversions, streamlining the checkout process and adding more payment options are essential. For example:
- Adding a BNPL payment option can help reduce sticker shock at checkout, as the amount customers pay at the point of purchase is much lower.
- Digital wallet payments and one-click checkout options mean shoppers don’t have to manually enter their card information or enter it at all.
- Creating an omnichannel payment platform means online shoppers who abandon their carts for fear of credit card theft have the option to complete their purchases in-store.
27. 78% of merchants accept digital wallet and contactless payments
Digital payments continue to be rolled out across ecommerce platforms, with Apple Pay and PayPal leading the stakes online: 78% and 74% of retailers already accept or have plans to implement those payment methods, respectively, on their websites. There’s also a significantly growing interest in Google Pay, which 25% of merchants say they also plan on implementing.
28. 9% of businesses accept Venmo, and 4% accept Zelle
Meanwhile, a smaller percentage of retailers currently accept P2P payments. Only 9% and 4% of retailers accept Venmo and Zelle payments, respectively, on their websites, and 15% and 13%, respectively, have plans to implement the two payment methods within the next 18 months.
29. 64% of consumers are likely to make an online payment via the manual entry of card details
Contactless payments have made accepting in-store payments faster and more convenient. Unfortunately, this convenience has not been brought online. With 64% of the respondents in the Mastercard New Payments Index (NPI) survey (from March to April 2022) saying they’re likely to make an online payment via the manual entry of card details over the next year, it is clearly time to have the benefits of tap-to-pay come to online clicks.
30. 70% of consumers have security concerns about one-click checkout
Enter the one-click checkout (OCC). This checkout option has slowly rolled out across popular ecommerce platforms in the past year. While there has been some resistance, with 70% of those surveyed expressing security concerns, payment providers are quick to explain that OCC is different from card on file (CoF), where retailers save consumers’ cards on their database.
With one-click checkouts, consumers’ payment details are stored securely in the payment providers’ gateway through tokenization, similar to how NFC (or contactless) payments are secured.
31. 4 out of 10 shoppers would consider using BNPL over their credit cards for high-ticket purchases
According to Insider Intelligence, at least 4 out of 10 shoppers would consider using BNPL over their credit cards for high-ticket purchases. The latest Digital Economy Payments report from PYMNTS revealed that the most frequent users of BNPL are consumers who earn between $50,000 to $100,000 annually.
32. Just under half of online merchants offer BNPL.
Meanwhile, nearly half of online merchants have started offering BNPL checkout options in their ecommerce platforms, with more merchants planning to accept at least one BNPL solution in their online store in the next 18 months.
33. 32% of shoppers want to buy through social media
The NRF 2022 State of Payments report shows that today’s consumers want to be able to pay for products across different devices, platforms, and channels. Retailers are stepping up to this challenge by implementing an optimized payment experience for smartphones (mobile commerce capabilities) and planning on accepting payments in conversational touchpoints (such as chatbots, SMS/mobile text messaging, and other third-party messaging platforms) and other innovative payment interfaces (like social commerce).
34. The embedded payments market is predicted to exceed $138 billion
Embedded payments are when consumers can pay for a purchase without leaving their current environment or platform, be it a website, social media channel, or mobile app. By 2026, the embedded payments market is expected to surpass $138 billion. And businesses are catching on. As many as 44% of businesses say embedded payments would be extremely important to them in 2024.
Restaurant Payment Statistics
35. The most frequent purchases involve the customer visiting a restaurant
A PYMNTS Digital Divide study in October 2022 revealed that ordering channels requiring customers to visit the restaurant, such as dine-in and pickup, remain the most popular despite all the delivery options.
While the study shows in-person dining options remain the most popular, there’s a noticeable demand for alternative ordering options, calling out restaurants to offer more choices to fit consumers’ lifestyles.
36. 40% of customers say online ordering or payment features could encourage them to place more orders
A PYMNTS and Paytronix collaboration survey among US adults who regularly order food from restaurants shows that some 40% of restaurant customers think online ordering or payment features could encourage them to place more restaurant orders. Among technology requests, online ordering is the most popular (41%). Features related to pickup, like fast lane in-store pickup (39%) and drive-thru pickup (38%), are also among the top in the list.
37. 51% of take-out and 20% of sit-down customers prefer restaurants with a self-order kiosk
Self-service kiosks, which come with remote (sometimes even off-site) ordering and payments, are among the rising innovations in restaurants. Restaurant merchants, however, are still unsure as to the soundness of self-service kiosks as an investment. Meanwhile, PYMNTS research shows that 51% of take-out and 20% of sit-down customers prefer restaurants with a self-order kiosk.
38. 65% of full-service restaurant patrons would pay using a tablet at the table
Being able to pay the check tableside using a tablet at a full-service restaurant is desirable to more than half (65%) of consumers. Another 60% say they’d use a tablet to place their order. These options tend to be more attractive to Gen Z, millennial, and Gen X consumers compared to baby boomers. While a majority of consumers say they’d use a tablet to pay tableside, less than half of boomers feel the same.
39. Most full-service restaurant patrons would pay using some sort of mobile option
According to the same survey, most full-service customers say they’re comfortable using a smartphone app to either place an order (63%) or pay (55%). Sixty-two percent of full-service customers would pay the check using contactless or mobile payment options and 57% would use a digital wallet (e.g., Apple Pay, Samsung Pay, Google Wallet, PayPal, Venmo).
While 59% of full-service customers say they’d pull up a menu on their smartphone using a QR code, fewer than half are comfortable using it to place an order (48%) or pay (46%). Baby boomers are the least likely to say they’d use QR codes at full-service restaurants.
40. The majority of limited-service restaurant diners are willing to use tech to order and pay
Among limited-service restaurant customers, 70% would use a smartphone app to order and 65% would use it to pay. Meanwhile, respondents claimed they were willing to use a self-service electronic kiosk for ordering (65%) and payment (63%). This is most common among younger generations. Limited-service customers would also use QR codes to access the menu (57%), place an order (52%), or pay their checks (48%).
41. 34% of restaurant operators plan to invest in smartphone apps
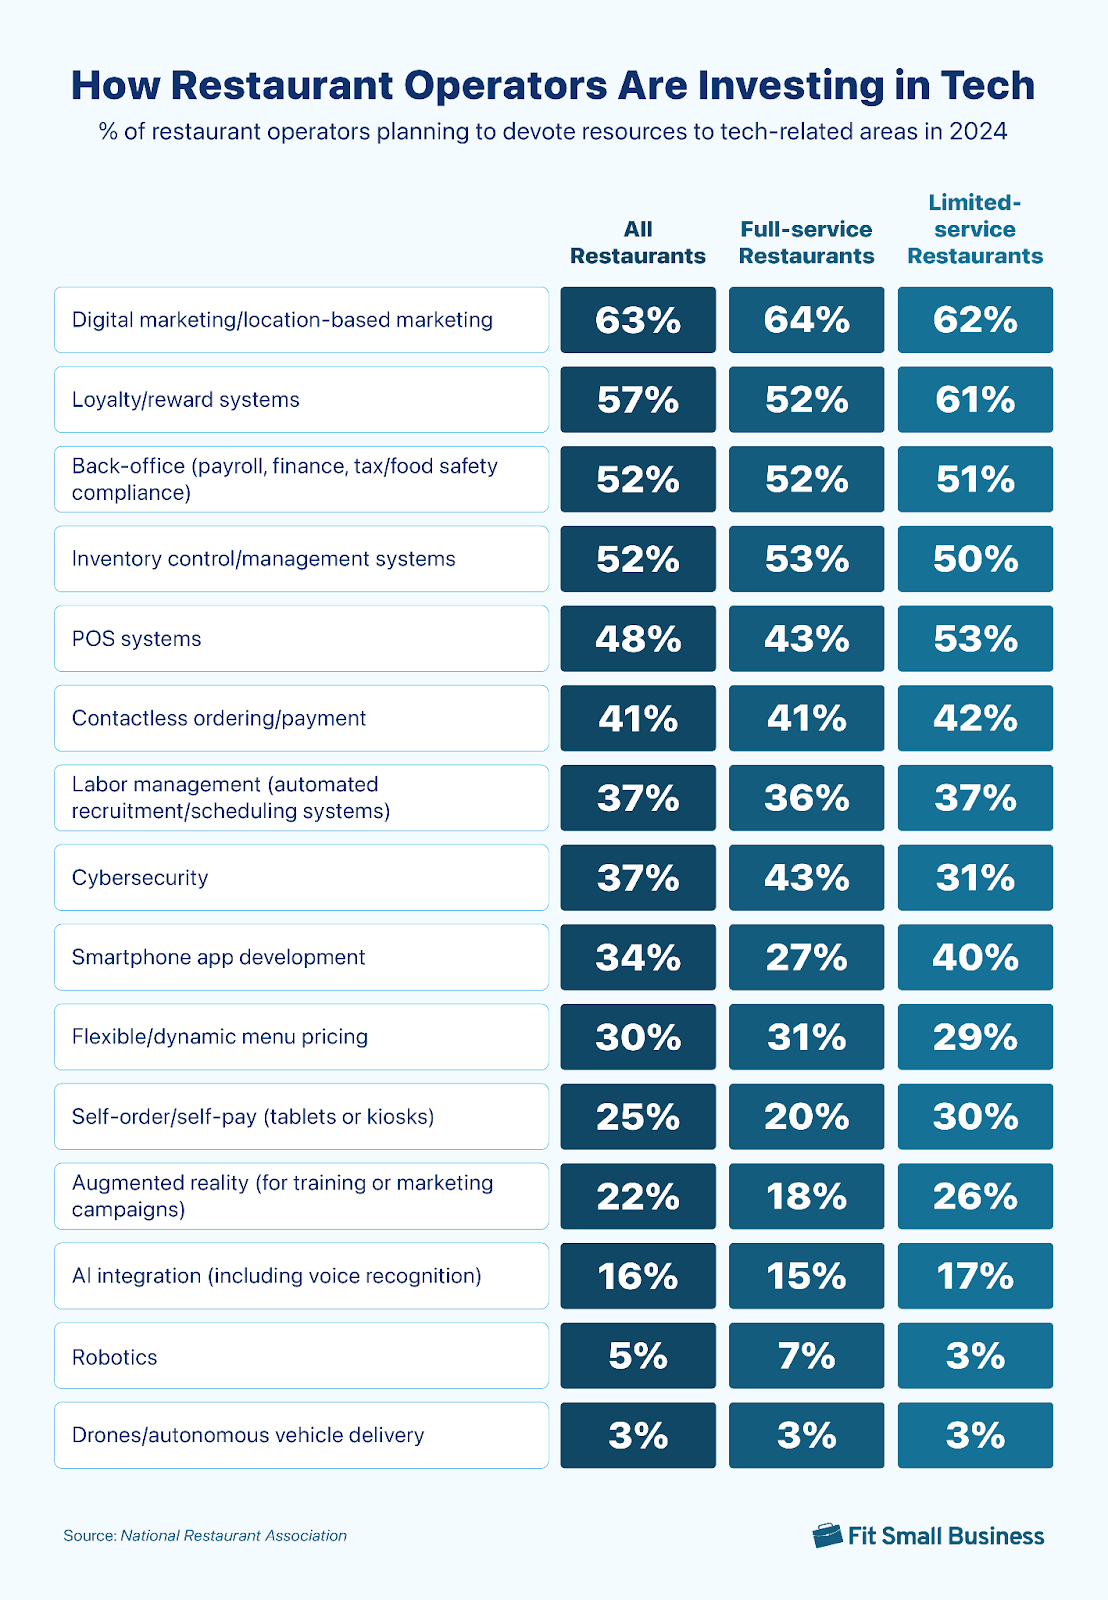
Consumers’ growing preference for dining tech is likewise shaping operators’ investment decisions. Most restaurants prioritize technology for digital or location-based marketing (63%), loyalty systems (57%), back-office functionality (52%), and inventory systems (52%).
Thirty-four percent of operators say they will invest in developing smartphone apps, and limited-service restaurants are more likely than full-service restaurants (40% vs 27%) to make plans.
Meanwhile, one in four restaurant operators are planning to invest in self-ordering/payment systems like tablets or kiosks. Forty-two percent of limited-service operators plan to invest in contactless or mobile pay technology this year.
42. 50% of restaurant customers prefer their server to process payment away from the table
According to data from Touch Bistro, exactly half of dine-in patrons prefer their servers to take and process payment away from the table. Another third would prefer the server to bring a handheld payment processing terminal to the table and do it there. Just 17% prefer to pay using self-checkout options via QR code at the table.
B2B Payment Statistics
43. B2B global transaction value will grow by 26% through 2027
According to market analysis, B2B global transaction value will grow by 26% between 2022 and 2027. By 2027, over $111 trillion in payments will be transacted globally, up from $88 trillion in 2022.
44. The B2B payments market is three times the size of the B2C payments market.
Despite being three times as large as the B2C payment market, B2B payment technology infrastructure and adoption rates drastically lag behind B2C payments. Many B2B businesses are still being paid through traditional methods.
45. 40% of all B2B payments are made by check
B2B payment methods are not as advanced as their B2C counterparts. Paper checks are easy to track, which complements the B2B accounting process characterized by consistent high-volume transactions and multiple checks and balances that result in longer approval and overall processing times. According to PYMNTS, 40% of all B2B payments are made through this method.
That said, 40% of B2B merchants are using paper checks less often. Another PYMNTS survey revealed an increase in the use of the following B2B payment methods in the last few years:
- Automated clearing house (ACH) 68%
- PayPal (64%)
- Credit cards (64%)
- Wire transfers (57%)
- Virtual cards (55%)
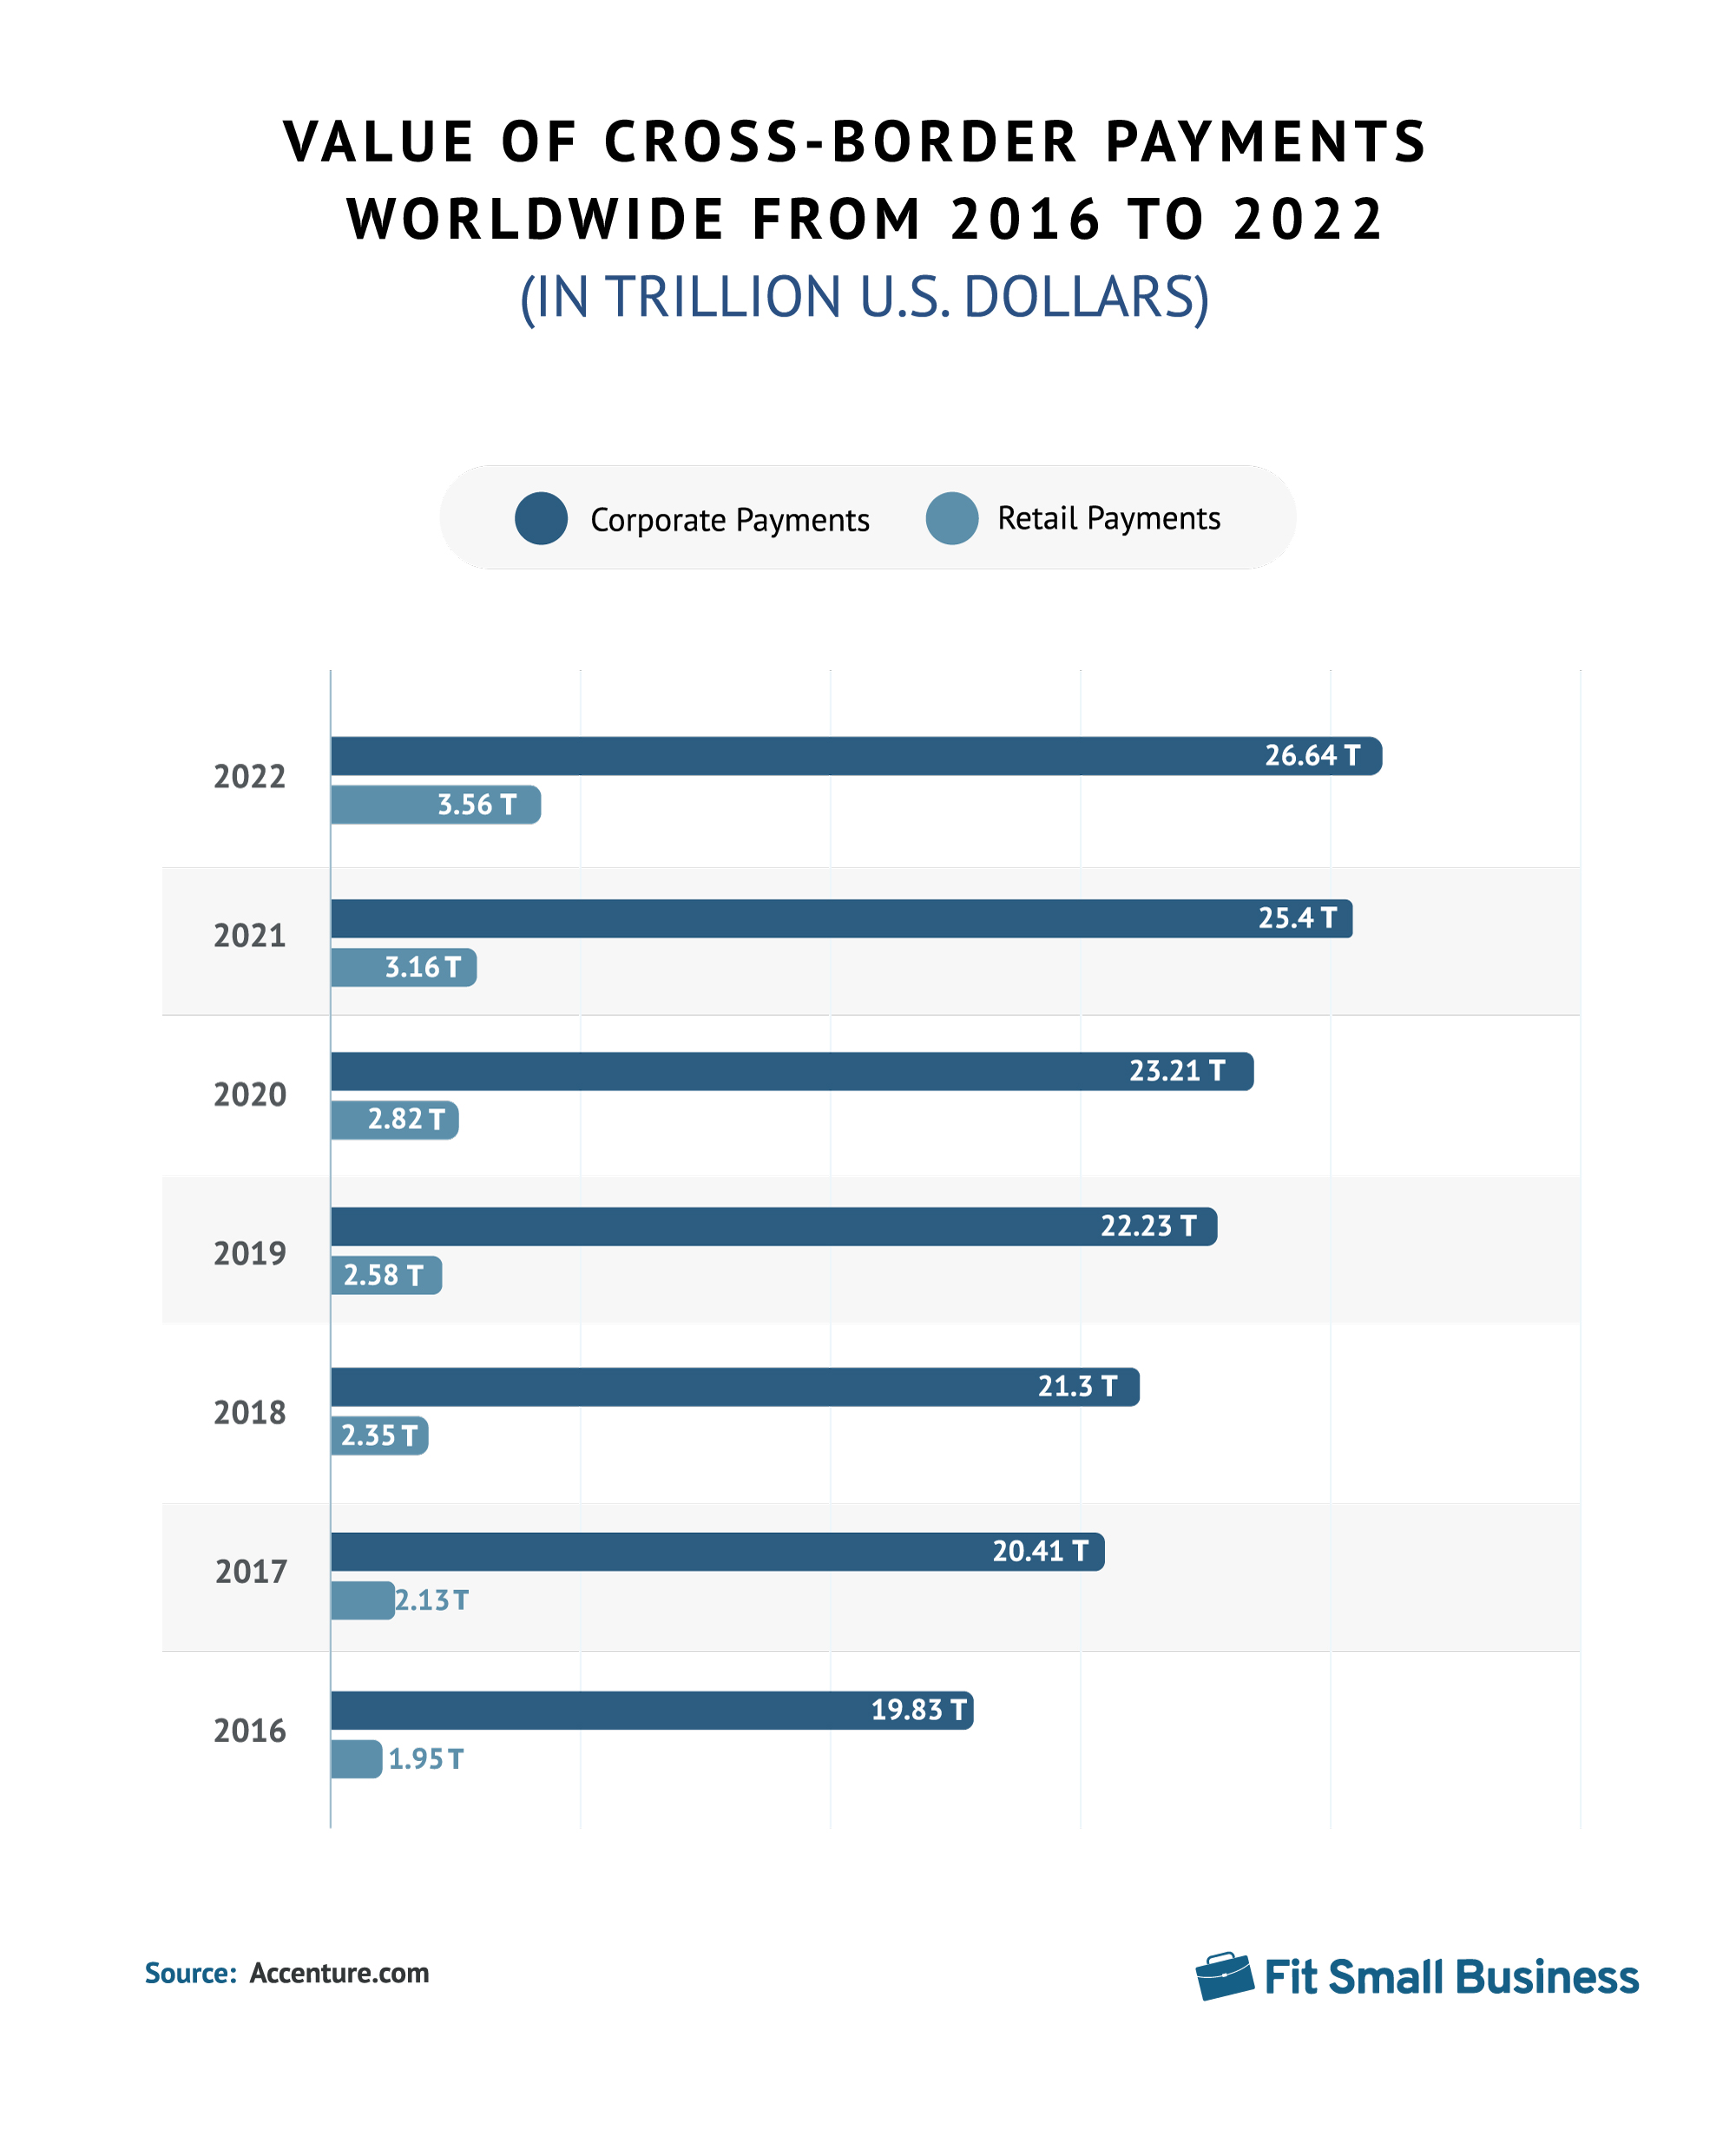
46. 68% of B2B businesses are potentially paying unnecessary cross-border fees

According to a Blue Snap report, 68% of B2B businesses are potentially paying unnecessary cross-border fees by processing payments from international customers in the country where their business is located rather than where the customer is located.
47. 48% of businesses estimate they’ve lost up to 10% of international revenue because payment processing vendors don’t offer the right options
Almost half (48%) of respondents estimate they’ve lost up to 10% of their international revenue because their payment processing vendors do not offer the right payment options. This is further confirmed by Flywire, as it said currency fluctuations and FX rate are the biggest challenges in global market expansions, with 88% saying cross-border payment collection impacts business growth.
48. It takes 55% longer to process cross-border payments than domestic payments
It takes businesses 55% longer to receive cross-border payments than domestic ones.
B2B cross-border payments should implement modern invoicing and billing solutions along with local card acquisition and support for local payments to mitigate revenue loss.
49. Account-to-account payments will increase 14% annually through 2027
Account-to-account (A2A) payments are payments that move directly from the customer’s account to the business’s account without any intermediaries. This type of payment has grown annually by 14% and will continue this trajectory through 2027.
50. The use of virtual cards is forecast to grow to $6.8 trillion by 2026
Visa predicts an increase in the use of virtual cards from $1.9 trillion in 2021 to $6.8 trillion by 2026. With virtual cards’ automated reconciliation and centralized reporting, B2B merchants will have better transparency for invoice settlements and improved management of working capital. It also removes the security risk associated with physical credit cards.
Frequently Asked Questions (FAQs)
These are some of the most common questions we encounter about payment stats.
Payment statistics are data points that relate to the payments industry as a whole. Payments happen in a variety of verticals, including retail, ecommerce, restaurants, business-to-business, peer-to-peer, banks and financial institutions, and more. Payment statistics reporting informs you about the state of the payments industry. This post highlights the latest payment statistics.
The US payments industry is $10.3 trillion in 2023, according to GlobalData. Read this post to learn more about the latest payment stats.
BIS stands for the Bank for International Settlements, often referred to as the central bank for central banks. BIS payments typically refer to financial transactions facilitated or regulated by the Bank for International Settlements.
These transactions can involve interbank transfers, settlements of international obligations, and other activities that contribute to the stability and efficiency of the global financial system. BIS helps facilitate cooperation among central banks and promote monetary and financial stability worldwide.
Bottom Line
Small businesses can appeal to customers and the changing digital payment trends by choosing a merchant account and point-of-sale (POS) system that enables contactless, digital wallets, and online payments. Preferences for these payment types are not a passing fad; contactless payments and frictionless transactions are here to stay.


