


In 2024, shopping cart abandonment statistics show that approximately 71.83% of online shopping carts are abandoned across the Americas, with a global abandonment rate of 73%. Carts are often abandoned before purchase due to extra costs, complicated checkouts, and account creation requirements.
We’ve gathered a list of 30 shopping cart abandonment statistics along with actionable tips and examples to help you set benchmarks and craft a buying experience that converts to sales. We also show how to calculate your store’s abandonment rate to see how it is performing against industry standards.
- Average Shopping Cart Abandonment Rates
- Reasons for Shopping Cart Abandonment
- Effects of Cart Abandonment
- Industry-specific Shopping Cart Abandonment Rates
- Mobile Cart Abandonment Statistics
- Abandoned Cart Email Statistics
- Cart Abandonment & Retargeted Ads
- Calculate Your Cart Abandonment Rate
- Ways to Prevent Shopping Cart Abandonment
- Frequently Asked Questions (FAQs)
- Bottom Line
Average Shopping Cart Abandonment Rates
Global shopping cart abandonment rates remain high, but the Americas have the lowest rate among regions. And if your business hasn’t leveraged abandoned cart recovery emails in your marketing strategies yet, you should.

1. The global shopping cart abandonment rate is 73%
Around the world, the Asia Pacific region (APAC) has the highest cart abandonment rate at 80.48%, followed by Europe, Middle East, and Africa (EMEA) at 73.31%, and the Americas at 71.83%. The same study averages the global rate at 73%. Baymard Institute collected 49 different studies on online shopping cart abandonment and averaged it at a similar 70.19%.
2. The average abandoned cart rate stays steady year-round
There isn’t much variation in terms of average abandonment rate by month. According to Dynamic Yield, the lowest abandonment rates happen in November and December—coinciding with holiday shopping—at around 70% to 71%. The abandonment rate picks up again during the post-holiday slump over the next few months; in 2024, it peaked in August.
While these metrics don’t represent statistical significance, it’s still important to consider gift-giving events like Black Friday or Cyber Monday that can contribute to lower abandonment rates and higher traffic volumes. This indicates consumers want to complete their purchases before the sales expire.
What You Can Do: During the holidays, add incentives to get shoppers to buy, such as guaranteed shipping or free gift wrapping. Extra touches can be the difference between an abandoned cart and a closed deal. See our Black Friday and Cyber Monday strategies for more tips.
3. The average cart abandonment flow email open rate is 50.50%
Abandoned cart flow emails are automations that target shoppers who have left items in their carts. According to Klaviyo, the open rate for abandoned cart flows is 50.50%—consistently driving high engagement across ecommerce industries.
What You Can Do: While you can manually create email campaigns, this data suggests that you can never go wrong with even a basic abandoned cart flow.
Reasons for Shopping Cart Abandonment
Shoppers’ main reason for abandoning a cart is a lack of convenience. Complicated or lengthy checkout processes, being required to create an account and fill in lots of details, and slow website loading times all make a shopper likely to quit the purchase entirely. Don’t give potential buyers any reason not to proceed with their purchases. Optimize the checkout process and make it easy for them to shop.

4. Many carts are abandoned by browsers who aren’t ready to buy
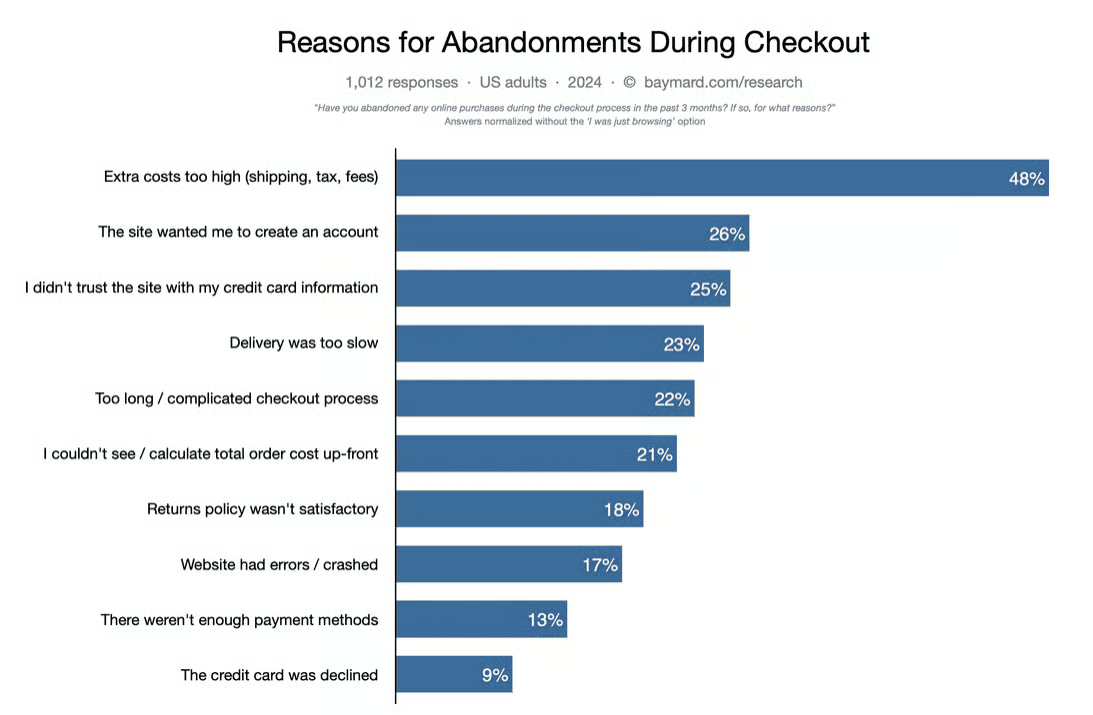
The latest study by Baymard Institute shows that 48% of abandoned carts are due to customers just browsing or not being ready to buy. Other reasons for cart abandonment include extra costs like fees and taxes, slow delivery times, complicated checkout processes, and lack of transparency with total order costs.
What You Can Do: Make tweaks to convert browsers into buyers. Offer an abundance of payment options, provide saved customer and payment information, and get one-click checkout to make it easy for them to finish checking out your products.
5. Nearly half of customers say unexpected costs are the reason for shopping cart abandonment
When you segment online shoppers who are not ready to buy, 48% cited extra costs as their primary reason for abandoning shopping carts per Baymard. XP2 data found that the figure reaches 55%—with more than half of shoppers abandoning their carts due to unexpected fees, which include shipping costs.
Free shipping significantly influences customers’ buying behaviors. According to Shopify’s Future of Retail 2023 report, people spend over $3 more on the median average item, and buy over $22 more on their median order, if the shipping is free. Easyship also notes that if a business offers free shipping, its conversion rates can jump by as much as 30%.
What You Can Do: It can be challenging for small businesses to absorb shipping costs even if offering free shipping is undoubtedly doable. A workaround here is to bundle the shipping cost into the retail product price. And, if you can’t lower costs, fully disclose them on your product pages so you would not run the risk of abandoned shopping carts further.
6. Three of the top five reasons for cart abandonment center around convenience
Customers are looking for convenience when shopping online. It’s not surprising that in Baymard’s 2024 list of reasons customers abandon their carts, three convenience-related issues made the top five—long delivery timeframes, a complicated checkout process, and being required to create an account. According to XP2, 21% of online shoppers will completely abandon a site if it has a complicated or lengthy checkout process.
What You Can Do: Make the buying process easy and seamless by ensuring your online store is fast, using fewer checkout fields, and offering saved information and guest checkout options with multiple payment methods.
Related:
- In-house Fulfillment vs Outsourced Fulfillment: Ultimate Guide
- What Is Order Fulfillment?
- Fulfillment Centers: An Ultimate Guide for Small Businesses
- Order Fulfillment Costs: Fulfillment Services Pricing Explained
- Best Order Fulfillment Companies for Small Businesses
7. The average checkout flow has about 12 form fields—about half as many fields as recommended
About 22% of shoppers have abandoned a cart because the checkout process is too long or convoluted. The average checkout flow is 5.1 steps and has 11.3 form elements—that’s a whole lot of data input. According to Baymard, the ideal checkout has seven to eight form fields.
What You Can Do: When building your checkout flow, include only what’s needed to complete the transaction. It’s also a good idea to use an ecommerce platform like Shopify that allows for customer profiles with saved payment information and provides a one-click checkout option to make future checkouts faster and easier.
8. A quarter of shoppers abandon carts because of issues with site security
Aside from website issues, 25% of shoppers abandon their shopping carts if they don’t trust the ecommerce platform’s security in safeguarding their credit card information. A major red flag for them is a missing SSL certificate on an online store. However, missing images, no user reviews, and an outdated layout design also raise suspicion. Another survey found that 17% of shoppers cite “lack of trust” as the reason for abandoning their cart, mostly fearing credit card theft and similar security-related concerns.
What You Can Do:
- Increase trust with shoppers by displaying your security seals prominently on your homepage and product pages. Add product reviews, link user-generated content (social proof), and display your business contact information (such as an email, phone number, and location).
- Implement our suggested best practices on ecommerce payment security and check your online store checks off each list to be PCI-compliant.
9. Nealy 20% of shoppers don’t proceed with their checkouts because of unsatisfactory return policies
A generous returns policy is important for online shoppers. About 18% don’t finish their online purchases if a return policy isn’t clearly displayed on an online store or is unsatisfactory. However, up to 66% of shoppers say they would spend more with a generous return policy.
What You Can Do:
- Learn how to write a return policy for your ecommerce business and know the best practices for returns management.
- Calculate your ecommerce return rate to strategize your reverse logistics processes.
10. More than 20% of online shoppers dislike unclear pricing
Unclear pricing or not being able to see the total purchase cost upfront also leads to shopping cart abandonment, with 21% of shoppers saying that they likely won’t finalize their purchase if they don’t see the full product price, including shipping and other fees, before checkout.
What You Can Do: Transparency matters to consumers, and that especially applies to seeing total costs when they are shopping. Rather than luring them in with misleading prices or incomplete information, be honest about what they’ll have to pay upfront—ideally right from your product pages.
11. The lack of a variety of payment options can lead to higher cart abandonment rates
Payment methods expanded in recent years, especially during the COVID-19 pandemic, to include more options for shoppers such as buy now, pay later (BNPL). According to Baymard Institute, approximately 13% of shoppers abandon their carts when they see that their preferred payment method isn’t offered during online checkout.
Digital wallets have become increasingly popular, and usage of this payment method in the US jumped to 62% in 2023. More consumers are paying via mobile wallets and consumer financing options than ever before.
What You Can Do:
- Offer a variety of payment options: credit cards, digital wallets, and even cryptocurrency. (See also: Stripe vs Square vs PayPal: Which Is Best for You?)
- Buy now, pay later payment options have increased in popularity—its user base in the US is set to exceed 94 million in 2024, and 100 million by 2026. Learn how to accept customer financing.
Effects of Cart Abandonment
Cart abandonment results in lost sales and revenue for businesses—billions of dollars’ worth, in fact. And what shoppers do after they abandon carts can be unpredictable. However, there is something businesses can do to minimize the damage: send out cart abandonment recovery emails to coax shoppers back to completing their purchases. The statistics below provide more detail.
12. Ecommerce brands lose $18 billion in sales due to cart abandonment
Although slightly dated, a frequently referenced stat from Forrester Research says that shopping cart abandonment causes online businesses to lose as much as $18 billion in yearly sales revenue, with the loss estimated to reach up to $4 trillion worth of merchandise in succeeding years.
13. 26% of shoppers buy the same product from a competitor after cart abandonment
According to a survey from Royal Mail in 2020, a quarter of shoppers usually purchase the same item with a different online retailer when they abandon their carts from an online store.
14. About 30% of online shoppers purchase the same product at a later date after cart abandonment
Good news: nearly a third of online shoppers come back to purchase what was in their abandoned carts at a later date. The catch is ensuring that they come back sooner. Cart recovery emails increase the chances of these shoppers converting.
Industry-specific Shopping Cart Abandonment Rates
Cart abandonment rates vary across industries; knowing which industries perform well (and poorly) for cart abandonment can help guide your retention and conversion strategies.
15. The luxury & jewelry market segment has the highest shopping cart abandonment rates
Dynamic Yield’s figures over the last 12 months put the luxury and jewelry segment industry at the top of the list for the highest cart abandonment rate. It hovers at around 81.47%. If your small business deals in these products and you offer ecommerce services for buyers, be aware of your vulnerabilities in this area and take steps to mitigate them.
16. The travel industry also suffers from high abandonment rates
According to Statista, cart abandonment rates are also high for websites offering cruise and ferry services (98%). Online travel bookers are more likely to shop around for deals and delay their purchase for the optimal time to book.
What You Can Do: Consider integrating third-party booking tools onto your website to make it easier for users to check out. You might also consider some sort of email capture so you can build and nurture relationships and stay top of mind when customers are ready to commit.
17. Pet care services have the lowest average shopping cart abandonment rate at just over 56%
Of the industry categories evaluated by Dynamic Yield, pet care & veterinary services, with a 56.58% cart abandonment rate, performed the best.
Mobile Cart Abandonment Statistics
Mobile commerce is the future of ecommerce, and ensuring your online store is mobile-ready is crucial to ensure abandonment rates stay low. Consumer doubts about security hound mobile shopping so instilling trust is a core principle of good ecommerce site design—make sure it translates to mobile, too!
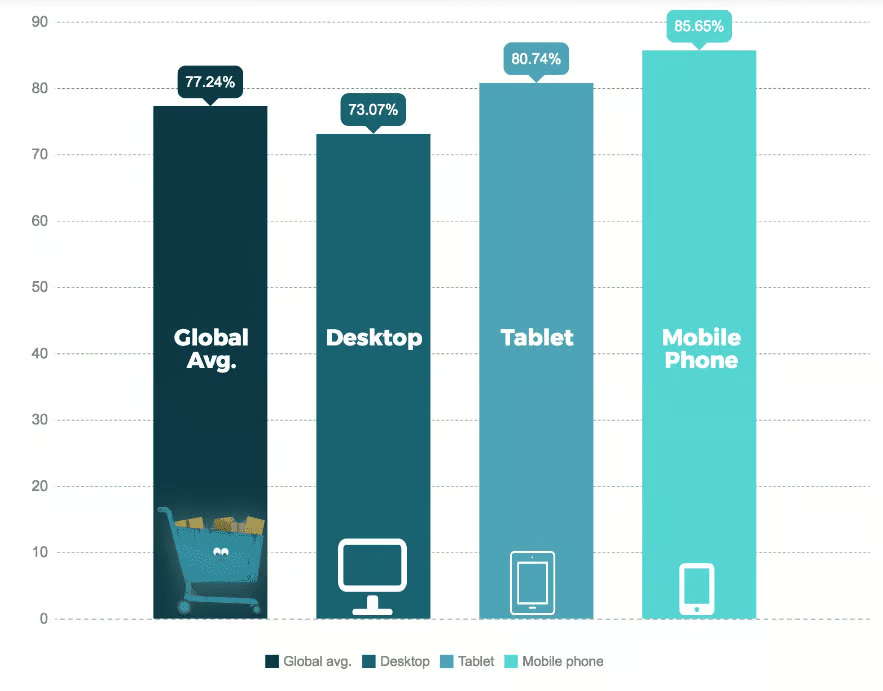
18. Most shopping carts are abandoned on mobile phones
An analysis from Barilliance found that mobile’s average cart abandonment rate came in at 85.65%. Desktops performed the best in terms of cart abandonment, with about 73% of transactions abandoned.
19. Mobile sales now make up the majority of ecommerce
Mobile devices have seen a giant leap in sales in recent years. In 2023, mobile sales made up 60% of all ecommerce revenue.
Though mobile sales have overtaken desktop as the leader in ecommerce revenue, mobile still lags behind desktop in conversion rates and average order value.
20. Mobile users won’t download retail apps due to data security concerns
Mobile retail apps were created to provide convenience to consumers who prefer shopping on their smartphones. However, security concerns, particularly around data privacy, make consumers wary. Some 57% of respondents in a 2021 Wyng report said they refused to download ecommerce apps to avoid sharing personal data.
Abandoned Cart Email Statistics
Those emails you send to remind customers about what’s in their carts? They work. Abandoned cart emails have great open rates, click-through rates, AND conversion rates (read: sales).
21. Cart abandonment emails have a 45% open rate
Of all cart abandonment emails sent, about 45% are opened. Half of the users who open a cart abandonment email will engage, and 21% will click through. Meanwhile, about half of the click-throughs result in a purchase. According to Klaviyo benchmark data, the average revenue per recipient is $3.65.
Keep these statistics in mind when building your automated emails and sequences. Make the copy crystal clear, and always include an easy-to-see call to action (CTA) so users know exactly how and where to click to get one step closer to making a purchase.
22. The average order value of recovery email conversions is higher than initial purchases
A 2024 report from ConvertCart reveals that when customers make purchases as a result of opening and acting on recovery emails, their average order value is 58% higher than it would have been previously.
What You Can Do: Maximize this AOV boost by crafting emails with strong subject lines, testimonials from satisfied buyers, and other incentives.
23. Half of shoppers who open a cart abandonment email complete their purchase
When an online shopper starts choosing items to purchase but then abandons their cart, the business may decide to send them a cart abandonment email. This tactic is designed to recapture the customer’s attention and encourage them to complete their purchase. According to Moosend, half of consumers who open these emails actually do end up buying. If you’re aiming to reduce the lost revenue from cart abandonment, investing in these recovery emails is a good idea.
24. Nearly half of product abandonment emails get opened
According to a Moosend survey, consumers open cart abandonment recovery emails at a rate of 40% to 45%. The same survey found that people clicked on about half of such emails, and around half of the people who clicked ended up making a purchase. These numbers suggest that incorporating recovery emails, as well as optimizing them for click-throughs and conversions, is well worth the time and effort.
25. Three abandoned cart emails is the sweet spot
Klaviyo analyzed abandoned cart email sequences to see how many emails businesses should include in a sequence. It found that three abandoned cart emails generated the most revenue, with one being a simple reminder, a second offering a discount, and a final one asking for feedback or making product recommendations.
26. Descriptive abandoned cart email subject lines generate more opens
A subject line that reminds the recipient they left items behind in their virtual shopping cart tends to perform better than those with clever or less specific subject lines. Personalized subject lines that include the consumer’s name and purchase details are a good place to start.
Cart Abandonment & Retargeted Ads
Retargeting refers to sending advertisements to consumers who previously visited your ecommerce site, but did not buy anything. It can also refer to sending advertisements to consumers based on their previous actions online. Retargeting is an effective way to counteract cart abandonment; significant percentages of consumers who see retargeted ads end up returning to an ecommerce site, and even buying something.
27. Over a quarter of customers return to a site because of retargeting
Retargeting can lift ad engagement rates significantly (several sources say up to 400%), so be bold. It can even convince customers to return to a website; Invesp found that 26% of customers will return to a site if they see retargeting ads. If customers return to a website and look around, this opens the door to them making new or additional purchases.
28. Personalized retargeted ads can generate 1,300% ROI
Brands that personalize their retargeted ads based on consumer behavior can see very strong return on investment (ROI) in their campaigns (one oft-cited case study of luxury watch retailer Watchfinder showed a 1,300% ROI).
This means you should consider sending retargeted ads that showcase the same products that customers previously added to their shopping carts but failed to buy. Statistics show it is more likely to turn into sales compared to displaying a generic retargeted ad that just promotes your company.
29. 70% of website visitors are likely to convert when retargeted with display ads
Consumers are 70% more likely to convert because of retargeting. Facebook and the Google Display Network are recommended retargeting platforms because of their massive reach. Facebook has over 3 billion, and the Google Display Network reaches a huge 90% of all internet users.
30. Facebook ads provide a >8% average conversion rate in leads campaigns
Facebook is one of the most effective retargeting platforms. Shoppers who spend more time engaging with your business on Facebook will be more likely to purchase. According to Wordstream, the average conversion rate in Facebook ads for leads campaigns is 8.78%.
This illustrates why ecommerce businesses should make an effort to become more active on social media. Posting pictures of new products and providing updates that keep prospects and customers interested are great ways to start.
Calculate Your Cart Abandonment Rate
Now that you have read all the numbers that support the importance of abandoned cart recovery, it’s time to find out your cart abandonment rate. With that knowledge, you can precisely know how your store is performing and address ways to improve conversion rates.
Cart Abandonment rate = [1 − (purchases within X time ÷ carts created within X time)] × 100
To know your cart abandonment rate, get the total number of completed purchases that have occurred over a fixed period of time and divide it by the number of shopping carts created within the same period. Subtract the result from 1, and multiply the result by 100 to calculate cart abandonment rate.
Let’s say, in a span of one month 300 people made purchases while 950 carts were created, your cart abandonment rate would be at 68%.
[1 − (300 ÷ 950)] × 100 = 68%
A good rule of thumb is to keep your cart abandonment rate below the industry standard. If the average rate is at 70%, for example, your 68% is within the norm, and you can consider your store doing pretty well. However, remember that you can still proactively take measures to reduce your abandonment rates further, and we will discuss strategies to do that in the next section.
Ways to Prevent Shopping Cart Abandonment
Shopping cart abandonment continues to pose significant challenges for online businesses.
While we’ve introduced you to the data that affects this consumer behavior, giving actionable tips on preventing cart abandonment is better. Here are some ways you can prevent cart abandonment from happening in your online store.
Offer Free Shipping
Since 48% of online shoppers cite extra cost as their top reason for abandoning carts, offering free shipping can help improve conversion. Another thing you can do is to make sure that there are no hidden costs that customers will only see at the point of payment.
Have a Guest Checkout
Allowing for guest checkout is a quick way to improve your conversion rate. Remember that 24% of online shoppers abandon their carts because they are forced to create an account.
Perform Email Recovery & Ad Retargeting
Email and ad retargeting are the best solutions for recovering lost sales from cart abandonment. They leverage customer information to create strategies to reach out and lead customers back to your site to finalize their purchases.
Personalize Your Cart Abandonment Emails
Personalization can be as simple as using the shopper’s name in the subject line and email copy. You can also take advantage of information like birthdays, location, and even when you send the email to improve personalization. These small changes have proven to create a significant impact on recovering lost sales. People tend to buy more if they can connect with the brand or product more personally.
Examples of compelling subject lines for cart abandonment emails
Short and straightforward subject lines are the most effective:
- “15% off purchase”
- “Cart left”
- “$20 off cart”
- “Items left”
- “Still shopping?”
The most common characteristics these subject lines share are that they’re short, simple, and provoke curiosity from their recipients. With these results in mind, ecommerce business owners should consider implementing this strategy into their email campaigns.
Improve the Mobile Experience
One way to lower cart abandonment rates is to pay special attention to the mobile experience. This includes everything from researching and browsing through purchasing. You can also speed up the mobile purchasing experience by offering one-click checkout options with Apple Pay, Google Pay, Fast, or Shop Pay. Most major ecommerce platforms, including Shopify, provide options for speedy checkout in addition to site templates and themes that are optimized for mobile devices.
Frequently Asked Questions (FAQs)
Click through the sections below to learn more behind common questions on cart abandonment.
What is the average shopping cart abandonment rate?
The average shopping cart abandonment rate globally is 73%.
What is a good shopping cart abandonment rate?
A good shopping cart abandonment rate is below 70%. The lower the rate, the better.
How can I salvage things if a customer abandons their cart?
One of the most powerful things you can do is send a cart abandonment reminder email. Half of shoppers who open a cart abandonment email end up completing their purchase.
Why is cart abandonment rate high?
According to industry reports, cart abandonment rates remain high because almost half of consumers are just not ready to buy or just browsing. However, for those that have the intent to buy, extra/hidden fees, long delivery timeframes, complicated checkout processes, the need to create a customer account, and site security issues are the majority of the reasons why shoppers abandon their carts.
Bottom Line
Simply put, ecommerce websites that fail to convert visitors into customers will not earn any money. Therefore, it is crucial to understand what discourages your prospects from completing a sale. Consider the shopping cart abandonment statistics we discussed in the article when coming up with your online sales strategy.
Want to learn more about shoppers’ online buying habits? Read our online shopping statistics and payment statistics for small businesses.