

Nearly 60% of consumers now prefer to shop online — and that shift shows no sign of slowing down.
In 2025, the online shopping landscape is defined by speed, convenience, and technology. Mobile wallets account for half of global ecommerce transactions, voice shopping is projected to hit $81.8 billion, and social platforms like TikTok and Instagram are becoming full-fledged marketplaces. At the same time, economic factors — like inflation and tariffs — are pushing shoppers to hunt for value, shift loyalty, and even explore recommerce.
As an ecommerce merchant and online store owner, online shopping habits aren’t just something to watch — they’re something to act on. From mobile-first browsing and fast, free shipping to AI-powered recommendations and social media checkouts, shopper expectations have changed across the board. And with tighter budgets shaping how people spend, it’s more important than ever to stay ahead of these trends.
In this guide, I’ve pulled together 98 key online shopping statistics every retailer should know in 2025. These numbers don’t just paint a picture of where online shopping is heading — they offer real, actionable insights to help you grow your business, connect with your customers, and increase sales.
- Overview
- Internet shopping statistics: sales and revenue
- Demographic stats of online shopping
- Online shopping consumer behavior
- Online shopping technologies
- Social shopping (social commerce)
- Fulfillment and shipping
- Online shopping reverse logistics (returns)
- Online shopping on Amazon and third-party marketplaces
- Holiday online shopping and seasonal spikes
- Consumer spending trends amidst economic pressures
- Frequently asked questions (FAQs)
- Bottom line
Overview
We’ve gathered 98 online shopping statistics, along with their key takeaways, broken into 10 categories:
- Global and US sales and revenue
- Demographics
- Consumer behavior
- Technologies
- Social shopping
- Fulfillment and shipping
- Reverse logistics (returns)
- Third-party marketplaces
- Holiday shopping
- Consumer spending trends — inflation, tariffs, and economic pressures
Internet shopping statistics: sales and revenue
Ecommerce continues to see steady growth in both sales and adoption globally and in the US. It is safe to say that digital commerce is now central to retail.
1. US ecommerce sales grew 7.5% in 2024
According to Digital Commerce 360’s 2025 State of American Ecommerce Report, US ecommerce sales reached $1.1 trillion last year, representing a 7.5% year-over-year (YoY) growth.
This year, Digital Commerce 360 forecasts it will experience another 7.7% increase YoY and hit $1.2 trillion.
2. US ecommerce sales reached about $300.2 billion in the first quarter of 2025
Based on the Census Bureau of the Department of Commerce’s report, US retail e-commerce sales for the first quarter of 2025 was $300.2 billion, virtually unchanged (±0.7%) from the fourth quarter of 2024, but signifies a 6.1% increase from the first quarter of 2024. It accounted for 16.2% of total retail sales for the first quarter of 2025.
3. In 2024, global ecommerce sales reached $6 trillion
Global retail ecommerce sales reached an estimated $6 trillion last year. It is projected to experience a 31% growth in the coming years, reaching $8 trillion by 2028.
4. There are 273.49 million online shoppers in the US
Research shows there were 273.49 million online shoppers in the US in 2024. It is forecast to continuously increase to 333.5 million users by 2029 — representing a 21.9% growth.
5. Clothing is the most popular ecommerce category in the US
Clothing is the most popular ecommerce category in the US, with 43% having bought from the category in the past year. Shoes came second at 33%.
6. Nearly 60% of consumers prefer to shop online
The latest commerce report from GWI shows that 59% of global consumers prefer to shop online rather than in-store.
Among age groups, Millennials are most likely to want to shop online (63%) while Baby Boomers are the only age group who prefer to shop in-store (54%).
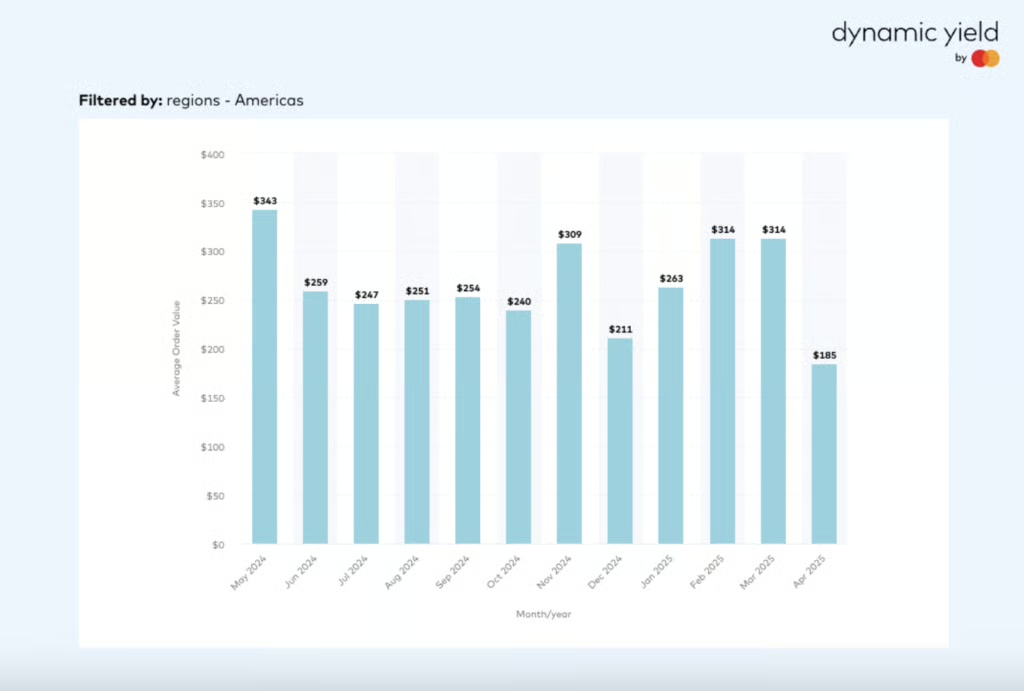
7. The average order value (AOV) in the US is $266
According to Dynamic Yield, the Americas has witnessed the largest average order value among EMEA and APAC regions at $266. However, its April 2025 AOV dropped to $185 from $314 averages in February and March of the same year.
8. The average conversion rate for ecommerce is 3.35% in the US
The Americas also has the strongest conversation rates for ecommerce websites in the past twelve months at 3.35%. Globally, the average conversion rate for ecommerce websites is 3.17%.
Demographic stats of online shopping
Online shopping behavior varies significantly by gender, age, and generation, and understanding these patterns can help you better tailor your online sales strategies.
9. 40% of male consumers prefer buying online compared to 35% of female consumers
This may come as a surprise but men are more likely than women to prefer shopping online — 40% of male consumers prefer buying online compared to 35% of female consumers, according to Capital One Shopping. Actually, this figure aligns with browsing behavior — 53% of men prefer browsing retail online compared to 44% of women. Men are also more likely to use buy now, pay later (BNPL) services (57% vs 45% of women).
10. Nearly 23% of women prefer shopping from a brand’s mobile site or app
According to the same research, shopping platforms matter, too. While both men and women show a strong preference for using a brand’s own app or website, the degree of engagement differs. Among male online shoppers, 60% prefer a brand’s app or site, but just 12.5% prefer mobile formats.
Meanwhile, women are more mobile-focused — 22.9% prefer a brand’s mobile site or app, and 94% of women aged 15 to 35 spend more than an hour per day shopping online.
11. 43% of women and 32% of men regularly shop at third-party marketplaces
According to Capital One, third-party marketplaces remain popular with both genders — 43% of women and 32% of men regularly shop through them.
Take note that the stronger mobile and app preferences among women suggest that businesses with a significant female audience should prioritize mobile-optimized direct channels.
12. Millennials are 14.3% more likely to do their shopping online than any other generation
The same research shows that Millennials (born between 1981 and 1996) lead online shopping engagement. They are 14.3% more likely than any other generation to do most of their shopping online and are the only group to favor online shopping over in-store experiences (by 5.56%).
13. Gen X shops online most frequently
Meanwhile, Gen X (born between 1965 and 1980) shops online most frequently, often on a daily or weekly basis, and is 9.52% more likely than the average consumer to do so.
14. Gen Z is the least likely to shop online but dominate mobile shopping app usage
Surprisingly, Gen Z (born between 1997 and 2012) is the least likely to shop online at all, despite being the most mobile-savvy: they are 27.3% more likely to use mobile payment tools and dominate mobile shopping app usage. They’re also 6.3% more likely than the average consumer to make frequent purchases online, showing high engagement from a smaller shopping base.
Baby Boomers (born 1946–1964) remain part of the e-commerce landscape as well — 8.43% more likely than average to make at least one online purchase annually, though they lag in frequency and mobile usage.

Key takeaways:
- Target Millennials with full online experiences: Millennials are the most active online shoppers and the only generation that prefers online over in-store. Prioritize seamless digital experiences for this group, like mobile-first websites, easy checkout, loyalty programs, and personalized product recommendations.
- Don’t overlook Gen X — they shop most often: Gen X shoppers buy online on a daily or weekly basis more than any other generation. Focus on convenience and reliability. Features like subscription services, reorder options, and dependable customer service can increase retention.
- Engage Gen Z with mobile-first strategies: Even though Gen Z shops online less frequently, those who do are highly mobile-driven. Optimize your mobile site and app experience. Offer mobile payment options and integrate with digital wallets to cater to their preferences.
- Offer buy now, pay later (BNPL) at checkout: BNPL use is highest among shoppers aged 18–44, especially Gen Z and Millennials. Integrating services like Afterpay, Klarna, or Affirm can help boost conversion rates, particularly for discretionary or higher-priced items.
- Don’t ignore third-party marketplaces: With 43% of women and 32% of men shopping on marketplaces, platforms like Amazon, Etsy, and Temu are essential channels. Use them to gain exposure, but direct loyal customers to your owned channels through packaging, email, or loyalty incentives.
- Use generation-based ad targeting: Younger shoppers respond well to social and mobile ads. For Millennials and Gen Z, focus your marketing spend on Instagram, TikTok, and mobile ad networks. Gen X and Boomers may respond better to email marketing and retargeting through search or desktop platforms.
Related free resources:
- Gen X Consumer Behaviors
- Millennial Consumer Behaviors
- Gen Z Consumer Behaviors
- Gen Alpha Consumer Behaviors
Online shopping consumer behavior
Online consumer shopping behavior has evolved into a dynamic, multi-touch process shaped by convenience, value, and authenticity. Today’s shoppers fluidly move between digital and physical channels, rely heavily on reviews and search engines, and increasingly prioritize transparent, frictionless experiences over brand loyalty.

15. One in three Americans shop online weekly
Roughly 37% of US adults make at least one online purchase each week, according to YouGov’s 2025 report on online shopping habits. That figure rises to 42% among women, suggesting a high frequency of digital shopping across demographics. Only 6% said they don’t shop online at all, making online shopping a near-universal behavior.
16. Nearly half of online shoppers do most of their shopping online
YouGov found that 47% of online shoppers complete more than half of their total shopping through digital channels. Among women, that share grows to 51%. This reinforces the growing reliance on ecommerce not just for convenience, but as a primary means of consumption.
17. 76% of online shoppers shop for convenience
According to Linnworks research, the majority of customers (76%) prioritize convenience in the shopping experience — which includes discovering, searching, purchasing, and more. For them, convenience translates to seamless shopping experiences. Eighty-one percent of shoppers are looking for a frictionless, cross-device ecommerce experience.
18. 70% of consumers are open to trying a different brand for products they regularly buy
A study by Bazaarvoice noted that more consumers are trying a different brand for products they regularly buy, which is a great opportunity to attract and retain new customers. In fact, 60% of shoppers have purchased from private labels in 2024.
19. Direct home delivery is the primary reason for consumers to shop online
A hassle-free shopping experience is the primary reason consumers buy online, with 55% citing direct home delivery as a good reason to buy an item online. Avoiding crowds, convenience, and cheaper prices also make the list.
Aside from home delivery, US shoppers want shipping to be free. A whopping 83% of US shoppers say free shipping is important when shopping online, followed by a secure payment process (65%) and a free or easy returns policy (64%).
20. 52% of Americans use search engines to research products
More than half of US consumers turn to search engines like Google to gather information before making a purchase according to a Statista survey conducted in 2024, among 10,147 consumers. This underscores the importance of SEO and paid search strategies for small businesses competing for online visibility.
21. Social media and stores are top sources of product inspiration
When looking for new product ideas, US shoppers are most influenced by social media platforms and in-store browsing based on a 2024 Statista survey. This hybrid behavior shows that while purchases often happen online, inspiration still comes from a mix of digital and physical environments.
22. 57% of shoppers now choose store brands — an 11-point jump in one year
Retail preferences are changing fast. A majority of consumers (57%) are now choosing store brands over name brands, up from 46% the year prior, according to Bazaarvoice’s 2025 Shopper Preference Report. This 11-point surge shows growing trust in private-label goods.
Store brand adoption remains steady across generations. Across all age groups, between 56% and 58% of shoppers are open to switching to store brands. While willingness to adopt store brands declines slightly with age, the narrow range suggests a broad-based shift in perception. Younger consumers are more open to continued adoption, while older generations show some resistance — still, the overall consistency signals a market-wide trend.
23. 76% cite price and 49% cite quality as top reasons for buying store brands
Consumers are primarily motivated by price when choosing store brands — based on the same study, 76% say lower cost is the main factor. But quality also matters, with 49% ranking it as a priority. This 27-point gap confirms that value still drives purchase decisions, but shoppers increasingly expect store-brand products to match or rival national brands in performance.
24. 44% of shoppers are turning to discount stores in a value-driven shift
In the past year, 44% of shoppers have increased their spending at discount retailers, both online and in-store. Rising prices have pushed more consumers to prioritize value and actively seek deals across channels. One in four say they are now willing to forgo brand loyalty in exchange for savings, indicating that even long-standing habits are being reshaped by economic pressure.
25. 56% of shoppers aged 18-34 buy based on creator recommendations
Influencers play a central role in shaping purchase decisions for younger consumers. Bazaarvoice’s 2025 report found that 56% of shoppers aged 18 to 34 have made purchases because of creator endorsements, showing just how influential social media personalities have become in the buyer journey. For brands targeting this demographic, creator partnerships are a strategic must.
26. 46% of shoppers are influenced by short-form video content
The format matters as much as the message. About 46% of shoppers say short-form video content influences what they buy, reflecting how quick, engaging visuals drive action on platforms like TikTok and Instagram Reels. But it’s not just about being flashy — 43% of consumers say creators feel more authentic when they acknowledge both pros and cons of a product. This preference for balance signals that transparency, not just hype, is what earns shopper trust.
27. 50% of shoppers cross-check customer reviews after creator endorsements
Creators influence discovery, but they don’t close the deal alone. According to Bazaarvoice’s 2025 Shopper Preference Report, half of consumers look for customer reviews elsewhere even after seeing a creator recommend a product. This shows a layered decision-making process — shoppers want peer validation to back up influencer claims.
28. 47% of shoppers return to brand websites to verify product details
Shoppers might discover products through social content, but many still rely on a brand’s website to finalize decisions — according to the same study, 41% start their purchase journey on a brand’s website, and 47% return there to confirm product details.
29. 44% of Gen Z and millennials rely on review volume to build trust
Younger shoppers value quantity as a proxy for credibility. Forty-four percent of Gen Z and millennials say a high number of reviews is a key trust factor, compared to 36% of boomers and the silent generation. Broadly, 39% of all shoppers say review volume affects their confidence in a product.
30. 39% of shoppers say the number of reviews of a product impact their decisions
Across global markets, 39% of consumers say the number of customer reviews significantly impacts their confidence in a product.
Shoppers actively verify what they see: 50% check customer reviews on other platforms even after a creator endorsement, and 47% return to a brand’s website to verify product details. These habits highlight a critical need for consistency and transparency across all brand and retail channels.
31. 52% of shoppers prefer to see real, credible content before buying an item
Today’s consumers demand more than glossy product pages — they want transparency. Bazaarvoice’s 2025 Shopper Preference Report found that 52% of shoppers won’t purchase a product unless they see authentic content first. That includes real reviews, photos, and honest feedback that reflects actual user experience.
And the payoff is significant: authentic customer reviews increase conversion rates by 120% compared to generic product descriptions. Simply put, shoppers are more likely to buy when they see proof that other real people have done the same.
32. 52% of consumers distrust content that feels too promotional
Shoppers know when they’re being sold to — and they don’t like it. Fifty-two percent of consumers say they distrust influencer content that feels overly promotional, signaling that hype-heavy endorsements can do more harm than good.
Instead, shoppers respond to nuance: 43% say creators feel more trustworthy when they mention both pros and cons, 35% trust content that includes real-life visuals, and 33% value balanced feedback. To build trust, brands should empower creators and customers to be honest; even if that means showing a product isn’t perfect.
33. 52% of consumers say real reviews drive their final purchase decisions
Customer reviews are the single most influential factor for shoppers. According to Bazaarvoice’s 2025 Shopper Preference Report, 52% of consumers say real customer reviews are the biggest influence on their final decision. On social platforms, 43% say reviews are the most trusted content format, while 47% trust peer testimonials when shopping on social media.
34. 74% of shoppers research online before buying in-store
Webrooming is now a dominant behavior. Nearly three out of four consumers browse online before heading to a store to make a purchase. This tells us that digital content, such as product reviews, specs, videos, and user-generated photos, heavily influences in-store shopping decisions.
35. 57% examine products in-store before buying online
Showrooming still plays a major role in how people shop. Over half of consumers prefer to touch, feel, or try out a product in-store before eventually purchasing it online. This reinforces the need for retailers to think of physical stores not just as sales channels but as experience hubs that support digital transactions.
Retailers with both online and in-store operations should create incentives to keep showroomers within their ecosystem, like offering app-exclusive discounts or easy mobile checkout options while in-store.
36. Only 12% of shoppers start their journey in-store
While stores still matter, they’re no longer the primary starting point. Just 12% of shoppers begin their journey inside a physical location. In contrast, 33% begin with a generic online search and 28% go directly to online marketplaces or retailer sites.
Related free resources:
- User-generated Content for Ecommerce: Ultimate Guide
- How to Use User Generated Content for Marketing (+ Examples)
- Influencer Marketing Statistics
- Ultimate Guide to Influencer Marketing: What It Is & How It Works
- Influencer Marketing Campaigns for Small Business Promotion
Online shopping technologies
Technology is redefining how consumers shop online — it is now embedded across every stage of the online shopping journey, from discovery to checkout. At the same time, AI tools are transforming customer experiences, though not without friction, especially when it comes to privacy.

37. Global mobile commerce reached $4.5 trillion in 2024
Globally, mobile is the dominant ecommerce channel — according to EMARKETER, said nearly 70% of all retail ecommerce sales in 2024 came from mobile.
38. Mobile commerce accounted for 47.7% of ecommerce sales in the first seven months of 2024
Mobile spending hit $280.4 billion in just the first seven months of 2024 — a 10.2% YoY increase — making up 47.7% of total online retail sales in the US, according to Adobe Analytics via eMarketer.
Related:
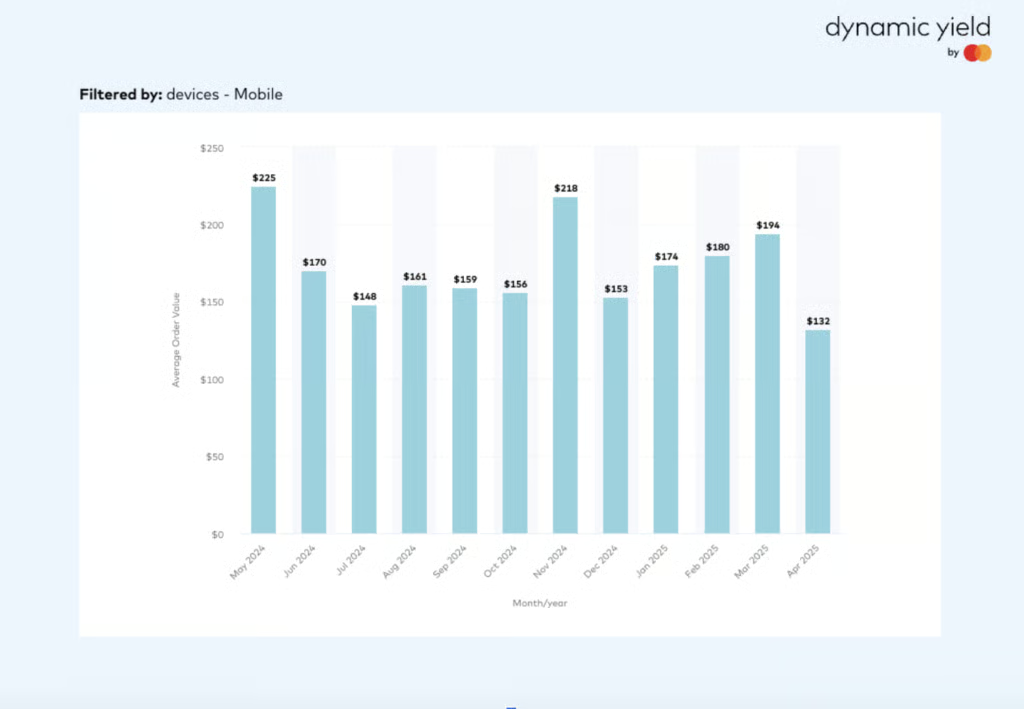
39. The average order value for mobile purchases is $156 in the past 12 months
While many shoppers are turning to mobile shopping, they’re still placing larger orders when they shop on traditional devices like desktop computers. In fact, in April 2025, the average value of an order placed on a desktop was 72% higher than the average mobile phone order ($227 vs $132).
40. Voice shopping is projected to generate $81.8 billion worldwide in 2025
Voice commerce is quickly becoming a major driver of online sales. According to Capital One research, global voice-assisted shopping is projected to hit $81.8 billion in 2025, and by 2030, it’s expected to account for 30% of all ecommerce revenue. Supporting this growth is a staggering 321.7% increase in voice-assisted sales over the last two years, representing a compound annual growth rate of over 105%.
Read more: What Is Voice Commerce? Insights for Independent Retailers
41. 49% of US consumers use voice search for shopping
Nearly half of Americans — about 128.4 million people — are using voice search to support their shopping activity. This usage goes beyond browsing: 32% of all consumers report making purchases directly through voice commands.
42. 74% of voice AI users have completed part of a retail transaction
Conversational voice AI is no longer just answering product questions — it’s facilitating the entire buying process. Nearly three-quarters of consumers who use voice-based AI say they’ve completed at least one part of a retail transaction through a voice assistant — whether it’s searching for a product, comparing prices, or placing an order.
Read more: What Is Conversational Commerce? Types, Benefits & Use Cases
43. Almost 75% of shoppers say augmented reality offers better product accuracy than traditional images
In 2024, most US online shoppers said augmented reality (AR) gives them a more accurate understanding of products than traditional images or descriptions. Per Statista data, nearly 75% of survey respondents rated AR as either somewhat or much better, while only 6% felt AR was significantly worse.
Related: Virtual Reality (VR) in Retail: Guide With Examples
44. 35% of US shoppers say AI improved their experience, yet 40% say it made it worse
Consumer opinion is divided on whether AI enhances the online shopping experience. In a 2024 Statista survey, nearly 35% said AI improved their experience in some way, but around 40% felt it worsened their experience. This disconnect suggests that AI implementations must go beyond novelty — consumers expect real value, relevance, and usability.
Read more: AI in Ecommerce: Small Business Guide
45. Half of consumers are unwilling to share personal data with AI
Nearly 50% of US shoppers wouldn’t allow AI systems to access their personal information, even for more personalized experiences, according to Statista. Around 16% were unsure, and only a similar proportion were willing.
46. 47% of shoppers aged 18 to 24 say AI helps them get faster service
AI tools that power real-time customer service are especially appreciated by younger shoppers. In 2024, about 47% of US consumers aged 18 to 24 — and 46% of those 25 to 29 — said AI helps them get quicker responses online, based on a Statista survey. That sentiment falls to just 21% among shoppers aged 55 to 59.
47. Mobile wallets made up 50% of global ecommerce transactions in 2024
Digital wallets have become the dominant method for paying online, accounting for half of all ecommerce transactions worldwide last year, per Statista research. Their popularity is expected to grow rapidly, with an annual growth rate of 18.1% projected through 2030. Meanwhile, traditional options like credit cards, once a staple of online checkout, held just 20% of the market share in 2024 and are forecast to continue declining.
48. Cryptocurrency payment usage will grow 82.1% by 2026, but remain niche
Crypto payment adoption is set to rise sharply over the next few years, with usage expected to increase by over 82% from 2024 to 2026, according to EMARKETER. Despite this rapid growth, adoption will still be limited to just 2.6% of the population by 2026. For now, crypto remains a niche checkout option — more relevant for signaling innovation than driving volume
Related:
49. Half of shoppers have purchased from an email
According to Marigold, more consumers (50%) have made a purchase directly from an email they received in the last year than from social media advertisements (48%) or posts (43%), SMS/MMS messages (24%), or banner advertisements (21%).
Related: Ultimate Guide to Email Marketing for Retailers
Social shopping (social commerce)
In 2024, shoppers spent more through platforms like TikTok, Instagram, and Facebook, driven by deals, creator content, and frictionless checkout tools. This behavior is reshaping how and where people discover products, compare options, and make impulse buys. While platforms and content formats vary by age group and product category, the common thread is clear: social media is no longer just a discovery tool — it’s a growing point of sale.
50. 24% of shoppers increased their spending on social media in 2024
According to Bazaarvoice’s 2025 Shopper Preference Report, nearly a quarter (24%) of shoppers spent more on social platforms in 2024.
Among those who increased their spending, 12% said the change was up to 20% and 8% saw their social commerce spending grow by as much as half, indicating a growing comfort with making purchases directly through platforms like TikTok, Instagram, and Facebook — likely driven by creator marketing, short-form videos, and offers.
51. 47% of shoppers engage with brands on social media for deals and promotions
Nearly half (47%) of shoppers say discounts, coupon codes, and exclusive offers are the top reasons they engage with brands on social platforms, according to Bazaarvoice. Learning more about the products or services comes a close second at 41%.

52. 79% of 18-to 34-year-old shoppers include social media in their shopping journeys
Younger shoppers are driving social-first commerce. Among those aged 18 to 34, 23% discovered on social and bought from a brand’s website, 21% saw a product on social and purchased in-store, 17% clicked an ad from social and bought from the retailer, and 18% purchased directly on social (TikTok Shop, Facebook Marketplace, etc.).
53. Facebook is the leading platform for social commerce
According to the same research, over half of shoppers pick Facebook for direct buys, with Instagram and YouTube close behind. It also leads the pack when it comes to giving the best experience for social shopping — nearly a quarter (23%) of global consumers rated Facebook as the top social media platform delivering the best experience for social commerce in 2024.
Note though that social shopping behaviors vary by category. Instagram and TikTok are the go-to platforms for fashion and beauty, where creator content and short-form videos fuel discovery and impulse buys. Facebook dominates for everyday essentials like groceries, DIY products, and toys — categories where community recommendations and group deals matter more. For electronics and automotive, shoppers favor YouTube, drawn to its long-form reviews, how-tos, and unboxing videos that support deeper research before purchase.
54. Different age groups respond to different proof: 49% of older adults trust testimonials, while 36% of younger shoppers prefer before-and-after visuals
Bazaarvoice’s report shows that older shoppers (55+) lean heavily on customer testimonials (49%) and product demos (42%), reflecting a preference for peer validation and practical proof over influencer-led content. In contrast, younger adults (18-34) respond more to visually bold, peer-driven content. Before-and-after visuals (36%) and unboxing videos (30%) resonate strongly, offering a mix of excitement and credibility.
Related: 10 Best Unboxing Experience Ideas + How to Execute Them
55. Around two in five younger shoppers make regular impulse purchases, mainly owing to social media
Discovery-led ecommerce — social media scrolling and the ability to buy directly from these platforms — has increased. According to GWI, 41% of Gen Z and millennials make an impulse purchase online every two to three weeks, rising to 48% among daily TikTok users.
The leading motivation for impulse buys remains the same throughout age groups; 47% of impulse buyers cite taking advantage of sales or deals as the biggest reason for splurging.
Note, though, that social media “buy” buttons and influencer or celebrity recommendations are common reasons Gen Z and millennials give for impulse buying. Meanwhile, among older consumers, many do add last-minute surprises to their cart just because they fancy a treat.
Related:
Related free resources:
- What Is Social Commerce?
- Social Commerce Statistics
- How-to guides on selling on social:
- Social media marketing: Influencer marketing, UGC for ecommerce, TikTok marketing, Pinterest marketing
- TikTok Live Shopping
Fulfillment and shipping
Fulfillment and shipping expectations are driving online purchase decisions, too. Meeting customer expectations around delivery speed and shipping costs is key to winning and retaining online shoppers. Below are the latest findings from research conducted by YouGov, a global research data and analytics group.

56. 74% of online shoppers say fast delivery influences where they shop
Fast shipping has become a major decision driver for most US consumers. Nearly three in four online shoppers (74%) say that delivery speed is important in deciding where to shop online. Women are especially sensitive to this factor, with five percentage points higher agreement than men.
57. 33% of US online shoppers expect delivery in one to two days
Same- or next-day shipping is no longer a premium expectation. One-third of shoppers (33%) now want their orders in just one to two days. This is putting pressure on SMBs to streamline fulfillment or partner with faster shipping providers.
58. 51% of shoppers are willing to pay for faster delivery
Over half of all US online shoppers are willing to pay for expedited shipping at least some of the time. Men (55%) are more likely than women (49%) to choose this option.
59. 89% of online shoppers say free shipping impacts their decisions
Free shipping remains one of the most powerful incentives in online shopping. Nearly 9 in 10 shoppers say it influences their purchase decisions, with women especially sensitive to it (92% vs 86% of men).
60. 67% of shoppers spend more to qualify for free shipping
Most online shoppers are willing to add more items to their cart just to hit the free shipping threshold. This behavior is even more common among women (72%).
61. 43% won’t shop with a retailer that doesn’t offer free shipping
For nearly half of all shoppers, free shipping is non-negotiable. Among women, that number climbs to 48%.
62. 62% of shoppers want both fast and reasonably priced shipping
Only 28% of shoppers prioritize the lowest-cost shipping above all else. The majority (62%) are looking for a balance between affordability and delivery speed.
63. 64% of shoppers expect a delivery window and 59% want real-time tracking
Transparency during fulfillment is critical. Most shoppers want a delivery window, and more than half expect real-time tracking. Email or SMS updates are also expected by 55% of online shoppers.
64. 49% of shoppers worry about package theft
Security during delivery matters. Nearly half of all online shoppers are concerned about stolen packages, with women again showing higher concern (+5 percentage points vs men).
65. One in five shoppers feel very negative about robot delivery
Automated fulfillment isn’t widely embraced — 20% of US shoppers feel very negative about robot delivery. Skepticism is notably higher among women (25% vs 17% of men).
Related free resources:
Online shopping reverse logistics (returns)
Return policies can directly influence customer acquisition and retention. Consumers increasingly expect fast, free, and flexible returns — and are quick to abandon purchases if expectations aren’t met. At the same time, fraud and abuse of return systems are rising, putting pressure on profit margins and operational resources.
66. Retailers lost $890 billion to returns in 2024
According to the National Retail Federation, total returns for the retail industry reached $890 billion in 2024. Returns are not just a customer service issue — they’re a major economic force.
67. Eight in 10 American online shoppers say free returns are important when choosing a retailer
The YouGov study mentioned earlier also notes that a seamless, no-cost return process has become a competitive necessity, with 80% of US online shoppers saying free returns are a key factor when choosing a retailer. This expectation is even higher among women who shop online, where importance rises 6 percentage points above men.
68. 53% won’t shop with retailers that don’t offer free returns
According to the same study, more than half of online shoppers say they are unlikely to purchase from a store that doesn’t offer free returns. That share increases to 55% among women.
69. Four in 10 shoppers have abandoned purchases over return policy concerns
Cart abandonment often ties back to unclear or unfavorable return terms. Women are particularly sensitive to this, with higher abandonment rates than men when return policies seem restrictive or costly.
70. 67% of shoppers expect a refund within 3 days
The same study mentions shoppers’ expectations. More than half (67%) of shoppers expect a refund within three days, and this rises to 70% among women.
71. 67% of shoppers expect 30+ days to return an item
Shoppers value flexibility, with a majority of shoppers (67%) expecting a 30-day window for returns. And while 30 days is the norm, women tend to prefer an even longer window — 20% expect 60-day return policies compared to 13% of men.
Related free resources:
- How to Write a Retail Return Policy
- Returns Management
- What Is Return Fraud?
- Ecommerce Return Rates
- Holiday Return Statistics
Online shopping on Amazon and third-party marketplaces
Online marketplaces have become the dominant force in ecommerce, with Amazon leading the pack by a wide margin. In 2024, Amazon not only drew the most traffic but also claimed the highest global merchandise sales, reinforcing its role as both a shopping destination and a product discovery engine. Consumers rely on these platforms for convenience, competitive pricing, and wide selection — shopping multiple times a month across Amazon, Walmart, Temu, Etsy, and others.
72. Amazon is the most visited online retail website in the world
Amazon registered 2.2 billion monthly visits in the US alone as of March 2024. It has been the most visited online marketplace in the US — with its monthly visit figure thrice the monthly visits of eBay — at second place with close to 655 million monthly visits.
73. Amazon is the leading online marketplace in the world
In 2024, Amazon had the highest gross merchandise value (GMV) in the world with approximately $791 billion. Chinese B2C ecommerce company Pinduoduo (owner of Temu) ranked second, with sales of $655 billion.
74. 75.81% of consumers shop on Amazon’s marketplace
Amazon dominates the online marketplace space, with more than three out of four shoppers buying from its third-party sellers in 2024. This high usage signals strong trust in Amazon’s fulfillment and product variety. Walmart follows but lags behind significantly, with 38.05% of consumers shopping through its third-party marketplace. Meanwhile, 28.12% of shoppers turn to Chinese marketplaces like Temu, AliExpress, and Tmall, while 27.53% buy from niche platforms like Etsy or Newegg.
75. Over 50% of consumers shop on marketplaces multiple times a month
Online marketplaces aren’t just popular — they’re habitual. According to 2024 survey data from Digital Commerce 360 and Bizrate Insights, 30.09% of consumers said they shop a few times a month, while 20.16% shop a few times a week. Only 0.69% were unsure how often they buy. This consistent frequency reflects how entrenched marketplaces have become in consumers’ routines, offering SMBs a high-traffic environment to attract regular buyers.
76. 38.05% of shoppers value lower prices and fees on marketplaces
Affordability is a leading driver for shopping on third-party marketplaces. Based on the same study, in 2024, 21.53% of consumers reported that product prices were often lower than on other retail sites, and another 16.52% said that fees, including shipping, were also cheaper. Together, these stats show that nearly two in five shoppers are motivated by overall cost savings.
77. 19.37% of consumers shop marketplaces for broader product selections
Nearly one in five shoppers go to marketplaces for access to a wider variety of products. Specifically, 19.37% cite broader assortments as a key advantage, while 16.13% say marketplaces typically carry more inventory than individual retailers.
78. 52% of US shoppers use Amazon for product research
As of the second quarter of 2024, half of US shoppers (52%) head to Amazon first before going to search engines when doing product searches. This figure is 15% lower than the same period in 2022.
79. Most internet users shop on Amazon because of free and fast shipping
Consumers report a number of reasons for shopping at Amazon when making online purchases. The biggest reason US consumers shop at Amazon is free shipping (48%), followed closely by convenience (44%), and quick delivery (36%).
Related free resources:
- How to Sell on Amazon
- Amazon Seller Fees
- Amazon Statistics
- How to Start an Ecommerce Business on Amazon
- How to Sell on Amazon Without Inventory
- Amazon SEO Strategy: What You Need to Know to Rank Well
Holiday online shopping and seasonal spikes
Seasonal events continue to drive massive spikes in online shopping, with the 2024 holiday season setting new ecommerce records. From the $38.8 billion back-to-school spend to the $241.4 billion in holiday sales, consumers are showing up in force during key retail moments — especially during Cyber 5 and on mobile devices. Deep discounts, flexible payment options like BNPL, and emerging tools like generative AI are reshaping how people shop during these periods.

80. Back-to-school spending was at $38.8 billion in 2024
Back-to-school (BTS) season is still a big sales period for retailers. According to the National Retail Federation (NRF), total BTS sales in 2024 were at $38.8 billion, slightly down from $41.5 billion in 2023.
Related: Back-to-school Marketing Tips for Retailers
81. The 2024 holiday season drove a $241.4 billion online spend
Online holiday spending grew at 8.7% YoY in 2024, driving a $241.4 billion spend (compared to $222.1 billion last year), setting a new record for ecommerce.
82. Cyber 5 remains the peak of the holiday season
Cyber 5 — the five-day stretch from Thanksgiving to Cyber Monday — remains the busiest period of the season. Cyber Week took up 17.15% of the 2024 holiday revenue. It drew in $41.1 billion in sales, experiencing a 8.2% growth from last year.
Read more: 2024 Black Friday Cyber Monday Results
83. Cyber Monday is still the biggest online shopping day
Cyber Monday claimed the top spot among all Cyber 5 shopping days for online revenue and is the biggest online shopping day of the year to date, hitting $13.3 billion in sales.
Related: 2023 Cyber Monday Statistics & Results
84. 54.5% of online retail sales for the entire holiday season were made on smartphones
2024 marks the biggest year ever for online shopping made through mobile devices, amounting to a record $131.5 billion (a 15.86% growth over 2023).
85. Deep discounts and BNPL fueled online shopping spending for the holiday season
According to the Adobe Digital Insights report, retailers provided double-digit discounts between 10% to 30% to incentivize stronger consumer spending. Electronics, toys, computers, and apparel had the biggest discounts of the season.
And to encourage holiday spending, retailers offered BNPL payment options. Total online BNPL spend during the holiday season (November to December) reached $18.2 billion, up 9.6% from last year and representing $1.6 billion more last season.
86. Generative AI-driven shopping traffic surged 1,300% year over year
Retail traffic from generative AI-powered chatbots grew 1,300% this past season, with Cyber Monday alone seeing a 1,950% spike compared to the previous year. While overall usage is still ramping up, the sharp rise signals growing consumer trust in AI as a shopping assistant.
According to Adobe, seven in 10 users say generative AI improves their shopping experience — helping them find deals, locate specific products faster, and get brand suggestions.
Related free resources:
- How to Create a Holiday Gift Guide
- How to Offer Customer Financing
- What Is BNPL?
- Best Buy Now, Pay Later Apps
- Black Friday Statistics
Consumer spending trends amidst economic pressures
Consumer behavior in 2025 reflects a landscape shaped by caution and shifting priorities. Inflation, tariffs, and economic uncertainty continue to weigh on sentiment, with many shoppers scaling back nonessential purchases, trading down to lower-cost options, or turning to secondhand alternatives.
At the same time, generational divides and value-based motivations — such as selective splurging, sustainable shopping, and subscription adoption — are creating a complex environment.
87. 53% of consumers still feel uncertain or pessimistic about the economy
According to McKinsey research, nearly half (46%) of US consumers felt optimistic about the economy in early 2025, supported by strong fundamentals like low unemployment, stable inflation, and continued job growth. Despite favorable economic indicators, a slight majority (53%) said they felt unsure or negative about the economy.
88. Tariff news triggered a 32% drop in net consumer sentiment
After early 2025 tariff announcements, net consumer sentiment dropped by 32%. An overwhelming 91% of consumers were aware of the news, and 60% said they were already adjusting or planning to adjust their spending. Retailers, especially import-heavy ones, should watch for shifts in buying behavior and prep communications or pricing strategies accordingly.
89. Inflation tops the list of consumer concerns at 43%
Inflation remains the leading concern for US shoppers, cited by 43%, with tariff policy following at 29%. In response, consumers are delaying nonessential purchases and seeking better prices, pressuring businesses to justify pricing and lean into promotions, bundles, or loyalty rewards to retain budget-focused shoppers.
90. Only 20% of baby boomers plan to splurge vs 50% of millennials
Splurging intentions vary widely by generation. Baby boomers are the most cautious, with just one in five open to discretionary spending. In contrast, half of millennials plan to indulge. Retailers should consider tailoring marketing by age group, focusing on practicality for older consumers and emotional value for younger ones.
91. Gen Z is turning to secondhand shopping amid economic pressure
Economic shifts, especially tariffs, have made secondhand appealing to Gen Z, who are more likely than older generations to buy pre-owned items. Resale platforms, consignment models, and sustainability-forward messaging are likely to resonate strongly with this group.
In fact, a staggering 93% of US consumers have resorted to “recommerce” (buying used goods) to avoid the impact of inflation in 2024. More than half of respondents in the cited report also intended to shop secondhand more frequently in the future.
Read more:
- What Is Recommerce? 2025 Small Business Guide
- Resale Made Easy: How to Start a Resale Program Today
92. Discretionary spending down as most consumers cut nonessentials
A majority of consumers are reducing discretionary spending, according to McKinsey, with nonessential categories like apparel, entertainment, and home goods seeing widespread trade-down behavior. Consumers are opting for lower-cost alternatives and delaying purchases to stretch budgets.
93. 50% of consumers splurge on travel or self-care despite cutbacks
Half of shoppers still plan to indulge selectively — especially in travel and personal care. This suggests that even as overall spending tightens, emotional and experiential value continues to drive purchases in specific categories.
Related: The Lipstick Effect: Small Luxuries Shaping Economic Trends
94. Lower-income shoppers are 13 points more likely to trade down
Compared to higher earners, lower-income consumers are 13 percentage points more likely to switch to cheaper brands or products in response to economic stress. Brands targeting budget-conscious segments should be ready with competitive pricing, promotions, and clear value messaging.
95. 58% of consumers are willing to pay more for eco-friendly products
Sustainability is a purchase driver for a majority of global consumers. According to GWI, over half (58%) say they’re willing to pay a premium for products that are eco-friendly. This sentiment is even stronger among younger generations: 60% of millennials and 58% of Gen Z are open to paying more to support environmentally conscious brands. These figures signal that sustainable product positioning isn’t just ethical; it’s commercially strategic.
Read also:
- Retail Sustainability Trends
- Sustainable Packaging Ideas for Ecommerce Businesses
- What Is Circular Fashion? A Retailer’s Guide
96. 43% of consumers want brands to prioritize sustainability and transparency
Almost half of consumers expect businesses to take the lead on sustainability, per the same study. Specifically, 43% say brands should focus on ethical sourcing and transparent production practices. This reinforces the need for companies to clearly communicate their sustainability commitments across marketing, product packaging, and customer service.
Related:
- Ethical Consumerism for Retailers: The Ultimate Guide
- Ethical Sourcing: A Small Business Guide
97. 60% of urban consumers are willing to pay more for sustainable products
Urban shoppers are at the forefront of the green movement. Six in 10 city dwellers are open to spending more for eco-friendly goods, suggesting that urban centers represent strong markets for sustainable brands.
98. 31% of consumers now pay for streaming subscriptions, while 10% pay for social media access
Subscription-based digital content is becoming mainstream. Streaming services lead the trend, with 31% of consumers subscribed, up 16% since 2019. This rise reflects how deeply entertainment subscriptions are embedded in daily life. Meanwhile, 10% of consumers also pay for social media platforms, signaling growing demand for exclusive or ad-free online experiences.
These behaviors show that users are increasingly open to paying for personalized, premium digital content. For brands, this opens up opportunities to create recurring revenue through direct subscriptions, content bundles, or partnerships with popular platforms that cater to niche or loyal audiences.
Read more: What Is a Subscription Business Model & How Does It Work?
Frequently asked questions (FAQs)
Click through the questions below to get answers to some frequently asked questions on online shopping stats.
Why is online shopping becoming more popular?
Online shopping is growing because it offers what today’s consumers want most: convenience, speed, and flexibility. In fact, 76% of shoppers say convenience is their top reason for buying online, and 55% specifically cite direct home delivery as a key motivator.
On top of that, features like free shipping, easy returns, mobile access, and secure payments have become expectations. Consumers also enjoy being able to research products, compare prices, read reviews, and even check out with digital wallets — all without leaving home.
What age group buys the most online?
Most online shoppers are 25 to 34 years old.
What Americans buy most online?
Clothing and apparel is the most popular product category that US consumers buy online.
Bottom line
The takeaway is simple: online shopping is where your customers are — and where your business needs to be.
Consumers expect more than just a digital storefront. They want smooth mobile experiences, flexible payments, clear return policies, and authentic product information they can trust. And they’re not afraid to switch brands if those needs aren’t met. These stats make one thing clear: if you’re not evolving with your customers, you’re losing them.
Use what you’ve learned here to fine-tune your online strategy. Whether you sell through your own website, marketplaces, or social media, now’s the time to double down on what works — and fix what doesn’t.