


Amazon Prime Day, an annual shopping holiday hosted by the world’s largest ecommerce marketplace, happens every year in July and is exclusively available for Amazon Prime subscribers. 2024 was a big year for the holiday—driving tons of sales, new Prime subscribers, and investment in ad spend.
Prime Day also presented one of the best years for savings yet—likely because shoppers are getting savvier than ever before, and economic concerns have caused people to spend more consciously. Let’s take a look at Amazon Prime Day stats that prove it.
2024 Amazon Prime Day: Results & Sales Overview
1. There are 180 million Prime Day subscribers
It’s forecast that there will be 180.1 million Prime Day subscribers in the US by the end of 2024. This is 11.8 million more people than in 2022, which saw 168.3 million subscribers.
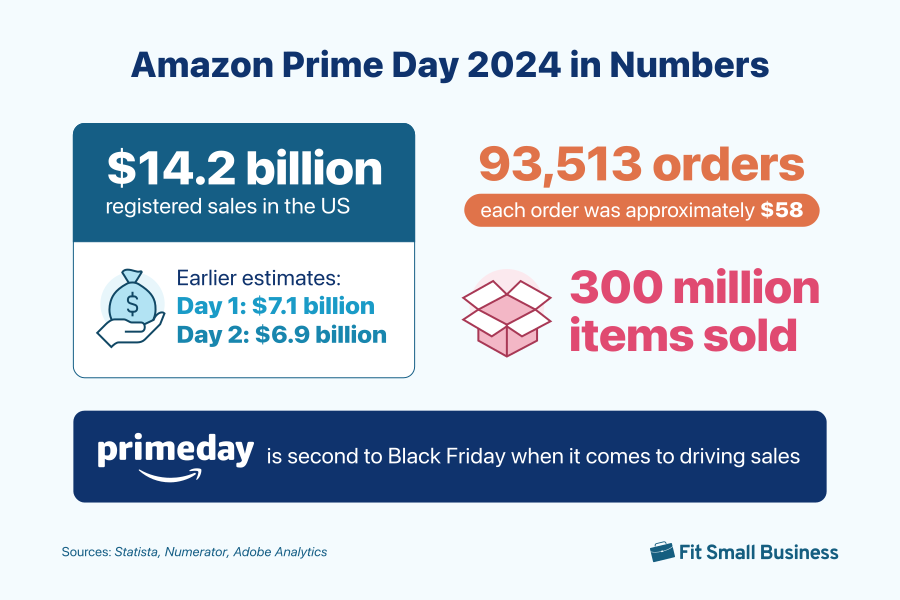
2. Prime Day registered $14.2 billion in sales in the US
According to estimates, Prime Day sales remain on an upward trend. In 2024, there were $14.2 billion in total US sales—a 10.5% jump from $12.9 billion in 2023. Most purchases happen in the US.
Another source forecast that 2024 Prime Day would drive $7.1 billion in sales on day 1 (an 11.3% increase from 2023) and $6.9 billion on day 2 (a 9.2% increase from 2023).
3. There were 93,513 total orders on Prime Day
In 2024, Prime Day subscribers placed 93,513 Prime Day orders. These orders were placed across 35,588 different households.
4. 300 million items were purchased in 2024
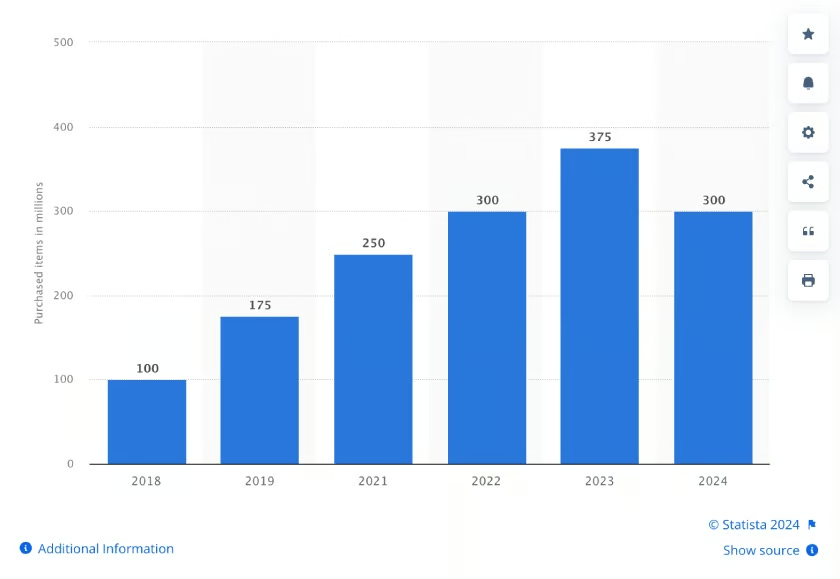
In 2024, shoppers bought a total of 300 million products. While this number is lower than 2023’s 375 million, it represents significant growth from years prior. Total products sold hit 175 million in 2019, and 250 million in 2021. 2024 metrics have nearly doubled since 2019.
5. People had planned to spend around $300
For 2024, consumers had budgeted about $300 each for the shopping holiday. This is significantly less than the $375 budget in 2023.
Other retailers have started to offer their own discounts during this same time period, and consumers had budgets of about $221 for those promotions. This indicates that brands don’t have to sell on Amazon to capitalize on the shopping event in their own way.
(Source: Statista)
6. 21% of Prime Day orders were $20 or less
Microspending abounds on Prime Day. Approximately one-fifth of total US orders were $20 or less. In the EU, about 13% of orders were less than 10 euros.
7. Each order was approximately $58
According to Prime Day retail analytics, the average order value for the 2024 event was $57.97.
8. Prime Day is second to Black Friday in driving sales
Black Friday is still the top retail sales event. However, Prime Day comes in second. One-third of merchants say this holiday is the most influential in its sales events, and about 17% experienced an increase in sales in 2024.
Related: Black Friday Statistics
to Know: 2023 Sales Data
Consumer Behavior & Preferences
9. Most Prime Day shoppers are women
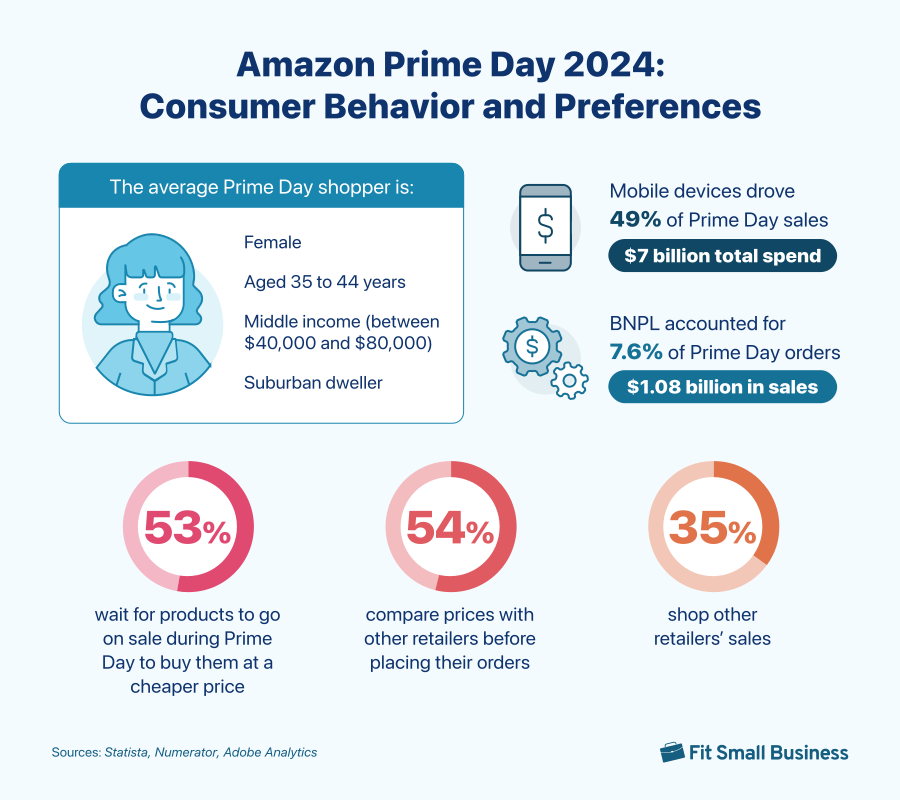
The profile of the average Prime Day shopper is as follows:
- Female
- Aged 35 to 44 years
- Middle income (between $40,000 and $80,000)
- Suburban dweller
10. 60% of households placed more than two orders
Most households placed multiple orders on Prime Day. In fact, 60% placed at least two separate orders, amounting to an average spend of $152 per household.
11. Mobile devices drove nearly half of Prime Day sales
Mobile shoppers are very present on Prime Day. About 49% of total Prime Day purchases were made on mobile devices. The total spent via mobile devices was $7 billion, an 18.6% increase from 2023. Of day one’s $7.1 billion in sales, $3.4 billion are estimated to have occurred on mobile, representing 48.4% of total day one sales.
Related:
- What Is Mobile Commerce? How It Can Help Your Business
- Biggest Mobile Commerce Trends + Stats
12. Buy now, pay later accounted for $1.08 billion in sales
Amazon initially offered buy now, pay later (BNPL) options to shoppers in 2023. It quickly gained traction, driving $1.08 billion in sales for Prime Day 2024. BNPL statistics say it made up 7.6% of total online orders for Prime Day, marking a 16.4% increase from 2023. This is likely due to increased awareness of the payment option and economic concerns among consumers.
Read also:
- What Is BNPL? Small Business Guide to Buy Now, Pay Later
- Buy Now, Pay Later Statistics
- 6 Best Buy Now, Pay Later Apps for Small Businesses in 2024
13. Curbside pickup drove 18.9% of orders
Curbside pickup is one fulfillment option that’s actually lost traction. In 2024, it accounted for nearly 19% of total online orders. However, this is a slight decrease from 20.2% in 2023.
14. More than half of consumers actively wait for Prime Day
Rather than making their purchases at other times of the year, more than half (53%) of consumers actually wait for products to go on sale during Prime Day so they can buy them at a cheaper price.
15. 54% of shoppers compare prices with other retailers prior to placing their orders
Over half (54%) of Prime Day shoppers do price comparisons with other retailers. They’re actively seeking out the best deal, whether that comes from Amazon or elsewhere.
16. 35% shop other retailers’ sales
Many major retailers have created their own promotional sales events after seeing the success of Prime Day. And consumers know it. About 35% shopped at the Target Circle Week sale and/or Walmart Deals sale.
17. Two-thirds of Prime Day shoppers were highly satisfied with the deals offered
Most Prime Day shoppers are happy with the deals they’ve scored. In fact, merchant offerings are somewhat to very satisfactory to about 66% of Prime Day shoppers. Twenty-six percent of surveyed shoppers found deals extremely satisfactory.
Product Categories
18. Half of Prime shoppers look for deals on fashion items
Half of shoppers intended to buy fashion items on Prime Day while 34% preferred laptops, computers, and tablets.
19. Apparel and shoes accounted for 27% of Prime Day sales
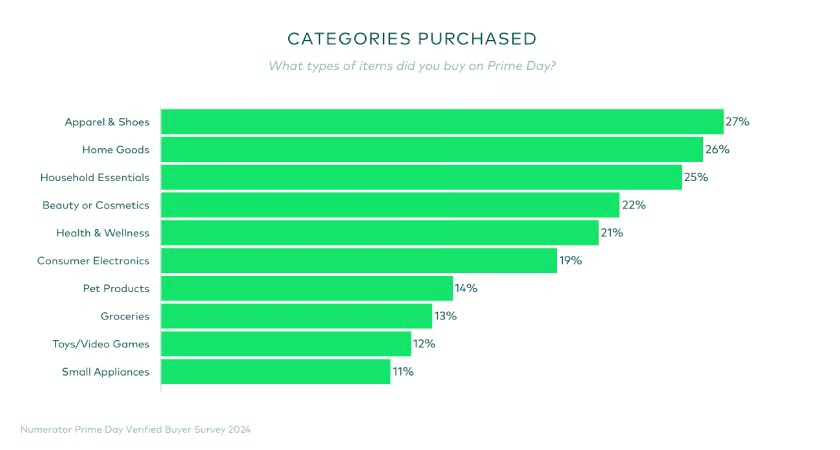
As far as product categories go, apparel and shoes receive the most sales during Prime Day. This was followed by home goods (26%), household essentials (25%), beauty or cosmetics (22%), and health and wellness (21%).
(Source: Numerator)
20. Electronics sales are 61% higher during Prime Day than throughout the year
Electronics is a product category, with a 61% increase in sales during Prime Day compared to average daily sales throughout the year. Other top-growing categories include:
- Tablets (up 117%)
- Televisions (up 111%)
- Headphones and Bluetooth speakers (up 105%)
- Fitness trackers (up 88%)
- Computers (up 80%)
- Smartphones (up 71%)
- Cameras (up 60%)
21. The Amazon Fire Stick is the most popular Prime Day item
The top items on Prime Day 2024 were Amazon Fire TV Sticks, Premier Protein protein shakes, and liquid IV packets.
22. Electronics were the most discounted item
As a product category, electronics offered the most savings. It had the highest average discount, coming in at around 34%. Beauty, personal care, tools, and home improvement products were discounted by an average of 29%.
Other estimates say electronics were discounted by about 23% (more than the average 14% discount in 2023).
23. 68% of Prime Day shoppers were doing back-to-school shopping
Prime Day presents an excellent opportunity for savings for back-to-school shoppers. More than two-thirds (68%) of Prime Day shoppers purchased back-to-school items. This is a marked increase from 49% in 2021. (source)
Back-to-school product spending increased by 216% in 2024 compared to the previous year. (source)
Read also:
- 2024 Back-to-School Marketing Ideas & Trends for Retailers
- Back-to-School Shopping Statistics to Know
Seller Stats & Sales Strategies
24. Independent sellers sold 200 million items
Prime Day presents sales opportunities for big brands and small merchants alike. Independent sellers sold more than 200 million products for Prime Day 2024.
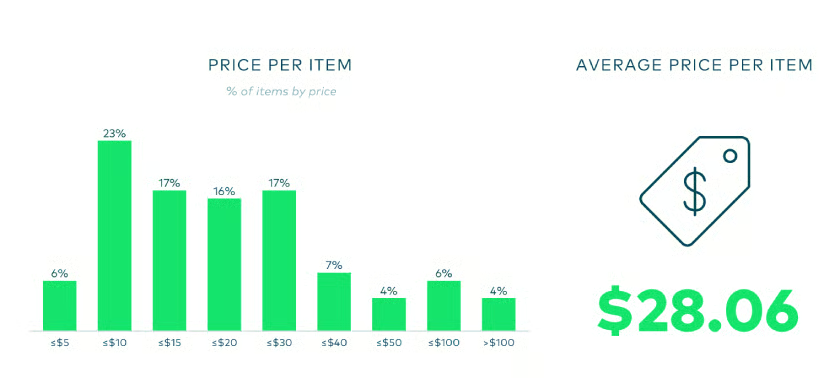
25. The average price per item on Prime Day was $28.06
Most items (63%) sold during Prime Day come in under the $20 mark. Just 4% cost more than $100. The average price per item for Prime Day 2024 was $28.06.
(Source: Numerator)
26. The average discount offered on Prime Day deals was between 9% and 22%
Sellers know economic concerns are driving consumers to seek deals. So they offered significant discounts in 2024—falling between 9% and 22% on average.
27. 40% of brands offered Prime Day Exclusive Discounts
Prime Day Exclusive Discounts (PEDs) are available to Fulfillment by Amazon (FBA) sellers. They offer you a way to highlight the discounted price in an effort to drive more conversions.
The regular price is displayed, but Amazon crosses it out and lists the new price and the total percentage discount. There’s also an accompanying Prime Day Deals badge during the sales event.
In 2024, 40% of brands used PEDs, more than the 21% that did in 2023. This was the most popular promotion tactic. Coupons came in second, with 37% of brands using them to promote deals.
Learn more about FBA: Our Fulfillment by Amazon Review
28. Sales increased by as much as 116%
Merchants don’t need to offer deals to benefit from the event. In fact, non-participating sellers saw a 116% increase in sales during Prime Day compared to the previous 30 days.
29. Ad spend increased in 2024
Amazon merchants tend to boost advertising spend during Prime Day. In 2024, sellers spent 29% more on ads for sponsored products than the rest of the year. In 2023, ad spend for sponsored brands increased by just 10%, suggesting more adoption in 2024. Spend on sponsored display ads, however, decreased by 26% in 2024 compared to 2023.
Other advertising options include Amazon Demand Side Platform (DSP). Spend on this ad option increased by 143% compared to 2023. Programmatic campaigns were more effective, earning 177% more impressions.
Sponsored products drove 85.8% of ad-driven sales, with an advertising cost of sales of 27.5%. Brands increased their investment in sponsored products by about 82%.
30. Display ads were the most effective channel
Outside of Amazon’s advertising options, display ads and social media emerged as top channels. Here’s the breakdown of how much each advertising channel drove in sales:
- 12.5%: Display ads
- 11.1%: Social media
- 10.7%: Direct traffic
- 8.2%: Affiliates and partners
5 Tips for How to Prepare for Amazon Prime Day
If you’re already selling on Amazon, here are some ways to maximize your reach and drive sales:
Get Started Before Prime Day
While Prime Day only lasts 48 hours, retailers prep for weeks or even months in advance. Don’t wait until July to get started selling on Amazon. Instead, consider getting your seller profile and product listings up and running months in advance. Then, you can collect valuable customer feedback and reviews to refine your offerings and also build social proof.
Be Prepared to Compete on Price
Prime Day is all about savings and deals—it’s one of the biggest motivators for shoppers. And they’re getting savvy, running price comparisons with other sales channels to make sure they get the best deal. Ensure your pricing strategy is up to snuff and you can still turn a profit. See what your competitors are pricing at and do research to find pricing history for similar products to the ones you’re selling.
Related:
Tap Into Amazon’s Promotional & Advertising Tools
Amazon offers its own advertising tools—and it’s likely that the more you use its tools, the more it will reward you. Don’t be afraid to experiment with its advertising options throughout the year to get comfortable with the platform and test out different tactics to find out what works. When Prime Day rolls around, you’re primed and ready to hit the ground running.
Offer Deals on Your Own Channels
Shoppers are getting savvier and savvier. Rather than limiting yourself to Prime Day promotions, you might consider offering deals on your other owned channels, like your website, on social media, or wherever you sell online (or in-store). This gives you the flexibility to extend the sale longer, offer steeper discounts, and own the customer relationship—a major limitation when selling on the ecommerce marketplace.
Related:
Ensure You Have Enough Inventory
Planning for Prime Day involves more than planning your promotions. Just like with the busy holiday season, you need to ensure you have enough stock on hand to fulfill orders. Prime Day can bring a sizable spike in sales, and it’s important to be prepared. You don’t want to have unhappy customers due to late shipments (and Amazon may even require fast fulfillment), refunds for unfulfilled orders, or lost sales due to out-of-stocks.
Frequently Asked Questions (FAQs)
These are some of the common questions people ask about Amazon Prime Day.
Amazon got 93,513 total orders on Prime Day in 2024.
Prime Day is very successful. It started as a 24-hour event in 2015 and has since expanded to 48 hours every year. In 2024, Prime Day generated $14.2 billion in total sales. It continues to grow every year.
The record for Amazon Prime Day sales was in 2024 with $14.2 billion in total sales. This was from 93,513 total orders.
Electronics and apparel sold the most on Amazon Prime Day in 2024, according to Amazon Prime Day statistics.
The biggest Amazon sale day is Prime Day. Prime Day is a 48-hour event typically occurring in July. Retailers offer discounts for a limited time to Prime subscribers.
Bottom Line
Prime Day continues to gain traction and even rivals Black Friday in terms of the biggest shopping days of the year. And it continues to evolve, offering more opportunities for sellers to make a profit and consumers to snag a deal.
It’s important to understand the motivations of Prime Day shoppers and how to price and position your brand competitively. Use the Amazon Prime Day statistics and figures above to learn, get insights into what consumers expect, and anticipate future shopping trends.
