

Content marketing, while hugely popular and effective, can be tricky to master. There are so many factors to consider, like what type of content is most effective for your audience and what topics you need to focus on. Because content marketing is so broad, finding the right content strategy for your small business will take some research and planning. Here, we’ve compiled 24 of the most important content marketing statistics to help you on your way.
Content Marketing Effectiveness Statistics
Content marketing wouldn’t be so prevalent if it weren’t effective. The fact is, content marketing has been proven to boost traffic for your small business website, increase search engine ranking, keep customers engaged with your brand, convert leads, and overall grow your brand presence. But don’t take our word for it—here are statistics about content marketing’s effectiveness that illustrate why it deserves a spot in your marketing strategy.

1. Content marketing can bring up to 55% more visitors to your website
One of the foremost ways content marketing can help your brand is by bringing in exponentially more visitors to your website. In fact, according to HubSpot, it can bring in up to 55% more visitors, who can eventually turn into leads and customers.
It’s simple: The more content your website has, the more likely it’ll rank search engines and be found by people. This is especially true if you create genuinely valuable, high-quality content—it’ll not only keep people coming back, but it’ll also increase your site’s search engine ranking and your brand authority.
2. Content from brands can increase customer purchase intent by 131%
One of the benchmarks determining the effectiveness of content marketing (or any other marketing strategy) is how well it increases customers’ purchase intent—or the likelihood that they’ll purchase from your brand. And for content marketing, research shows that it can be pretty high. A study found that customers who consumed educational content from a brand early on were up to 131% more likely to purchase from that brand.
The key takeaway? Incorporate a good amount of educational content in your content marketing strategy, especially in the earliest stages. Find out your customers’ interests, pain points, and frequent questions, and use them to guide your content. The key is to offer helpful information to your audience. This increases their trust in your brand, which ultimately increases their purchase intent.
3. Content marketing can increase customer lifetime value by 70%
The best marketing strategies don’t simply end after generating a sale. What makes a brand successful in the long term is if it can keep customers coming back and eventually become loyal followers. Content marketing can be a helpful tool for that. Not only can content help increase your business’ sales, it can also increase your customers’ lifetime value by up to 70%, according to a Conductor study.
It all comes down to the same idea of trust: When people find your brand credible and trustworthy, they’re likely to stick around more, especially when you continue providing them with high-quality, valuable content.
4. 64% of customers trust brands that create educational content
Not only are customers more likely to purchase from brands creating educational content, they also find them more trustworthy. The same study above also measured customers’ trust in the brands they consumed educational content from and found that 64% of them found those brands worthy of their trust.
What’s more, this trust only increased with time. One week after consuming the content, the number increased to 73%. It’s not surprising: Content, especially educational content, increases a brand’s credibility, and credibility is far more effective at drawing people in organically than fast-track strategies like ads. If you want customers to trust in your brand, valuable content is the way to go.
5. 97% of marketers find success with content marketing
The bottom line is content marketing has proven successful, and that’s likely to continue in the coming years. According to Semrush’s 2023 survey, 97% of marketers said they found success with their content marketing efforts. It’s an increase from the year before, when only 91% said the same.
These content marketing growth statistics show that the impact of content in growing your brand isn’t slowing down. The fact is content marketing is budget-friendly, accessible, and consistently effective. If you haven’t incorporated it into your marketing strategy yet, now’s a better time than ever to get started.
Blog Content Marketing Stats
Blogging is the foremost pillar in content marketing. It’s where content marketing began, and it’s still one of its biggest contributors today. While blogging began simply with people sharing stories about their lives, as a content marketing practice, it’s since grown to be a formidable force for growing your search engine ranking, traffic, and credibility—everything you need in a content marketing strategy.
Here are content marketing facts and statistics about blogging to keep in mind:
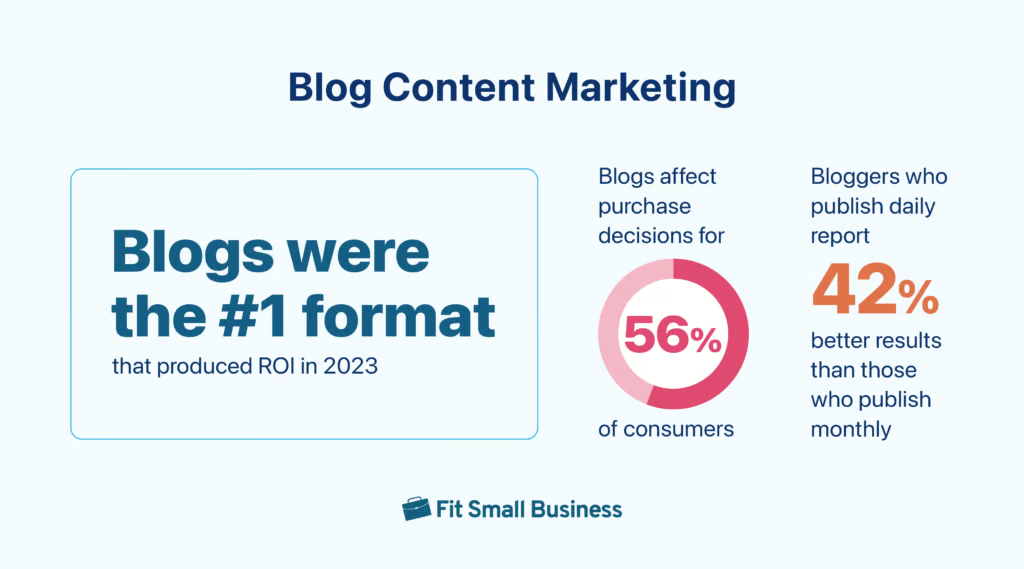
6. Blogs were the No. 1 format to produce ROI in 2023
While content marketing encompasses many formats, from images to experiential marketing, it’s blogs that were most effective at generating return on investment (ROI) in 2023. According to HubSpot’s report, 16% of marketers cited blogs as the format that produced the highest ROI in the past year, alongside social shopping. That’s higher than paid ads or email marketing, which both sit at 14%.
While video may be having its moment in the spotlight, don’t discount the power of the written word just yet. Blogging opens up many more entry points into your site and allows you to do further content marketing strategies like link building campaigns or gated content.
7. Blogs affect purchase decisions for 56% of consumers
If you plan to use blogs to generate more sales, content marketing statistics are on your side. According to a 2023 survey, 56% of customers said reading a blog directly led them to make a purchase. That means blogs can positively influence people’s buying behavior in more than half the cases.
To maximize your blog’s chances of generating sales, make sure your blog is genuinely helpful (i.e., it helps your readers make informed buying decisions), is well-structured and easy to read, and includes helpful links and calls to action (CTAs), such as links to your product pages. Find out more about how to start a blog for your business.
8. Bloggers who publish daily report 42% better results than those who publish monthly
Consistency is key in any marketing strategy, but all the more so with blogging. You need to constantly put out content to keep readers engaged with your brand. Recent data also supports this: According to a 2023 survey, bloggers who published blogs every day reported 42% better results than those who published only every month.
That’s also why having a content marketing plan prepared beforehand is so important. Publishing content constantly takes lots of time, effort, and research. Planning all of it in advance can make all the difference in the success of your content strategy.
Video & Podcast Content Marketing Statistics
If you’ve ever done any marketing in the past few years, or even if you’ve scrolled through brand accounts on social media, you probably know how essential video is to your strategy. That’s because it’s true: video is currently the most impactful content in marketing. Whether it’s a high-shine product demo or a simple TikTok dance, people simply can’t get enough of videos. The same is increasingly true for its cousin, podcasts, which are also growing in popularity.
Find out more about these two growing content marketing powerhouses in the content marketing stats below on videos and podcasts:

9. 45% of marketers say video is their top-performing content format
According to Semrush, 45% of marketers cite video as their highest-performing content format—higher than blogs, infographics, and even events. From gaining impressions to generating ROI, the impact of video can’t be understated. It’s no surprise in today’s fast-paced, visual-centric, digital-first world: videos disseminate information faster and easier than ever.
So the next time you plan on publishing a lengthy guide explaining how to use your product, consider if a video demo would illustrate it better instead. This is especially true if you have a highly visual brand (say if you’re in the fashion or hospitality industry) or have a difficult-to-explain product or service (for example, a tech gadget or a home repair service).
10. 82% of people say watching a video convinced them to purchase from a brand
We all know video is effective, but not only for educating people about your product or service. Recent research found that 82% of consumers say watching a video has directly convinced them to purchase from a brand. While it’s a slight decrease from the previous year’s 89%, it’s still been a consistently high number since 2018.
What do these video content marketing statistics mean for your strategy? Find ways to organically fit in video in every stage of your customer journey. For instance, do a product introduction video in the top-funnel awareness stages, then create testimonial videos later on to convert your leads into customers.
11. 44% of consumers prefer learning about brands through video
Videos don’t just get your brand name out to the digital world, they’re also your customers’ most preferred way of learning about your business. A 2024 survey found that 44% of customers said they prefer learning about brands, products, and services by watching videos instead of reading manuals, articles, or infographics.
There’s simply no overstating the importance of video in your content marketing strategy. The key to maximizing its influence is to do intensive research on the subjects your target audience is thinking about and searching for, and to plan out your videos for every stage of the customer journey.
12. Podcast listeners grew by 52% from 2020 to 2024
Podcasts are on the rise. In particular, they’ve been growing by approximately 52% since 2020. In that year, there were only over 300 million podcast listeners, and in 2024, there are over 500 million. It’s a growth not looking to slow down anytime soon. With more and more internet users becoming podcast listeners, it’s time to think about incorporating them into your content strategy.
Some ways to leverage podcast marketing for your small business are:
- Holding regular (such as weekly) discussions about relevant issues in your industry
- Inviting guest experts to explain important or complicated concepts
- Answering your customers’ frequently asked questions
The important thing is to keep topics focused on your industry and to impart valuable knowledge to your listeners. Don’t use your podcast as an advertising tool—it’ll only turn listeners away. Give them valuable use of their time by producing episodes that are informative, interesting, and valuable.
13. 88% of people listen to podcasts to learn something new
People have an appetite for podcasts because they have an appetite to learn something new. According to the Pew Research Center, 88% of podcast listeners said their main reason for listening was to learn new things about a topic.
This is good news for small businesses. It means many podcast listeners are willing to learn about topics from people. So, leveraging informative content for your podcasts, like expert interviews and in-depth discussions, is a good idea.
Email Content Marketing Statistics
Email is another pillar in content marketing. Sending and receiving emails is one of the oldest forms of communication in the digital age, and it still has plenty of benefits. For one, email is a more focused way of communicating with your audience because you’re not competing with hundreds of other brands on their screen. This is a significant advantage when you’re getting them to complete an action like a purchase or a website visit.
Here are some content marketing stats for email to take note of:

14. 87% of marketers plan to increase their email marketing investment in 2024
While email may have been around for a while, that doesn’t mean its relevance is fading. In fact, it’s so effective that 87% of marketers plan to maintain or increase their investment in it in 2024, according to HubSpot. However, the study also found that strategies around email need to evolve with current times.
According to marketers, here are the main ways businesses need to evolve their email strategy in 2024:
- Being ready to pivot and restrategize in case of events
- Reflecting brand values in their content
- Creating content about personal experiences
Whether you own a corporation or a home-based business, these are the content people want to see most in their inboxes. Keep them in mind when crafting your email marketing plan.
15. 41% of marketers use email to boost revenue & customer retention
Emails have long proven effective, but marketers use it most in two particular areas: increasing revenue and boosting customer retention. According to Litmus’ 2023 report, 41% of marketers use email marketing for those two particular objectives, with generating leads just behind at 40%.
These content marketing stats mean there’s no particular area where email marketing excels exponentially more than others. Rather, it comes down to how you leverage it. If you’re using emails to generate sales, make sure to send them at the right point during the customer journey. Meanwhile, if your objective is to increase website traffic, make your links and calls to action (CTAs) hard to miss. Find out more email marketing best practices to follow.
16. Nearly 17% of marketing emails are newsletters
Content marketing via email is as alive and kicking as ever. Take these content marketing statistics by Mailmodo: Nearly 17% of all marketing emails sent in 2023 were newsletters—more than cold emails (7.8%), lead nurturing emails (11.6%), and even promotional emails (15.3%). Newsletters remain a well-established way to keep customers engaged and to share valuable content.
This also coincides with research from Semrush that highlights email marketing as the most effective channel for content promotion for 55% of marketers. The stats are clear: email newsletters remain a foolproof form of content marketing. Use them especially in the engagement stages and to share important blogs and announcements.
Social Media Content Marketing Stats
When discussing content marketing, it’s impossible to leave out social media. It’s on your phone and probably on the phones of all your customers. It’s used by businesses big and small. It’s everywhere. And it should also be in your 2024 content strategy. You already know that social media is essential to growing your small business, but the question is how you leverage it to maximize its growth. The statistics below can help guide you.
Read on for some of the most important statistics about content marketing on social media:

17. 73% of marketers say organic social media is their No. 1 content marketing channel
If you have any doubts about the power of social media in content marketing, put them away. According to Semrush, 73% of marketers choose organic social media as their top channel for marketing their content, beating email and even paid ads.
That’s because social media is so diverse content-wise. It can hold articles, image carousels, and short-form and long-form videos, and all of them are effective in varying degrees. If you have a piece of content to share, not only is organic social media super accessible and cost-free, but it’s also very effective.
18. 45% of customers follow brands on social media mainly for their content
Content can grant you visibility. But it can also create a dedicated and loyal fan base for your brand. According to Sprout Social’s 2024 study, 45% of customers who follow brands’ social media accounts do so simply because they like their content.
While their main reasons are still to learn about products and promotions, having content preference in the third spot is significant. It signals that customers are increasingly seeing brands not just as businesses, but also as worthy sources of information, which is good news for your content strategy. It means as long as you continue sharing relevant, high-quality content, your customers will likely keep coming back.
19. 55% of marketers use Facebook most for sharing content
While handfuls of social media apps have cropped up in recent years, from Threads to BeReal, none have been able to topple Facebook’s throne just yet. Surveys show that 55% of content marketers use Facebook to promote their content, more than any other social platform, although Instagram falls just behind at 54%. With Facebook still being the most populous social media platform, it’s not hard to see why.
But it’s not just Facebook’s population size propelling it to the top. Facebook allows for diverse content types, from blog links to live videos. And, it has plenty of ways for users to engage with that content, such as shares, comments, and even Facebook group discussions, all of which can significantly grow your social media presence.
Here are some ways you can leverage your content marketing on Facebook:
- Optimize your business’ Facebook page by adding a bio, photos, and contact info
- Join and engage with relevant Facebook groups
- Use Meta Business Suite to plan your content
Find out more about Facebook marketing in our list of Facebook Page marketing strategies.
20. 34% of social media users dislike brands that self-promote too often
A core aspect of content marketing on social media (or on any other platform) is making your content all about your audience—their interests, needs, and concerns. Content marketing only works when the content is valuable to your audience. That’s what makes them interested in your brand.
This is also reflected in new research: Hootsuite found that 34% of social media users feel negatively about brands that self-promote too often. Whether it’s constantly posting about your products or talking about how good your brand is, constantly mentioning your brand will only cause your audience to turn to your competitors instead.
The data is crystal-clear: Content marketing thrives when it’s authentic, high-quality, and relevant to your audience. Instead of making it about you, turn the spotlight on your audience. Offer them content they want to read and consume.
Content Marketing Strategy & Trends Statistics
Content marketing as a practice is constantly changing. What held true a year ago can be completely different today. For example, artificial intelligence (AI) has made one of the biggest, industry-defining impacts in recent years. As a business owner, being an effective content marketer means staying on top of these trends to craft your content strategy. Here are stats about content marketing strategy and trends to help you out:

21. Over 52% of marketers used AI to create content in 2023
If you’ve been online at all in the past year, you’ve probably heard of a little thing called AI. It’s one of the biggest developments to have come out recently and is already steadily changing how businesses work. One of its biggest impacts is in marketing, particularly through generative AI, which is AI that creates content like text, images, and even videos.
And marketers are already taking advantage of these new tools to streamline content marketing processes. According to Statista, over 52% of marketers said they used generative AI to draft content in 2023. It’s not a surprising statistic: Content marketing takes lots of creation, often more than one person can handle, and AI can be a significant help. However, it’s also far from perfect.
Here are some ways to leverage generative AI effectively in your content marketing:
- Choose the right AI tool for your needs, whether your goal is copywriting or keyword research (we have a guide to the 8 best AI marketing tools that can help)
- Learn how to write good prompts so your AI tool can get a clear idea of what you need
- Always, always, edit AI-generated drafts to add a human touch and nuance
Find out more about what AI content marketing is, how it works, and how to apply it to your business. Plus, find out 12 other ways to use AI for small business marketing.
22. 62% of consumers are less likely to engage with AI-generated content
While enthusiasm for generative AI among marketers is high, still proceed with caution. Recent surveys found that 62% of consumers said they were less likely to engage with content on social media if they knew it was generated by AI.
While it’s progressing at the speed of light, the perception of AI is currently at a bit of a stalemate. While businesses are implementing AI tools at record speed, public consumers are still divided about AI use, and recent studies show that the majority still have significant apprehensions, particularly among older generations (Gen Z consumers generally feel more confident about AI).
AI is still developing every day, and the key is to always use it in collaboration with human teams. Instead of relying 100% on AI tools for tasks, use them to support and enhance your workflows. AI is at its best when its efficiency and accuracy are combined with human nuance and emotional intelligence.
23. 47% of content marketers say audience research is the biggest factor in their success
So much of content marketing hinges on knowing your audience, especially their interests, pain points, and habits. In fact, it’s the number one factor in its success. A survey found that 47% of marketers said audience research was the biggest factor in the success of their content marketing strategy. This placed higher than SEO or competitor analysis.
It’s been said before, and it’s worth repeating: A significant portion of your content marketing strategy should be constantly researching your audience to address their needs. And this research goes beyond data like age and demographics. You should also be able to pinpoint their questions and concerns to craft a detailed customer persona.
Here are some ways to help your audience research:
- Find out their most-searched keywords (keyword research tools can help here)
- Do social listening (aka finding out what they’re discussing on social media)
- Use old-school research methods like surveys, interviews, or group discussions
24. Personalizing content can lead to a 120x increase in ROI
After audience research comes audience personalization. This is simply targeting and personalizing your content so it caters to each member of your audience. This makes your content marketing feel less like marketing and more like valuable, authentic content. It’s also overwhelmingly effective: marketers say personalized content can lead to up to a 120x increase in ROI.
Personalization is also generally effective: 94% of marketers said it helps increase sales. Think about it: if you get a newsletter in your inbox addressing you by name with content tailored specifically to your interests, you’ll probably find it far more interesting than a generic one. It’s the same for your customers, and it can eventually turn them into loyal fans of your brand.
The good news is many marketing tools now support personalization. For instance, on social media, you can target your posts by location, demographics, and even by interest. Most email marketing platforms can also incorporate your recipients’ names. Meanwhile, for blogs, keyword research is the best way to know what your audience is searching for online.
Frequently Asked Questions (FAQs)
Content marketing should be part of your small business’ marketing strategy because it’s affordable, relatively simple, and most of all, effective. This is because it’s a more organic form of marketing that builds on trust rather than on superficial incentives, which can form much stronger bonds. Content marketing is also diverse, encompassing blogs, images, audio, and video, is possible on many platforms, and has almost no barrier to entry.
Statistics show that content marketing can be one of the most effective strategies to increase customers’ purchase intent and lifetime value. It’s also been proven effective at increasing website traffic, boosting brand awareness and engagement, and generating leads, although it may take longer than paid strategies like advertising or partnerships. However, because content marketing is organic and built on trust, it forms deeper connections with your customers.
No. In fact, content marketing is one of the most affordable forms of marketing. You can even do it for free. For instance, you can start blogging on a free blogging platform and then share your blogs on your brand’s social media accounts, all at no cost. Many email platforms also have free plans to start with. Videos and podcasts will only require minimal production costs at most. More than anything, content marketing will cost you constant time and effort.
Bottom Line
The content marketing statistics above all point to the same conclusion: Content marketing is as relevant as ever, and is a worthwhile investment for your small business. It’s effective, simple enough, and costs almost nothing to start.
However, content marketing is also constantly evolving with new trends that you’ll need to stay on top of. Use the content marketing stats above to help you get started, and then partner with one of the best content marketing services to help you along.