Entrepreneurship is almost always on the rise, and recent data reveals there’s good and bad news—all of which is important to know in supporting your entrepreneurial endeavors. We’ve divided these key entrepreneurship stats into seven overall categories to help guide your current and future entrepreneurial decisions.
General Entrepreneurship Statistics
1. There are over 98,000 entrepreneurs in the US
According to Zippia’s database of profiles, there are 98,183 entrepreneurs currently employed in the US. This estimate was cross-referenced against data from the U.S. Bureau of Labor Statistics (BLS) and the Census Bureau as well as current job openings.
2. 5.5 million new business applications were filed in the US in 2023
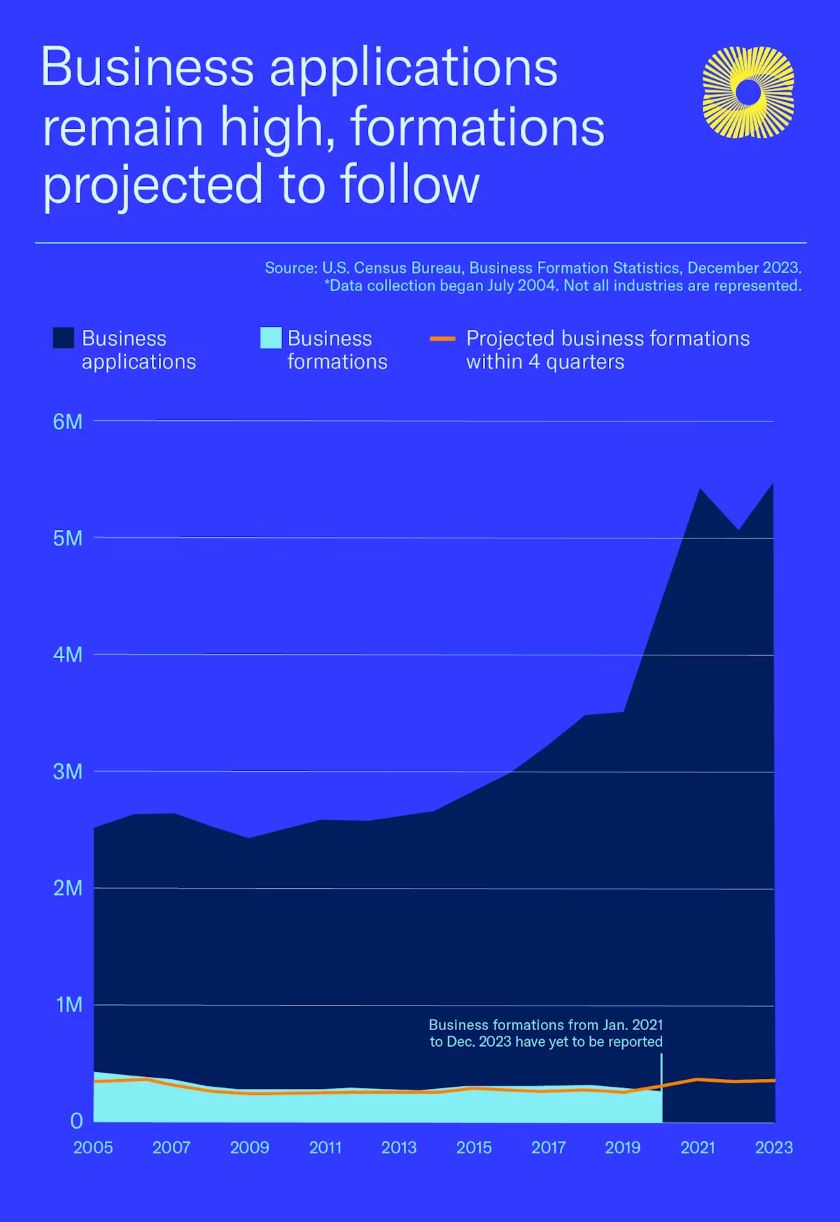
According to the U.S. Chamber of Commerce, 5.5 million new business applications were filed in 2023—a current record. The number of businesses started in any economy is usually a strong economic indicator. Applications doubled back in 2020 and have maintained an upward trajectory since. State-specific statistics about entrepreneurs indicate that Colorado had the highest growth rate of new business applications.
3. About 9.5% of business applications lead to business formation
Business applications don’t always result in business formations. In fact, less than 10% of applications actually come to fruition. Of the 20.4 million business applications filed between 2020 and 2023, about 1.9 million businesses were formed.
(Source: U.S. Chamber of Commerce)
4. 14.7% of people own a business
In 2023, just shy of 15% of people say they own a business—14.7% to be exact. This is a slight increase from 14.1% in 2022. When it comes to freelancing, 22.2% claim to be a freelancer in 2023, up from 21.1% in 2022.
5. 34.4% of people have thought about starting a business
Over one-third of people have considered starting a business at some point—however, many don’t end up pursuing their entrepreneurial aspirations. For others, they may have started a business before but have become withdrawn for a variety of reasons. Many withdrawn entrepreneurs have previously owned a business or done freelance work.
6. 36.6% of entrepreneurs have prior experience
While many have had business ownership or freelance experience in the past, most business owners are doing it for the first time. However, one of the interesting facts about an entrepreneur is that 36.6% say they have had previous experience. Entrepreneurs with prior experience earn higher revenues than those without. Nearly a third of entrepreneurs with no previous business experience earn at least $100,000 in annual revenue compared to 23% of business owners with no previous business.
7. 31.8% of entrepreneurs have multiple businesses
One-third of entrepreneurs own multiple businesses. These business owners also tend to fare better, with higher revenues. Additionally, there’s a correlation between the number of years of experience and the percentage of successful entrepreneurs—more experience leads to higher revenues, more employees, and larger business size. About 35% of entrepreneurs with multiple businesses have at least 20 employees, for example.
8. 57% of entrepreneurs have no leadership experience
Most entrepreneurs lack leadership experience. Just 43% say they have some leadership background. However, it’s valuable experience to have. Of entrepreneurs with five to nine years of leadership experience, 31% have at least 20 employees and 28% of those with 10+ years of leadership experience earn at least $100,000 in annual revenue.
9. North Carolina, Virginia, and Tennessee are the top states for business
The rigorous criteria and methodology that go into this publication include scoring the states on the cost of doing business and state infrastructure, as well as life, health, and inclusion, which covers health care in general and the corporate push for inclusiveness. Other analyses also identify Texas, California, and Florida as great states for entrepreneurs.
Entrepreneur Success Rates
10. 20%–22% of small businesses fail within the first year
Failure rate entrepreneurial statistics have discouraged people for years, but this myth-busting stat from BLS data is one you can trust. On average, 30% of businesses will have failed by the end of their second year, and half will have closed their doors by the end of the fifth year. After a decade, only about a third of businesses will remain.
11. Physical businesses earn $105,000 in revenue in their first year
It’s not rare for entrepreneurs to earn six-figure revenues in their first year of business. Entrepreneurs with a storefront average $105,000 in revenue in their first year. Mobile business owners average $100,000 and online entrepreneurs earn an average of $50,000.
12. 15% of entrepreneurs are profitable in their first year
Six-figure revenues don’t necessarily equate to profitability, and it often takes more than a year to turn a profit. In fact, only 15% of entrepreneurs are profitable in their first year. Another 40% of entrepreneurs are profitable in their second year of business.
13. Most new businesses are in retail trade
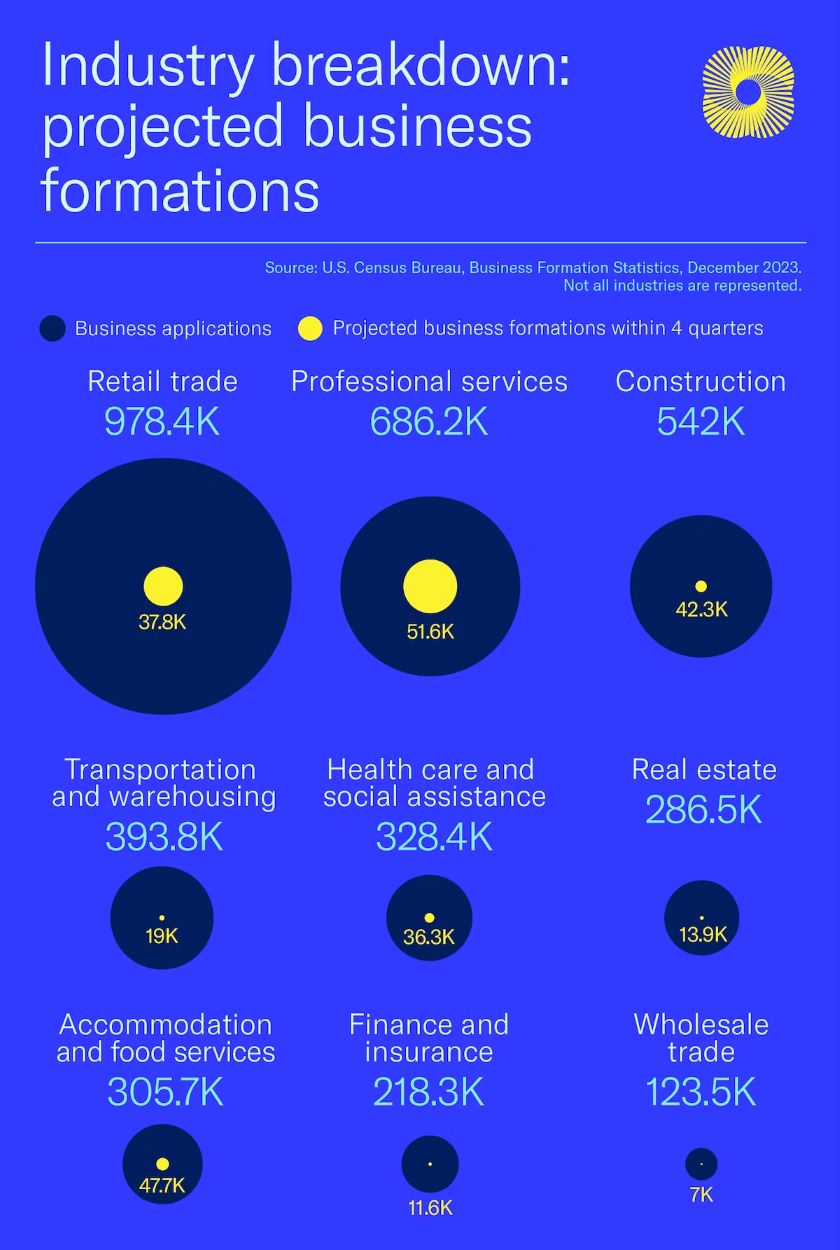
In an industry breakdown, the top category for new businesses in 2023 was retail trade—there were 978,400 business applications, of which 37,800 are expected to actually come to fruition. Other top categories include professional services, construction, transportation and warehousing, and healthcare and social assistance.
(Source: U.S. Chamber of Commerce)
14. Most entrepreneurs get into franchising
Franchising is a proven way to get into entrepreneurship. In fact, it’s the top business type for entrepreneurs in 2024—32% of small businesses are new franchises. Another 10% are purchases of existing franchises.
Here are some more resources to check out if you’re interested in franchising:
- 11 Best Websites to Find Franchises
- 19 Best Franchises Under 10K
- 7 Best Franchise Marketing Agencies for Growing Your Location
- 25 Best Home-Based Franchises
Entrepreneur Sentiment Statistics
15. 28% of polled entrepreneurs credit being “ready to be their own boss” as the reason for starting a business
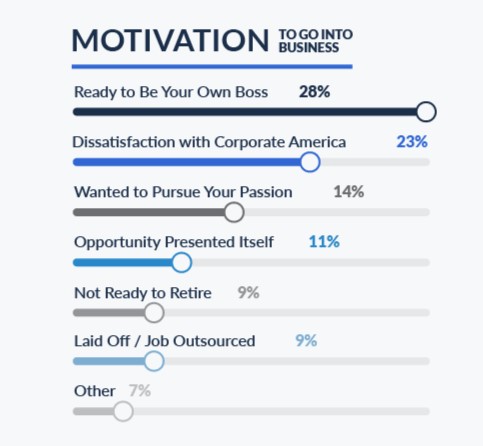
Here are some empowering statistics on entrepreneurship: The top reason for turning to entrepreneurship is the goal of being your own boss. Other motivations include dissatisfaction with corporate America (23%), pursuing a passion (14%), and an opportunity presented itself (11%).
(Source: Guidant Financial)
16. 36% of entrepreneurs are very happy
Entrepreneurship seems to be a rewarding career path, bringing people happiness. More than a third (36%) are “very happy,” another 37% are “somewhat happy,” and 15% are neutral. Only 8% are “somewhat unhappy” and 4% “very unhappy.”
17. 34% of entrepreneurs are somewhat unconfident about today’s economy
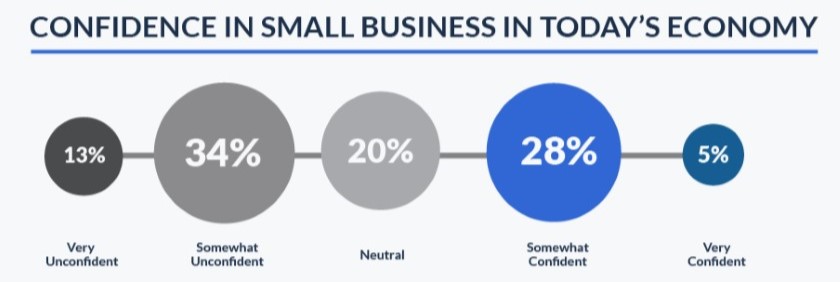
While most entrepreneurs are happy with their decision, there are mixed feelings about the state of the economy and its impact on small business. Just over a third are “somewhat unconfident” while 28% are “somewhat confident.” One-fifth are neutral, 13% “very unconfident,” and 5% “very confident.”
(Source: Guidant Financial)
18. Most (77%) entrepreneurs expect to survive today’s economy
Optimism reigns supreme. More than three-quarters expect their businesses to survive the economy. Just under 20% are unsure, and only 5% believe their business won’t survive.
19. 56% of entrepreneurs report higher revenues in 2022 than in 2021
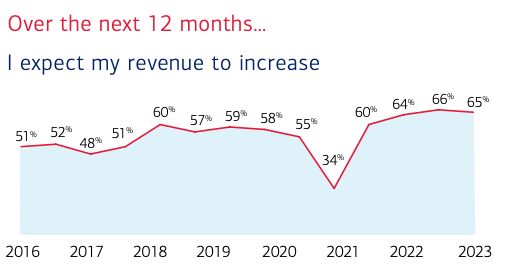
Despite perceived or actual economic downturns, entrepreneurs are doing well. According to one survey, more than half reported higher revenues in 2022 than the year prior. When asked if they expect to continue on this trajectory, 65% said they believe their revenue will increase over the next year.
(Source: Bank of America)
Demographics & Minority Entrepreneur Statistics
20. 74% of small business owners are male; 26% are female
The number of female entrepreneurs is on a slow but steady growth trajectory. The majority of entrepreneurs—just under three-quarters—are male.
21. Most small business owners are Gen X
In terms of age, Gen X (born 1965–1980) is the largest group of entrepreneurs—there are 12.6 million, or 47% of all entrepreneurs. Baby Boomers account for 37% of entrepreneurs, and millennials contribute 16% of entrepreneurs.
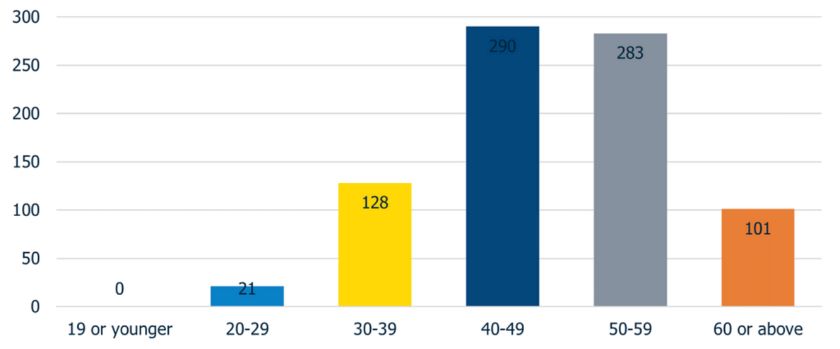
22. 69.6% of entrepreneurs are 40–60 years old
Numerically speaking, most entrepreneurs fall into the 40- to 60-year-old range. This correlates to Gen X entrepreneurs. The least likely group to be an entrepreneur is young women.
(Source: Eurochambres Women Network Survey 2023)
23. 44% of entrepreneurs have a bachelor’s degree
Advanced education isn’t necessarily required to become an entrepreneur, but there does appear to be a statistical relationship. Of entrepreneurs, 44% have a bachelor’s degree, 27% a master’s, 15% a high school diploma or GED, 11% an associate degree, and 4% a doctorate.
24. Black entrepreneurs are the largest subset of minority entrepreneurs
In a breakdown by ethnicity, white and Caucasian people make up 79% of entrepreneurs. In terms of minority ethnicities, Black is the largest group—accounting for 6% of entrepreneurs. Another 5% of entrepreneurs are Hispanic and 3% Asian.
25. The number of people of color who are entrepreneurs increased by 13%
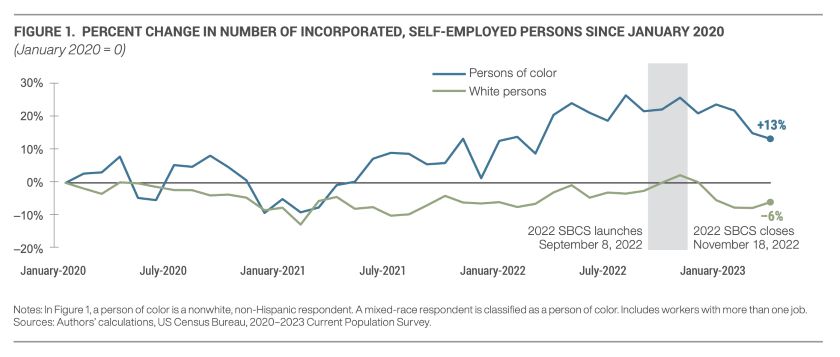
While white and Caucasian entrepreneurs still make up the majority, Black entrepreneurs and people of color are making gains. From January 2020 to April 2023, the number of self-employed people of color grew from 1.7 million to 2 million, a 13% increase. The number of self-employed white entrepreneurs decreased by 6% during the same period—from 5 million to 4.7 million self-employed workers.
(Source: FED Small Business | 2023 Report on Startup Firms Owned by People of Color)
26. Entrepreneurs of color are 10% less likely to have $100,000 annual revenue
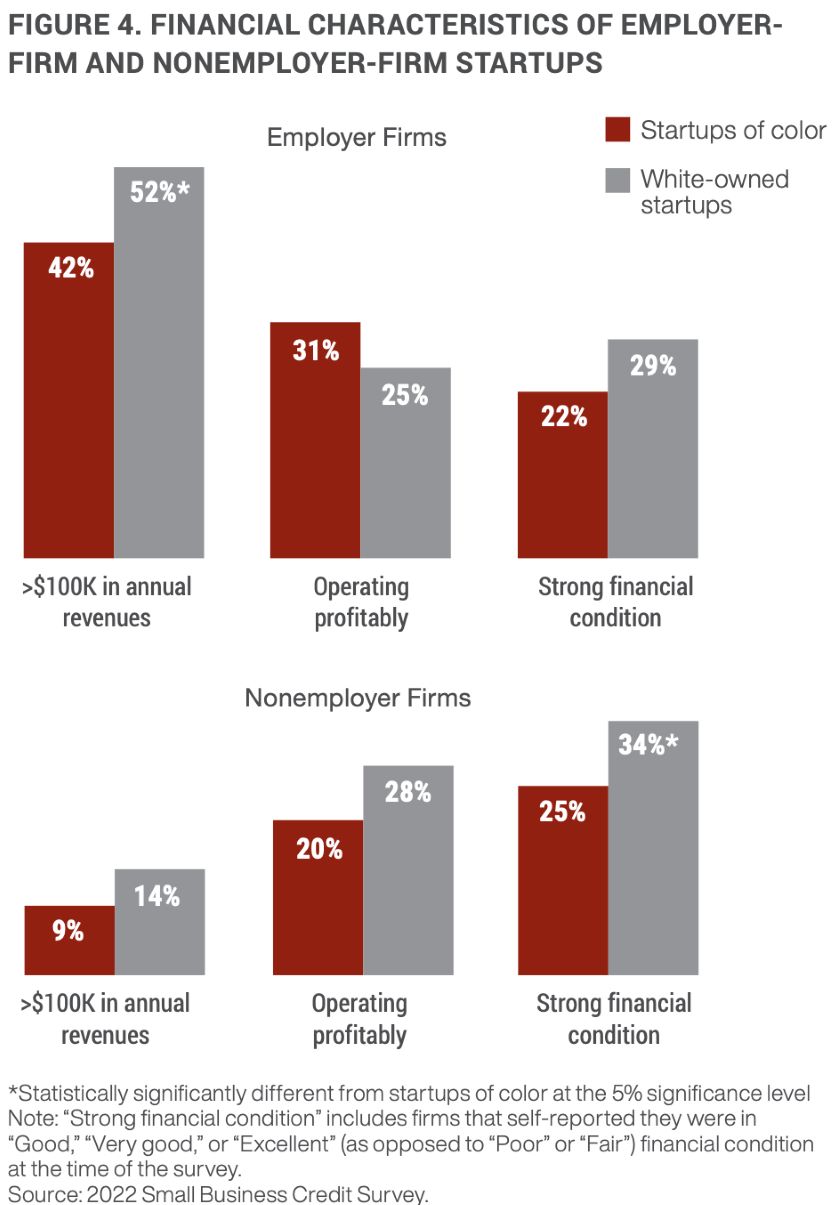
Compared to white entrepreneurs, people of color are 10% less likely to earn annual revenues of at least $100,000. Specifically, 42% of entrepreneurs of color will exceed $100,000 annual revenues, while 52% of white entrepreneurs will do so. However, 31% of entrepreneurs of color are expected to earn a profit, compared to just 25% of white entrepreneurs.
(Source: FED Small Business | 2023 Report on Startup Firms Owned by People of Color)
27. Entrepreneurs of color are more likely to hire
When it comes to entrepreneur trends regarding hiring staff, entrepreneurs of color are more likely to do so than white entrepreneurs. In fact, Black entrepreneurs who hire staff are 9% more likely than white entrepreneurs to add to their team over the next year—and currently, non-employing entrepreneurs of color are 21% more likely than non-employing white entrepreneurs to hire in the next 12 months.
28. Nearly 2.5 million American businesses are veteran-owned
In the US, about 2.5 million businesses are veteran-owned, representing about 9.1% of all US-based businesses. Veteran-owned businesses in the US employ over 6 million workers and earn more than $1 trillion in revenue each year. However, the number of veteran entrepreneurs is on a slow decline.
Entrepreneurship Challenges
29. Over 30% of entrepreneurs say starting a business is one of the hardest things they’ve done
Though it’s a rewarding journey for many, nearly a third of entrepreneurs say starting their business is actually one of the most difficult things they’ve ever done.
30. 48% of white-owned businesses get funding from financial institutions
External funding is a great way to start an entrepreneurial venture. Many entrepreneurs go for banks and related financial institutions. However, funding is skewed toward white entrepreneurs: 48% of them have been able to secure funds from financial institutions, compared to just 28% of entrepreneurs of color.
31. 20% of entrepreneurs say inflation is the most important problem
Funding isn’t always the biggest financial hurdle. In fact, one-fifth of entrepreneurs say their most important problem is inflation. This is especially so because it’s outside of their control. Other top challenges include labor quality and labor cost.
Costs of Being an Entrepreneur
32. More than 50% of entrepreneurs underestimate their expenses
According to one survey, more than half of entrepreneurs feel they underestimated their first-year expenses. They didn’t realize how much they would have to spend to be able to make money.
33. Physical businesses spend $100,000 in their first year
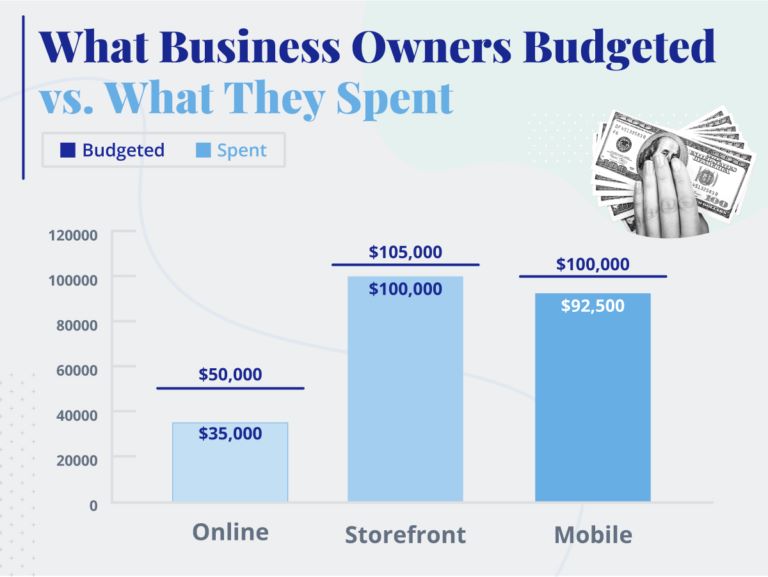
Entrepreneurship isn’t necessarily free. Those with a physical storefront spend about $100,000 in their first year, though they budget for $105,000. Mobile entrepreneurs spend $92,500 and budget for $100,000, and online entrepreneurs spend $35,000 while budgeting for $50,000.
(Source: Business.org)
34. 30% of entrepreneur expenses go to equipment in their first year
Of entrepreneur expenses in the first year, most (30%) go to inventory. Here’s a full breakdown of average first-year expenses for entrepreneurs:
- Inventory 30%
- Equipment 21%
- Location 15%
- Taxes 12%
- Utilities 7%
- Payroll 6%
- Marketing 3%
- Research 2%
35. 46% are surprised by tax expenses
While many of the first-year expenses are expected and planned for, 46% of entrepreneurs are surprised by how much they have to pay in taxes. Others were surprised by technology investments (43%) and costs (40%), and 39% by shipping costs.
36. 39% of entrepreneurs fund their business with personal savings
Just shy of 40% of entrepreneurs fund their first year of business from their own personal savings. This is the top source of funding for new ventures. Another 34% use a personal credit card, 33% use a personal loan, and just 30% qualify for traditional small business loans.
Resources & Funding for Entrepreneurs
37. The SBA loaned $27.5 billion in 7(a) loans in 2023
Small Business Administration (SBA) loan stats for 2023 are:
- 7(a) loans: 57,300 7(a) loans worth $27.5 billion—nearly 70% were small-dollar loans of $350,000 or less; the SBA originated 45% more loans under $150,000 in 2023 than each of the three years prior
- 504 loans: More than 5,900 fixed-rate loans for equipment, real estate, and debt refinancing worth more than $6.4 billion
- Microloans: 5,500 loans worth $87 million—35% went to Black-owned businesses and 15% to Latino-owned businesses
If you need help searching for loans for your entrepreneurial endeavor, check out these resources:
- SBA Express Loans: What They Are & How to Apply
- How to Get an SBA Loan in 4 Steps
- What Is SBA Form 159 & How to Fill It Out
- How to Get an SBA Startup Loan in 6 Steps
- SBA Form 1919: What It Is & How To Complete It
- Understanding the SBA Guarantee Fee
- How to Get an SBA Restaurant Loan in 6 Steps
38. The SBA loaned $1.5 billion to Black-owned businesses in 2023
In 2023, the SBA loaned funding to lots of minority-owned businesses. Take a look at the stats:
- Black-owned businesses: 4,700 loans totaling $1.5 billion—more than double since 2021
- Latino-owned businesses: 7,700 loans totaling $3 billion—double the number of total loans and an 80% increase in loan dollars from 2021
- AAPI-owned businesses: 7,500 loans exceeding $6.4 billion—a 44% increase in total loans and 36% increase in loan dollars from 2021
- Native-owned businesses: 500 loans totaling $278 million—a 70% increase in total loans and nearly double the amount of loan dollars from 2021
- Women-owned businesses: 13,000 loans totaling $5 billion—a 70% increase in total loans and 61% increase in loan dollars from 2021
- Veteran-owned businesses: 2,800 loans totaling $1.2 billion—a 33% increase in total loans and 40% increase in loan dollars from 2021
Here are some further resources for SBA funding:
- SBA Community Advantage Loan: What It Is & How To Apply
- SBA Loan Requirements
- Current SBA Loan Rates
39. The SBA delivered $670 million in relief in 2023
In 2023, the SBA helped more than 5,200 small businesses with disaster assistance funds. It delivered $670 million in relief in 2023.
40. The USDA’s Rural Microentrepreneur Assistance Program has dispatched $68 million in loans and $17 million in grants since 2008
The United States Department of Agriculture (USDA) has stimulated rural economic development and helped decrease poverty with various similar business programs directed at socially disadvantaged groups, nonprofits, institutions of higher education, rural businesses, and federally recognized tribes. Rural entrepreneurs should be aware of these resources.
41. InBIA’s network of entrepreneurship centers has grown to 1,200 member centers in 30 countries
The International Business Innovation Association (InBIA) is a global nonprofit that facilitates entrepreneurship support across the globe. Its centers include incubators, accelerators, hubs, and coworking spaces at Small Business Development Centers (SBDCs), nonprofits, government and economic development organizations, and universities the world over.
42. There are almost 20,000 coworking spaces worldwide
In addition to providing needed resources for entrepreneurs, coworking spaces are good for communities and economies. According to Statista, there are 19,345 coworking spaces worldwide. Each facility has an average of 185 members.
Frequently Asked Questions (FAQs)
These are some of the most common questions we encounter about entrepreneurship statistics and trends.
According to data from Zippia, there are around 98,183 entrepreneurs in the US. This data is based on the site’s analysis of its 30 million profiles, cross-referenced with BLS, Census, and current job openings data.
Somewhere between 20% and 22% of entrepreneurs fail in new business ventures.
Somewhere between 78% and 80% of entrepreneurs succeed in new business ventures.
Bottom Line
Entrepreneurship is so much more than knowing your craft—it’s knowing the environment, the customer, and the changes to both. Keeping abreast of entrepreneurship statistics, data, and trends can help any entrepreneur start and stay sharp in the modern day.