Sales reports provide business activity and performance information to make operational adjustments and strategic decisions. Creating effective reports involves identifying objectives, audience, and time frame, then pulling information from your sales data sources for analysis. In this article, you’ll learn how to create a sales report and the common types of reports you can use for insights.
Free Sales Report Template
Reporting on sales and customer service operations is tricky without the right resources. For that reason, we’ve developed a free sales report template for users to organize and evaluate their data. While you can use this downloadable sales report template in Excel and Google spreadsheet formats, you can also generate reports directly with many customer relationship management (CRM) systems that come with reporting and dashboard tools.
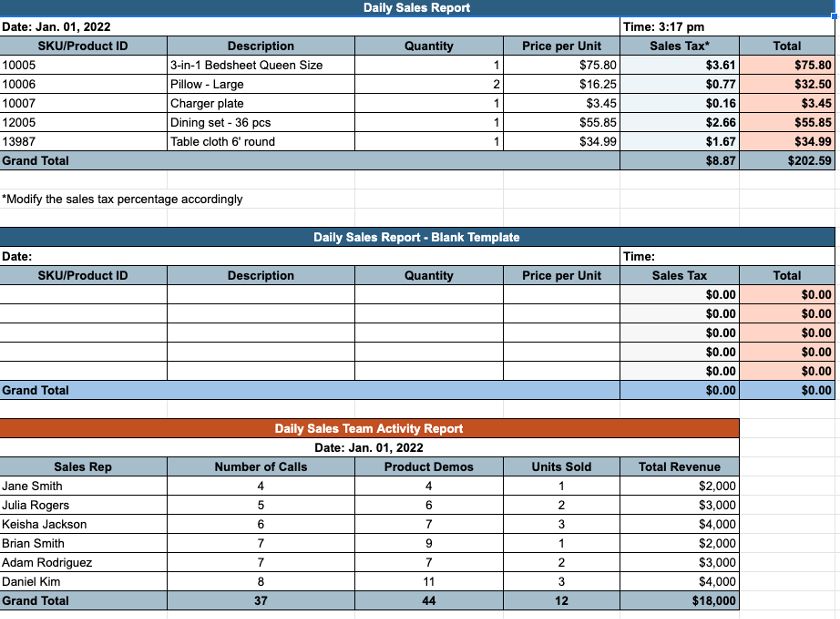
Thank you for downloading!
💡 Quick Tip:
While spreadsheets can be good tools for creating a sales reports, a customer relationship management (CRM) system can automate much of the work for you.
CRMs like Freshsales have sales reporting tools that quickly and easily allow sales managers to create sales reports and dashboards.
Whether you’re using our Excel sales report template, a CRM system, or a separate data intelligence tool for report generation, you’ll ultimately follow the same progression. Here are the nine steps in developing a sales report, from determining what information you’ll need to pull all the way to extracting insights and making data-backed decisions.
1. Determine Report Objectives
Before you start playing around with the tools in your reporting software, you must first decipher the value you intend to extract by generating the sales report. In other words, determine your sale report objectives. For this step, it’s best to work backward from the desired result, ultimately the primary objective. Some report objectives examples include:
- To ensure performance is on pace for sales goals: You may simply want to see how well your team is performing in terms of revenue generated or deals closed over a month, quarter, or whole year. More specifically, whether or not you’re on pace to hit a specific target or goal.
- To hold individuals and teams accountable for activity input: Sales activity, such as calls made, emails sent, proposals generated, and meetings held, typically have a positive correlation with performance. For instance, a weekly sales report tracking activity can tell you who is hitting their weekly input numbers and who isn’t. Use sales activity quotas in addition to production goals for each rep or team of reps.
- To predict future performance and plan expenditures: This particular objective can be fulfilled with a specific type of report known as a sales forecast. The idea is you can predict the amount you can spend for the next time period, typically a quarter or year, based on an estimate of revenue you expect to generate in the future.
- To evaluate top talent in your sales team: One of the great things about sales is how objective it is to determine top performers. Certain reps will put more activity in, produce more revenue, and close more deals than others, which is a great indicator of talent. You can use individual performance sales reports to see who your star reps are when giving out bonus incentives or deciding on promotions.
- To optimize operational efficiency: Like other business functions, sales operations is a system successful teams continually optimize. The more efficient the system is, the better it will perform in terms of deals and revenue. Because businesses often have a consistent sales process with the same repeatable stages, managers can use a sales report to find process bottlenecks to make adjustments or add additional resources.
Pro tip: Before generating a sales report to see how your team is performing, develop a sales process that’s repeatable, efficient, and easy to comprehend. Start generating yours using our guide on how to create a winning sales process.
2. Identify Your Sales Reporting Audience
Once the report objectives are set, you’re ready to determine which audience will have report access. Keep the idea of least privilege in mind, where only those who need the report information to do their jobs effectively should have access to it. For instance, if your objective is to justify pay raises based on individual rep performance, only managers and perhaps a human resources (HR) rep should have report access and not, say, a sales enablement specialist.
For the most part, sales managers will always be the ones generating these reports. Then, depending on the objective, other stakeholders could be involved. These include members of the board of directors, C-suite leaders, or managers in other departments like marketing, customer service, HR, or product management. Knowing your audience allows you to pull relevant metrics and data.
As an example, when reporting to a board of directors, they’ll want to see if current performance is meeting their strategic goals. Therefore, they’ll likely want to see revenue performance in relation to a preset sales goal, as well as performance comparison between sales territories. Smaller details like the number of calls a specific sales rep makes each week will not be as relevant to them.
3. Set Your Time Frame
Setting a time frame for your report ensures the information is full and relevant. Your objective, for the most part, dictates the time period you want to evaluate. For example, evaluating individual talent or organizational performance based on a few daily sales reports doesn’t make much sense. You may also have a standard procedure set by an executive or director for providing them quarterly or monthly sales reports.
Having a set time frame also enables you to properly extract and filter out data from your data sources. For example, if you want to see sales pipeline conversion rates for Q1 of 2023, you can filter out information in your database or application to exclude data points from other quarters.
4. Find & Filter Data Sources
Since reporting is simply compiling information into a viewable format, finding and filtering your data sources is a huge step. A data source is anywhere sales data is stored, like an application or database. You may have contact and deal information in a CRM system, track sales activity in a project management tool like monday.com, or use a basic Excel spreadsheet to store contact data and monitor everything.
Regardless, you need to have those data sources ready, as well as the subsources within those systems. For example, certain applications like CRMs will have modules that host tools and information for particular sales areas, and, therefore, store specific data. Freshsales, for instance, has premade modules for accounts, contacts, deals, and leads, plus options to customize modules based on unique business needs.
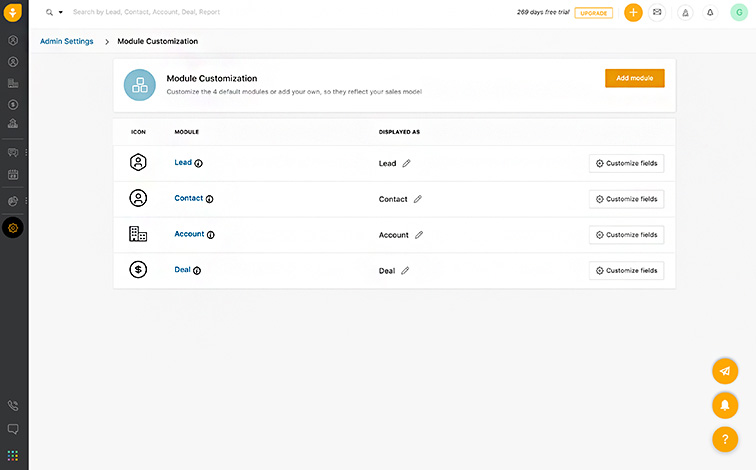
Freshsales module customization page (Source: Freshsales)
In addition to sales reporting capabilities, Freshsales has an array of lead, account, and deal management features. See if it’s right for your business by reading our Freshsales CRM review.
5. Pull Information
Once you have your data sources ready, start adding information to the report per your objectives, audience, and time frame. CRMs come with solid reporting tools that let users easily pull data from specific modules and filter it out based on a time frame or condition. From there, they can generate a report as a file or view the information on the interface dashboard.
HubSpot, for example, lets users obtain information from specific modules, such as contacts, deals, or tickets. From there, users can decide which metrics they want to evaluate. For example, they might pull deal conversion rates from the deals module or total leads generated from the contacts module. Once they’ve pulled and filtered the data from the source, they can incorporate targeted metrics and visuals to present the data.
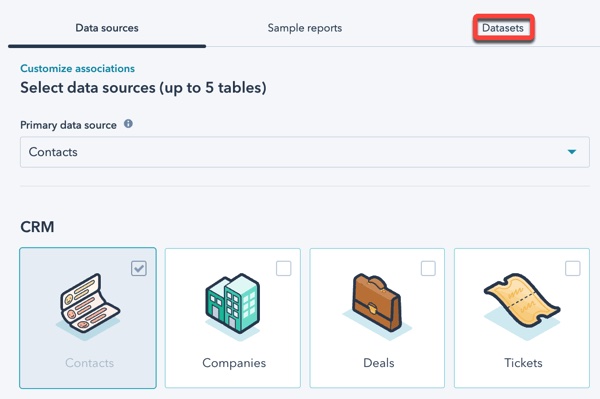
HubSpot selecting data sources for a report (Source: HubSpot)
HubSpot is a highly intuitive and robust reporting system that also has excellent features for sales, marketing, service, and content management. To see if it’s a good CRM for your business, check out our in-depth HubSpot CRM review.
6. Incorporate Your Sales Plan & Goals
If you aren’t comparing metrics between individual reps, teams, territories, prior time periods, or sales goals, it’s tough to have any context or a frame of reference surrounding performance data. For example, just having a dataset and report show $100,000 in new revenue doesn’t mean anything. Having a dataset, however, showing $100,000 in new revenue in comparison to a $60,000 revenue goal does mean something—you beat your sales goal.
Incorporating a sales plan or targets into your reports is essential for proper context. It also helps you better understand your data in relation to your objectives. For instance, you can evaluate a sales rep in comparison to their peers to see if a pay raise is warranted or monitor a lead conversion rate in relation to an industry average.
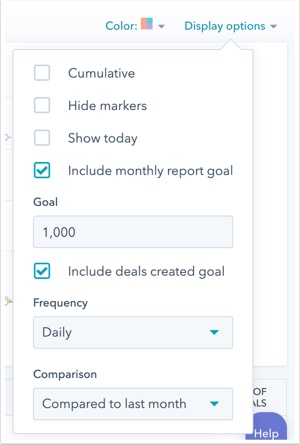
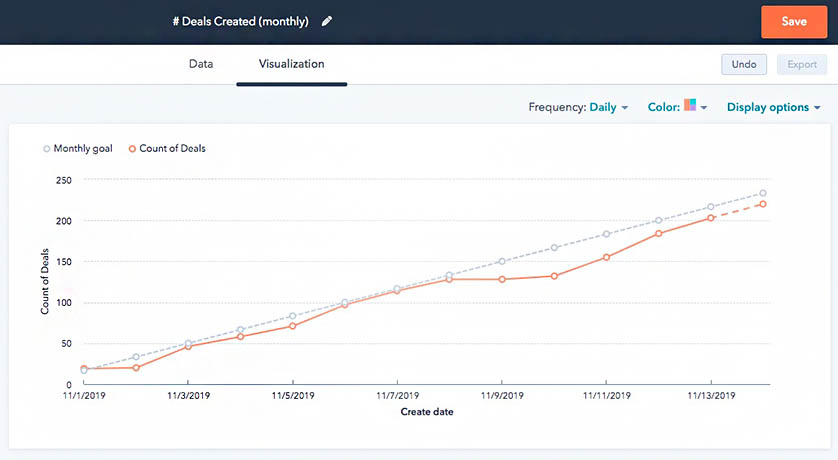
The most common contextual detail you’ll likely use, however, is a goal or quota. HubSpot’s reporting tools allow users to include goal metrics in their reports so the audience can visually compare activity or production to a specific goal on a desired frequency, like daily, weekly, or annually.
7. Format & Visualize Your Report
After your information is pulled and you’ve incorporated business context, start visualizing your report. This is where you convert your data points into a chart or graph, specifically one easily understood by your audience. Users can create sales reports as files to download and distribute or as a sales dashboard, which shows system data in real time as records are added and updated.
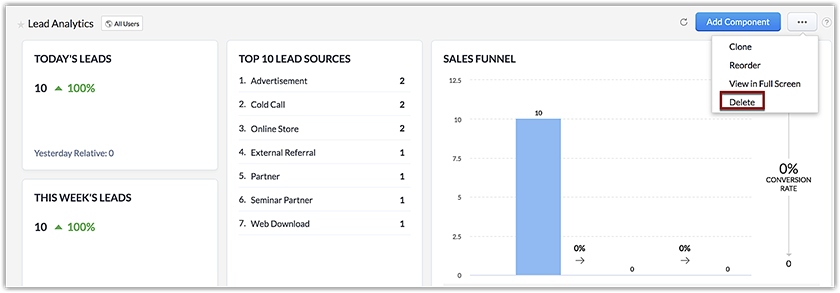
Most CRM systems will group visualization with the information-pulling step. HubSpot, for instance, allows you to select the chart type while configuring the type of data you want to be displayed. Similarly, users can create reports to display on their dashboards. Zoho CRM offers excellent dashboard and analytics tools for users to customize the metrics they want to monitor in real time on their system home page.
Like the idea of using Zoho for dashboard reporting? Don’t forget to check out our Zoho CRM review to learn more about its built-in features and ensure it’s a good fit for your business.
8. Analyze Sales Report Information
Merely creating your visual report isn’t enough to give you any value. You must interpret the information to find actionable insights for potential decisions. For proper reporting analysis, ask yourself three main questions:
- What does this report information mean?
- Why did it happen?
- What can I do next?
For example, let’s say you had a monthly goal to close three new sales deals per month. After generating a sales report, you found that you averaged only one new deal closed in the last six months. In this case, the meaning of the information is simple—you fell behind on deal-closing.
Next, you need to find out the “why.” Perhaps there were external factors, such as a weak economy preventing customers from spending as much. There could also be operational issues. For instance, after running additional reports, maybe you found your total leads generated were down, along with activity data like cold calls made. Alternatively, maybe your lead generation numbers were solid, but pipeline conversion rates were down.
Depending on the cause, make adjustments within your operation. In the deal-closing case, if the issue was low activity input, you’ll need to have conversations with reps to motivate your team. If lead generation was a problem, you could consider investing in a lead generation service that can bring in opportunities for you. For low conversion rates, you can implement training on new sales techniques to help boost those conversions.
9. Activate Your Data
The final step of developing a sales report is where you take your data analysis and activate it. Data activation refers to taking the initiative to make changes or additions to a sales operation or strategy based on your data intelligence.
For example, you may have added another sales rep to help meet lead demand, given a rep a promotion due to their performance, or implemented a sales automation tool to streamline one of your slower pipeline stages. Maybe you even added a new sales branch based on high forecast estimates to help meet scaling requirements.
After initially activating your data, repeat all the previous steps so you can re-evaluate your situation per your objectives. You want to ensure that the changes you made are working and whether or not you need additional adjustments.
Common Sales Reports for Small Business Teams
Whether you’re generating a sales report in Excel, utilizing our free sales report templates, or generating reports from a CRM, small businesses need various sales intelligence. Here are the most common sales report examples for small businesses to get key insights:
Objective: To evaluate individual, team, or organizational sales performance, such as revenue generated or deals closed. It is typically evaluated in relation to a goal, historic time period, industry standard, or other territories.
Summary: A sales performance report shows your performance in relation to a desired outcome, like sales revenue or total deals closed. This data will tell you if you’re on pace to hit a sales goal, are outperforming historical or industry standards, or whether one of your territories is far more effective than another.
Zoho CRM comes with report-creation tools for monitoring performance. Users can see how their team is doing in terms of revenue or deals generated by pulling data from relevant modules and populating it onto annual, quarterly, or monthly sales report templates. From there, they can compare performance to a goal, prior time period, or between specific reps or territories.
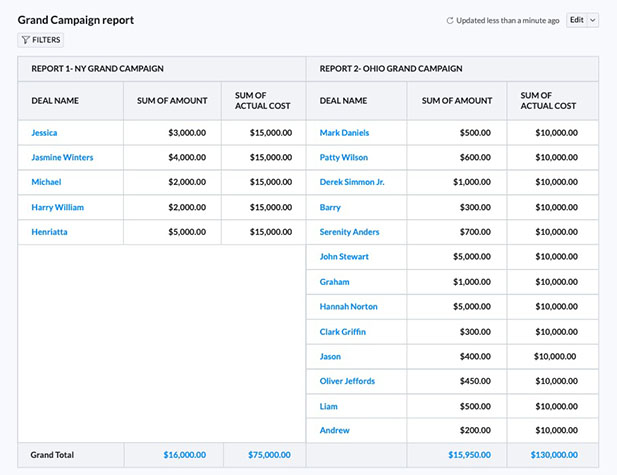
Zoho CRM revenue comparison between territories (Source: Zoho)
Objective: To estimate future sales revenue and determine resources scaling requirements or spending capacity.
Summary: Sales forecasts take current deal information or customer spending trends from your database to estimate how much revenue you’ll produce over a time period, such as a month, quarter, or year. Forecasts are essential if you plan to scale your business because they tell you how much income to expect for new expenses like adding personnel or other resources.
Most CRMs have forecasting tools built into the system, either for generating sales prediction reports or presenting forecasts as metrics on the dashboard. Some platforms also use artificial intelligence (AI) to help with forecasting accuracy. Freshsales, for example, has Freddy AI, which auto-suggests what sales deals can be committed to the forecast based on closing percentages and prior data analyzed.
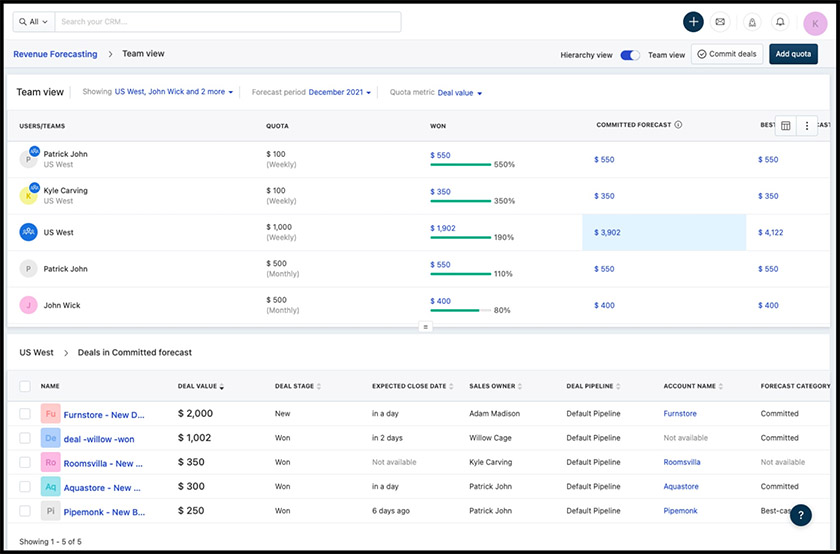
Freshsales deal-based forecasting (Source: Freshsales)
Objective: To identify sales process bottlenecks and improve operational efficiency.
Summary: Solid pipeline performance metrics are indicators for sales outcomes like total revenue. One of the best ways to evaluate a sales pipeline is through conversion rates—the percentage of opportunities or leads that go from one stage to the next. For instance, if you’re finding that you’re able to generate tons of leads but can’t get them into the proposal stage, there could be an unresolved issue that you need to look deeper into.
CRMs like Salesforce take system data, such as current deals, closed deals, and the number of deals in each pipeline stage, to see which stages are most efficient and which ones need improvements. Users can view this information in real time on the home dashboard or by generating a sales funnel report showing conversion percentages and total deal value in each stage.
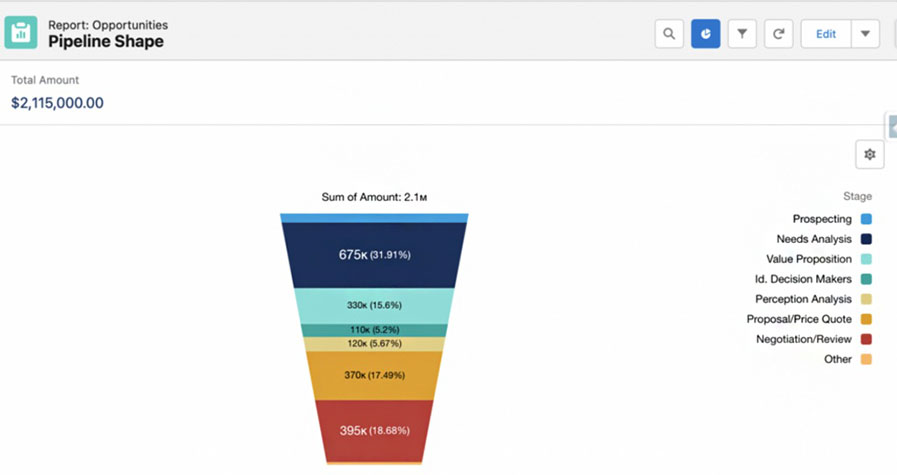
Salesforce pipeline analysis (Source: Salesforce Ben)
Salesforce is known for its robust analytics and reporting tools, powerful mobile app, and wide range of integration options. If those are must-have features for your business, check out our Salesforce review for more details.
Objective: To evaluate the total sales input of individual reps, teams, or the entire organization.
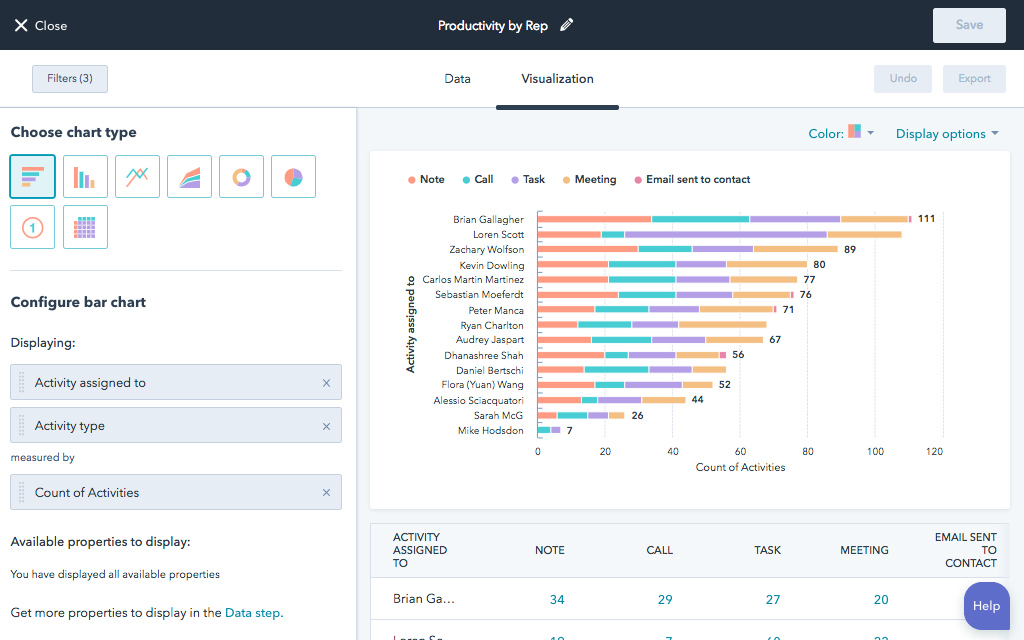
Summary: Sales activity reports show the effort put in by your sales team. While you can’t always control outcomes like deals closed, you can control how many calls you place, emails you send, and meetings you hold with prospects. Theoretically, more activity means higher sales production. The activity report will allow you to see who is putting in the most and whether reps meet daily, weekly, monthly, or quarterly sales quotas.
CRMs like Pipedrive are equipped with activity tracking features to monitor customizable sales activities, such as calls, prospect lunches, proposals generated, or email outreach. Users can then generate activity reports, filter out data based on activity type of time period, and compare metrics to other sales reps or teams.
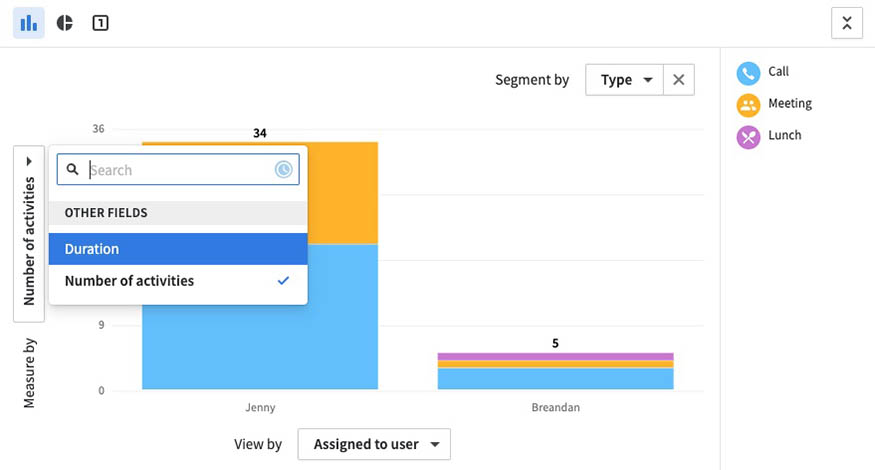
Pipedrive activity report by rep (Source: Pipedrive)
Like what you see with Pipedrive’s reporting features? Use our Pipedrive review to see if your team can get tons of value from the CRM.
Objective: To evaluate the performance of marketing or sales outreach campaigns either in relation to other campaigns or an historic time period.
Summary: Campaigns are attempts to use content and communications for brand awareness, lead generation, or nurturing. These can be through mass email, online ads, content, or social media posts. Alternatively, sales teams conducting cold calling outreach or making email introductions directly to prospects are also considered campaigns. These reports allow you to break down performance by a specific campaign to find what works or improve its content.
HubSpot offers powerful sales and marketing tools for teams to evaluate direct outreach and mass marketing campaigns. Users can report performance in comparison to other campaigns regarding leads or deals generated, or individually evaluate each campaign on a performance dashboard.
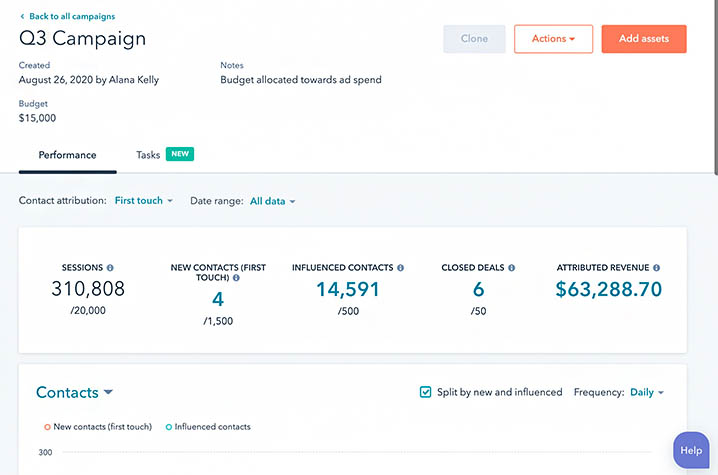
HubSpot reporting individual campaign (Source: HubSpot)
Objective: To understand customer service activity and performance for capacity planning and to improve operations.
Summary: In addition to using reports to improve sales operations, managers can also leverage reporting tools and analytics for customer service. Support can be measured using tickets, which represent an inquiry or request by a customer, and ticket resolution activity. The ticket reports allow you to find high-volume trends, evaluate timely agent responses, and see common customer issues by breaking down tickets by inquiry type.
Many CRM providers also offer customer service management systems as separate products or built into a product suite. Freshdesk, for instance, offers both Freshsales as a sales CRM and Freshdesk for ticketing management. Users can track and collaborate on service tickets which allows managers to easily generate ticket reports. These show metrics like volume trends, ticket resolution times, and service performance by teams or individual reps.
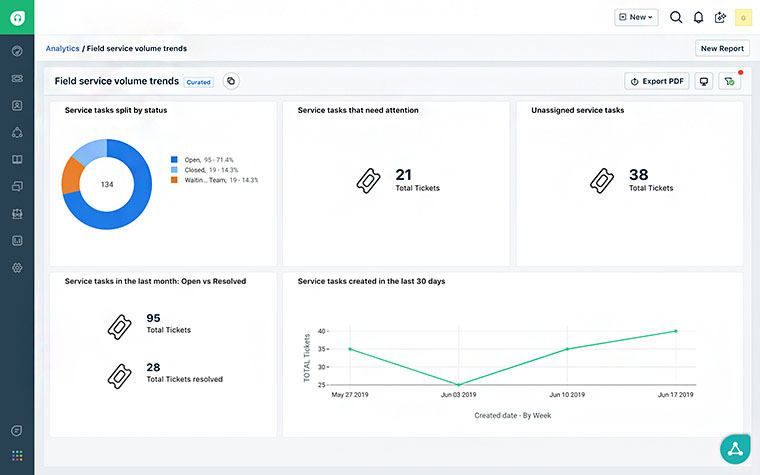
Freshdesk ticketing activity and performance dashboard (Source: Freshdesk)
To get full insights into this excellent customer support management platform, check out our Freshdesk review for details on features, pricing, and use cases.
Bottom Line
Sales reports are essential to predicting future outcomes and gaining a better understanding of your operation and performance, particularly in relation to a goal. Our free sales report templates offer an easy way to take your sales data and evaluate it visually for decision-making purposes. In addition to utilizing Google and Excel report templates, we encourage businesses to adopt a CRM to use as a robust database and subsequent reporting tool.
